Method of Selecting a Decontamination Site Deployment for Chemical Accident Consequences Elimination: Application of Multi-Criterial Analysis - MDPI
←
→
Page content transcription
If your browser does not render page correctly, please read the page content below
International Journal of
           Geo-Information

Article
Method of Selecting a Decontamination Site
Deployment for Chemical Accident Consequences
Elimination: Application of Multi-Criterial Analysis
Václav Talhofer 1          and Šárka Hošková-Mayerová 2, *
 1    University of Defence, Department of Military Geography and Meteorology, Kounicova 65, 662 10 Brno,
      Czech Republic; vaclav.talhofer@unob.cz
 2    University of Defence, Department of Mathematics and Physics, Kounicova 65, 662 10 Brno, Czech Republic
 *    Correspondence: sarka.mayerova@unob.cz; Tel.: +420-973-442-225

 Received: 26 February 2019; Accepted: 31 March 2019; Published: 2 April 2019

 Abstract: Multi-criterial analysis under the current use of digital geographic data is a quite common
 method used to evaluate the influence of the geographic environment on a planned or ongoing
 activity. The advantage of this method is a possibility of complex evaluation of all influences as
 well as a possibility to observe how the individual influences manifest in the final result. Its critical
 moment is establishing the structure of individual factors that influence the given activity, setting
 their weights and, subsequently, a choice of a suitable user function. The article provides guidelines
 how to set the individual decision-making criteria including setting their weights, and the application
 of the resulting user function in GIS environment with regards to the problem solved. Furthermore,
 the influence of change in weights of criteria on the complete result of the analysis is discussed.
 This article documents detailed studies that show how the results of solutions can differ in the same
 analytical task based on change in the weights of individual criteria. These studies are documented
 on a model example of a chosen suitable place for the deployment of decontamination center. Finally,
 the article describes possibilities of further development of the model solution, with the aim to make
 it a verified tool that may be implemented in the systems of command in Fire Rescue Service units
 and Chemical Troops units of the Czech Army.

 Keywords: geographic support; multi-criterial analysis; command and control system; decision
 making process

1. Introduction
     Information support of the Rescue System units, as well as Armed Forces, uses control systems
for their activities that are mainly based on information and communications systems technologies.
All systems require sufficient information support for the needs of quick and maximally effective
decision-making. That is the reason for implementing procedures using digital geographic data (DGD)
as a basic background for localization of subjects and objects of a critical situation in an area where the
situation is taking place. This data, however, is also used as a source of information for modelling the
impacts of current or expected actions on the complete situation, for projecting future intentions and
their planning etc. In all cases, it is necessary to have the knowledge of the quality of the used DGD
and of the influence of this quality on the complete decision-making process [1].
     Within decision-making processes, commanders and staff may follow—and they often do—their
own intuition and experience, for which they basically do not need any detailed analytical background.
However, in case of operations of a larger extent solved in larger areas, they cannot work without
so-called structured decision-making processes that are based on standing operational procedures

ISPRS Int. J. Geo-Inf. 2019, 8, 171; doi:10.3390/ijgi8040171                         www.mdpi.com/journal/ijgi
ISPRS Int. J. Geo-Inf. 2019, 8, 171                                                                 2 of 21

(SOP) and on the rules of their use [2,3]. Decision-making processes in the environment of information
and communication technologies (ICT) are above all structured processes. These processes often
use the method of multi-criterial analysis (MCA). It is also true for procedures during which the
influences of geographic environment on the performed activity are analysed, or when influences of
the performed activity on the geographic environment are analysed [4,5]. The whole procedure of
MCA is influenced by the choice of individual factors, by defining criteria for their evaluation, by the
methodology used for setting weights of these criteria and, finally, also by the choice of a suitable form
of the resulting user function.
      In order to perform such analyses, it is necessary to have corresponding DGD that enable
the subjects of the decision-making processes (commanders and staff) to evaluate the influence of
geographic environment on the fulfillment of tasks. This is an evaluation of factors of geographic
environment, i.e., the evaluation of influence of partial elements of this environment on the performed
activity, and subsequently the evaluation of the complete influence of the environment. For these
analyses, it is possible to use general tools for work with DGD that are a part of large program systems,
e.g., ArcGIS [6]. Partial analyses of individual factors, as well as the complete analysis, may be carried
out as process models whose output are raster files, in which the value of a raster cell is a classified
influence of a partial factor or all factors on the given activity. Such raster files are usually called a
cost map.
      The output of the MCA application are partial cost maps for the individual criteria and a resulting
cost map that is created using the given user function. Partial cost maps for the individual criteria
and the resulting cost map are limited not only by the process used for their creation, but also by the
quality of the used data.
      A cost map as a product of MCA is a result of modelling over geographic data, and that is why
it can never be the only basis for making decisions. The importance of the MCA is that above all it
reduces individual approaches to the evaluation of the influence of geographic environment on the
given activity. By an implementation of MCA into SOP for solving the assigned task, the commander
gets objective information about the influence of the geographic environment on the given task.
The importance of the cost map then lies especially in the characteristics of the given space in terms of
suitable and unsuitable conditions for the given activity.
      The quality of MCA strongly depends on the structure of criteria, system of their evaluation,
methodology of setting their weights, as well as on the choice of their user function form. Even though
there are general guidelines how to use the multi-criterial analysis in decision-making processes, it will
always depend on the concrete process for which MCA is used. That is why it is essential to make a
thorough analysis of the concrete process in terms of interfering factors that influence the solution,
and to furthermore evaluate the mutual interactions of factors, and to set objectivized criteria and their
weights to them that correspond to their importance for the complete solution. The last step is to set
up suitable user functions. The resulting MCA must be thoroughly verified by an independent test,
e.g., [7].
      The aim of the following text is to show possibilities of the use of DGD when solving a specific
(model) case, using SOP and MCA application during the solution of a crisis situation. As a model
example, the authors chose the task of selecting a decontamination site deployment to eliminate
chemical accident consequences. This is designed to carry out decontamination of civilians after being
contaminated by toxic substances. The result of the analysis is an evaluated potential of the countryside
for the deployment of this site in terms of realization of input requirements that enable the commander
of rescue units to increase efficiency of the whole decision-making process, and subsequently to also
increase efficiency of the used forces and equipment designated for the operation.
      The text structure is chosen in such a way that it shows the theoretical basis of the use of MCA,
and its practical application in GIS environment, including the presentation of how the change in
MCA parameters influences the result of the complete analysis. The model example is not a final and
ISPRS Int. J. Geo-Inf. 2019, 8, 171                                                                   3 of 21

verified application, but only a case study for the Fire Rescue Service and Chemical Troops units of the
Czech Army.

2. Multi-Criterial Analysis in Decision Making Process
       Multi-criterial analysis is a general tool that takes into consideration various points of view on the
given problem [8]. These points of view looked at using factors that influence the complete state of
result. Its advantage is that it works with factors that can be measurable as well as non-measurable.
In order to make it possible to work with both kinds of factors (i.e., with measurable as well as with
non-measurable), these factors are expressed with the help of criteria. Possible alternatives are then
evaluated according to several criteria, while the alternative evaluated the best according to one
criterion is usually not the best evaluated according to another criterion.
       Criteria may be quantitative or qualitative. Quantitative criteria are usually expressed in natural
grades, while for qualitative criteria a suitable scale is introduced, e.g., classification scale or a scale
such as: very high, high, average, low, and very low. At the same time the direction of a better
evaluation is defined, i.e., if maximal or minimal value is better, i.e., increasing or decreasing values.
Approaches to multi-criterial decision-making vary according to the character of a set of variants or a
set of allowable solutions. With regards to the fact that the individual criteria are in their nature either
maximizing or minimizing, it is necessary even before the beginning of the evaluation to transfer them
to only one type, i.e., either all criteria to be maximizing or minimizing.
       Standard techniques of multi-criterial decision-making are considered to be non-spatial, because
their basic presumption is homogeneity of the studied environment. However, if the methods of a
multi-criterial analysis are used when working with spatial (geographic) data, this presumption is
unreal because the concrete values of the evaluation criteria change in space.
       A spatial multi-criterial decision-making analysis then represents a significant deviation from
the conventional multi-criterial decision-making analysis due to the presence of the spatial element.
The spatial multi-criterial decision-making analysis requires data both corresponding to the evaluation
criteria as well as geographic localization of alternatives. Data are processed with the help of GIS tools
and multi-criterial decision-making. The spatial multi-criterial decision-making analysis is a process
that combines and transforms geographic data into a resulting decision that is usually visualized
in the form of raster files, in which the value of each pixel corresponds to the resulting value of the
multi-criterial analysis. These values are often called cost, and the complete raster file is then called a
cost map.
       The methods of a multi-criterial analysis are used in the preparation of background for
decision-making to prepare and control operations of units that move in real terrain. Therefore,
it is largely used, e.g., within the rescue units of the Integrated Rescue System or in the Armed Forces.
Results of such analyses are then implemented in the control systems. If the control system is based
on technologies of information and communication systems (ICT), then also the MCA results are
transferred to the control system in an electronic form within online or even offline connection.
       The resulting cost map can be projected separately. However, it is usually consider as a thematic
layer displayed on a raster image of topographic map, and then the cartographic rules for thematic
mapping must be accepted [9,10].

2.1. Methodology of Procedure of Spatial MCA Realization
     As it was mentioned in the introduction, decision-making is a process that involves a large
number of activities, starting with a recognition of the task, ending with a formulation of the resulting
recommendation. It has been proven that the quality of decision-making relies on the order in which
the individual activities are done. All decision-making tasks begin with a task recognition and definition.
The content of the task is thus actually a discovery of the difference between the current and required
state of things.
ISPRS Int. J. Geo-Inf. 2019, 8, 171                                                                  4 of 21

     Once the task is defined, it is followed by forming evaluation criteria. This step involves finding all
goals that describe all parts relating to the decision-making task and finding all means for reaching of
these goals. The found means are called attributes. Ratio scales for all attributes should be set in this
step, too. Each criterion should be complex, measurable, unambiguous, and comprehensible.
     Evaluation criteria are connected by geographic objects and relations among them and that is
why they may be displayed in the form of criterial maps. There are two kinds of criterial maps—a map
evaluating criteria and a map of restrictions. Maps evaluating criteria display a certain attribute that
may be used for an evaluation of an alternative. These maps are also introduced as attribute maps.
A map of restrictions displays restrictions of attribute values. Both criterial maps are analytical.
     For a spatial multi-criterial analysis, each criterion should be displayed with the help of map
layers. The analysis requires the values contained in the individual layers to be convertible into unified
units. An example of the simplest conversion of rough data into standardized units is a linear scale
transformation. Each value of a set of values is divided by the highest value of the set. The higher the
standardized value, the more positive value of a criterion. Most real decision-making tasks have their
restrictions that are given by characteristics and the quality of the used DGD.
     Creation (formulation) of alternatives follows? The basic rule that is necessary to keep when creating
alternatives is to make them reach evaluation criteria of decision-making tasks as best as possible.
     The level of importance of the given criterion is expressed by the criterion weight. One of the
basic methods how to assign weights is the ranking of criteria according to importance. Weights must
be normalized so that their sum equals 1. Weights of criteria may be calculated, e.g., with the help
of ranking or criteria evaluation. One of the simplest methods is a method using ranking and sum.
Based on this, the normalized weight of wj j-criterion is defined as follows:

                                                 n − rj + 1
                                           wj = P              ,                                        (1)
                                                  j n − rj + 1

where n is a number of criteria (k = 1, 2, . . . , n), and rj is a position of ranking of j-criterion.
       As each person or a group of people involved in the decision-making process has specific priorities,
it is logical that the results of the analysis will always be unique.
       In order to get the complete evaluation, the alternatives must be unified in terms of the used units
and value scales. This is done with the help of a suitable decision-making rule or a unifying function.
Decision-making rules define how to rank the alternatives from the most suitable to the least suitable
one. For spatial multi-criterial analysis, one of frequently used methods is simple additive weighting
(SAW). Multi-criterial decision-making technique consists of assigning each alternative a sum of values,
each one associated to the corresponding evaluation criterion, and weighted according to the relative
importance of the corresponding criterion. In particular, the method is based on weighted average
concept. The weights are assigned to each criterion and then the criterion is multiplied by the weight.
Then all criteria are added up together and the alternative with the highest value is marked as the
most suitable. Since a criterion is represented with the help of map layers, the method of overlay is
used, in map algebra language it is a function LocalSum.
       Setting the weights of criteria is one of the key problems of all models that use multi-criterial
analysis. Weights of the individual criteria may significantly influence—and they do—the result of
the decision-making process. Among the methods based on pairwise comparisons we can name the
analytic hierarchy process (AHP) method [11,12] or the DEMATEL method [13] and the best worst
method (BWM).
       Moreover, in a recently published article [14], a new multi-criteria problem solving method—the
full consistency method (FUCOM)—was proposed. The model implies the definition of two groups
of constraints that need to satisfy the optimal values of weight coefficients. This new method was
tested on several numerical examples from the literature, and the obtained results show that FUCOM
provides better results than the BWM and AHP methods, when the relation between consistency and
the required number of the comparisons of the criteria are taken into consideration.
ISPRS Int. J. Geo-Inf. 2019, 8, 171                                                                                  5 of 21

        However, the example is only a part of a case study. The authors used the simple additive
  weighting method. Now they are already working with the results of the article [14] and they are
  trying to use this new method for verification of their conclusion and/or obtaining better results of
  MCA in a way that the subjective influence when setting criteria will be subdued.
        The next step in the whole procedure is a sensitivity analysis whose aim is to set the robustness
  of the complete solution. The sensitivity analysis sets whether the recommended alternative to the
  decision is sensitive to changes in input data. Its goal is to identify the efficiency of the change in input
ISPRS Int. J. Geo‐Inf. 2019, 8, x FOR PEER REVIEW
  data (geographic data or priority of those who do the analysis) and what changes it induces5in                      of 22
                                                                                                                         the
  results,  recommendations          and  consequences.     If the changes   do not  have  a significant  influence
on the analysis results, then the ranking of alternatives is considered to be robust. If it is not the case,         on  the
it is possible to use the newly acquired information and go a few steps back. The sensitivity analysisis
  analysis    results,   then   the  ranking   of alternatives   is considered   to be  robust. If it is not the  case, it
  possible
may     helptotheuseresearcher
                       the newly acquired
                                     to better information
                                                understandand   thego  a few
                                                                     task  andsteps
                                                                                 the back. The sensitivity
                                                                                      individual   elements,analysis    may
                                                                                                                 and thus
  help   the  researcher    to   better understand    the  task
contribute to the choice of the best variant of the decision.    and  the individual   elements,  and   thus  contribute   to
  the The
       choice   of the   best   variant  of the decision.
             last step of the analysis is a formulation of a recommendation for future proceeding. This
        The
recommendation last step      of the
                         should         analysis
                                   be based    on is     formulation
                                                   thea previous        of and
                                                                    steps  a recommendation     for future
                                                                                may be supplemented            proceeding.
                                                                                                            also  with an
  This  recommendation           should   be based   on the
analysis of possible consequences of a concrete decision.    previous   steps and  may   be  supplemented      also with an
  analysis of possible consequences of a concrete decision.
2.2. Application of Multi‐Criterial Analysis for Solution of a Concrete Geographic Problem
 2.2. Application of Multi-Criterial Analysis for Solution of a Concrete Geographic Problem
      In order to illustrate the previously mentioned theory, the authors chose a simple example of
       In order to illustrate the previously mentioned theory, the authors chose a simple example of
searching for a suitable deployment location of a standardly understood place of decontamination
 searching for a suitable deployment location of a standardly understood place of decontamination
designed to realize decontamination of civilians and vehicles after being contaminated by toxic
 designed to realize decontamination of civilians and vehicles after being contaminated by toxic
substances. The example is based on a real standing operational procedure that is used by the rescue
 substances. The example is based on a real standing operational procedure that is used by the rescue
units, and in a similar way also by the decontamination units of Chemical Troops of the Armed
 units, and in a similar way also by the decontamination units of Chemical Troops of the Armed Forces.
Forces. For the purposes of this article, the procedure was simplified so as to show the applied
 For the purposes of this article, the procedure was simplified so as to show the applied methodology
methodology of MCA and its application in a solution of a spatially analytical task. In the figures
 of MCA and its application in a solution of a spatially analytical task. In the figures below, there are
below, there are examples of a decontamination site acquired during exercise in 2015 (Figure 1).
 examples of a decontamination site acquired during exercise in 2015 (Figure 1).

                                    Figure 1. Examples of the decontamination site [15].
                                   Figure 1. Examples of the decontamination site [15].

        When decontaminating and removing the consequences of mass destruction weapons abuse
      When decontaminating and removing the consequences of mass destruction weapons abuse and
  and dangerous industrial substances abuse, one of the decisive factors of the operation’s success
dangerous industrial substances abuse, one of the decisive factors of the operation’s success rate is
  rate is an evaluation of the influence of geographical environment on the activities related to the
an evaluation of the influence of geographical environment on the activities related to the fulfilling
  fulfilling of the task [16,17]. The geographical environment may accelerate, or on the contrary postpone,
of the task [16,17]. The geographical environment may accelerate, or on the contrary postpone, the
  the time of initiation of the action and its completion time, thus influencing the whole operational
time of initiation of the action and its completion time, thus influencing the whole operational
  effectiveness of the combat activity. Therefore, it is essential for the intervention commander—or the
effectiveness of the combat activity. Therefore, it is essential for the intervention commander—or the
  Chemical Troops unit—to have accurate and detailed information about the geographic environment,
Chemical Troops unit—to have accurate and detailed information about the geographic
  especially in a case when the action must be carried out in a vast area that is not known and explored
environment, especially in a case when the action must be carried out in a vast area that is not known
  in advance. Such an action may be, for example, decontamination of civilians after the use of weapons
and explored in advance. Such an action may be, for example, decontamination of civilians after the
  of mass destruction, or a consequence of leakage of dangerous industrial substances after an industrial
use of weapons of mass destruction, or a consequence of leakage of dangerous industrial substances
after an industrial infrastructure device accident, or an extensive use of extermination agents causing
the occurrence of biological contamination [18–20]. Among the background information that a
commander may get is also the evaluation of the influence of the geographical environment on a
specific activity that shall be carried out within the decontamination action. A suitable method when
evaluating the influence of geographical environment is a multi‐criterial analysis and use of digital
ISPRS Int. J. Geo-Inf. 2019, 8, 171                                                                    6 of 21

infrastructure device accident, or an extensive use of extermination agents causing the occurrence of
biological contamination [18–20]. Among the background information that a commander may get is
also the evaluation of the influence of the geographical environment on a specific activity that shall be
carried out within the decontamination action. A suitable method when evaluating the influence of
geographical environment is a multi-criterial analysis and use of digital geographic data. The paper
presents the methodology of the use of multi-criterial analysis using digital geographic data and
gives guidelines how to set the individual decision-making criteria, including setting their weights
and application of the resulting utility value function in GIS environment with regards to the solved
problem. It also evaluates the influence of change in criteria weights on the complete final result of the
analysis. There are detailed studies of differences in solution results of the same analytical task with
changed weights of the individual criteria, and these studies are documented on a model example.
Finally, this paper describes possibilities of further development of the model solution with the aim to
transform it into a verified tool that may be included into the control system of Fire Rescue System and
units of Chemical Troops of the Czech Army.
      The model situation describes a case when there was a chemical substance leakage into the
environment in a given space with the dimensions of 40 × 40 km [21]. It is considered to be such a
toxic substance that it requires individual protection before the process of decontamination begins.
This means it must be present in the terrain and will thus require planning, organization, and fulfillment
of tasks of decontamination of terrain [22–24]. Based on monitoring of the meteorological situation in
the place of incident (leakage, accident), an impact area and an endangered area were defined [25,26].
Apart from these spaces, it is necessary to find suitable places for the deployment of decontamination
site (DS) according to the following conditions [27]:

•     slope inclination up to 5◦ ;
•     sustainable soil for the movement of special chemical equipment in the long-term;
•     as close as possible to paved communications;
•     away from forests;
•     as close as possible to water sources;
•     with regards to possible contamination of unaffected population should be away from
      resident areas;
•     area of approx. 2.5 km2 ;
•     abundance of water source; and
•     with suitable access and exit communications.

      The abovementioned conditions are established as optimal. The choice of a particular area then
depends on the size and shape of the selected area and the variability of the slopes. An on-site survey
is required before the deployment techniques and technologies for the decontamination are used.
      In case there is no water source in the chosen locality, it is necessary to plan the transport of water
from the nearest water source with the help of special chemical equipment that uses a special add-on
on a standard chassis of a truck, under the following conditions:

•     as short driving distance to a given water source as possible;
•     the vehicle must get to the source to the distance of maximum 10 m as it is not equipped with
      longer suction hoses for pumping of water;
•     passable terrain for a vehicle, also in case it will need to move in terrain with full tanks; and
•     limited heights of banks due to the limited suction height.

     A model space in the central part of Bohemian–Moravia Highlands was chosen for the model
situation. The intervention anti-chemical unit is hypothetically dislocated in Žd’ár nad Sázavou on the
northwest border of the secured area (Figure 2).
ISPRS Int. J. Geo-Inf. 2019, 8, 171 7 of 21
ISPRS Int. J. Geo‐Inf. 2019, 8, x FOR PEER REVIEW 7 of 22
Figure 2. Area of responsibility (modelled example).
A
A geographical
geographical problem
problem is is to
to select
select suitable
suitable places
places in in the
the given locality outside
given locality outside the impacted and
the impacted and
endangered
endangered area areawhere
whereititwould
wouldbebepossible
possible toto
place
placethethe
mentioned
mentioned decontamination
decontamination sitesite
so that in the
so that in
given area this facility was functional and the terrain configuration would not
the given area this facility was functional and the terrain configuration would not restrict it or restrict restrict it or restrict it in
an acceptable
it in way [27–30].
an acceptable The following
way [27–30]. The followingtext provides a description
text provides of the procedure
a description when solving
of the procedure when
this model example.
solving this model example.
The
The goal
goalof ofthe
thesolution
solution(task
(taskdefinition)
definition) waswasto search
to searchfor places that meet
for places conditions
that meet for thefor
conditions given
the
space. These conditions
given space. are minimal
These conditions dimensions
are minimal of an area of
dimensions foran distribution of elements (workplaces)
area for distribution of elements
of DS, maximalofinclination
(workplaces) DS, maximal of slopes, soil ableofto slopes,
inclination bear movement
soil ableofto equipment, corresponding
bear movement distance
of equipment,
from communications, water bodies, resident areas, and it must be
corresponding distance from communications, water bodies, resident areas, and it must be away away from forests and, at the same
time, away from
from forests and,the contaminated
at the same time, and away endangered areas.
from the contaminated and endangered areas.
First
First of all, it was necessary to understand the factors that influence the
of all, it was necessary to understand the factors that influence the complete
complete solution
solution of of the
the
problem and form these structures into a clear structure. With the individual
problem and form these structures into a clear structure. With the individual factors, it was necessary factors, it was necessary
to
to choose
choose evaluation
evaluation criteria
criteria and
and setset their
their weights.
weights. In In this
this case,
case, thethe choice
choice of of aa suitable
suitable place
place waswas
influenced by factors of terrain elevation, its soil surface, communication
influenced by factors of terrain elevation, its soil surface, communication conditions, vegetation conditions, vegetation cover,
hydrological conditions,
cover, hydrological resident
conditions, areas, areas,
resident and areaandofareaDS of[31,32]. Even Even
DS [31,32]. though waterwater
though sources are also
sources are
evaluated in terms of their abundance within SOP, this evaluation was
also evaluated in terms of their abundance within SOP, this evaluation was not considered in the not considered in the model
example
model exampledue to duecomplicated accessaccess
to complicated to relevant data. data.
to relevant ThatThatis why this this
is why factor waswas
factor notnot included
included in
the analysis.
in the analysis.
While
While solving
solving the the model
model example,
example, it it was
was required
required thatthat the
the chosen
chosen space
space would
would be be inin aa relatively
relatively
flat terrain, on a suitable soil that is sufficiently bearable for the used equipment,
flat terrain, on a suitable soil that is sufficiently bearable for the used equipment, within the reach within the reachof
of communications,
communications, in aintreeless
a treelessareaarea
andandcloseclose to substantial
to substantial water water sources,
sources, and far
and also alsoenough
far enough
from
from
residentresident
areas.areas. The individual
The individual factorsfactors
were were evaluated
evaluated by measurable
by measurable or classifiable
or classifiable criteria.
criteria. The
The following
following criteria
criteria werewereusedused
in thein following
the following example
example (Table(Table
1): 1):
In case the water source was located outside the proposed workplace, it was also necessary to
evaluate the1.possibilities
Table for the
Evaluation criteria fortransport
the choiceof of water from
a suitable thefor
place nearest water source.
a decontamination siteA multi-criterial
dislocation.
analysis was also used to model the possibilities of transport. However, this analysis is already a part
Factor Evaluation criterion
of the solution for terrain passability described, for instance, in [1,32].
Relief of terrain Inclination of slopes
Soil type Classification of soil types
Communication
Distance from the nearest communication
relations
Vegetation Size of treeless area
ISPRS Int. J. Geo-Inf. 2019, 8, 171 8 of 21
ISPRS Int. J. Geo‐Inf. 2019, 8, x FOR PEER REVIEW 8 of 22
Table 1. Evaluation criteria for the choice of a suitable place for a decontamination site dislocation.
Distance from the nearest water course and body of
Waters
Factor Evaluation
water Criterion
Built‐up
Relief area
of terrain Out of built‐up of
Inclination area
slopes
Soil
Areatype
of Classification of soil types
Communication relations Size (minimal
Distance fromsize) of chosen
the nearest area
communication
decontamination site
Vegetation Size of treeless area
In case the water
Waterssource was locatedDistance
outsidefrom
the the
proposed workplace,
nearest water course it was
and also
body of necessary
water to
evaluate the possibilities
Built-up areafor the transport of water from the nearest water
Out of built-up area source. A multi‐criterial
analysisArea
was of
also used to modelsite
decontamination the possibilities of transport. However,
Size (minimal size) of this analysis
chosen area is already a part
of the solution for terrain passability described, for instance, in [1,32].
When solving aa real
When solving realsituation,
situation,interactions
interactionsamong
amongthe the individual
individual factors
factors must
must alsoalso be searched
be searched for.
for.
In this simplified example, however, it was not necessary, apart from one exception in the in
In this simplified example, however, it was not necessary, apart from one exception lastthe last
factor
factor
(size of(size of the area),
the chosen chosentoarea), to evaluate
evaluate mutual relations
mutual relations among the among the individual
individual factors, as factors, as the
the individual
individual factors are independent
factors are independent of each
of each other. Theirother. Their
influence oninfluence on the
the solution solution
of the problemof the
may problem may
be therefore
be therefore determined separately. That is why the complete hierarchy of the process
determined separately. That is why the complete hierarchy of the process solution conditions could be solution
conditions
expressed in could be expressed
the form in the form
of a hierarchical of a hierarchical
scheme (Figure 3). scheme (Figure 3).
Figure 3. Hierarchy of the conditions of the process scheme.
Figure 3. Hierarchy of the conditions of the process scheme.
The influence of the individual factors may be evaluated from various data which, however,
should beinfluence
The of the sameof the individual
qualitative factors may ifbepossible,
characteristics evaluated from various
especially the leveldata ofwhich, however,
detail (LOD) for
should
geometry beasofwell
the same
as for qualitative characteristics
their attributes. The used data if possible,
layers mayespecially the level
be of vector, of detail
as well (LOD)
as raster for
format,
geometry
containingasnecessary
well as for their
data inattributes.
various data Thetypes.
used dataThatlayers
is whymay it isbe of vector,
essential as well ashow
to identify raster format,
these data
containing necessary data in various data types. That is why it is essential
will be used for each evaluation criterion. For each evaluation criterion, minimal values of criteria to identify how these data
will be to
are set used for eachevaluate
positively evaluation thecriterion.
given factors For each
in theevaluation
complete criterion,
solution modelminimal values ofofcriteria
of solution are
the given
set to positively evaluate the given factors in the complete solution
problem. The whole procedure of the factor influences evaluation may be processed in the form of model of solution of the given
problem. The whole procedure of the factor influences evaluation may be processed in the form of
process models.
process models.
The first factor—the factor of terrain elevation—deals with the requirement for relatively flat
The
terrain. Whenfirst factor—the
searching for factor of terrain
suitable elevation—deals
localities, it is necessarywith the requirement
to create a map of relief forinclination
relatively [33].
flat
terrain.
The processWhen searching
model will thenfor suitable
contain alocalities,
calculation it isofnecessary to create awhere
slopes inclination, map of therelief
inputinclination
data layer[33].
will
The process model will
be a digital elevation model. then contain a calculation of slopes inclination, where the input data layer
will be
The a digital
secondelevation
factor deals model.
with a soil type. In the place of decontamination site, there will be a large
number of people and vehicleswith
The second factor deals a soilon
moving type. In thethat
a surface place
willofalso
decontamination
be wetted by rinse site,water
there (contaminated
will be a large
number of people and vehicles moving on a surface that will
water is captured so that there is no threat to the environment and after the decontamination also be wetted by rinse waterit is
(contaminated
ecologically disposed of). It is necessary to decide what soil, in terms of soil type, is suitable for the
water is captured so that there is no threat to the environment and after the
decontamination
activity in the given it isspace
ecologically
[34]. Asdisposed of). It is it
the most suitable necessary
seems toto setdecide what from
a hierarchy soil, intheterms
mostof to soil
the
type, is suitable for the activity in the given space [34]. As the most suitable
least suitable one. For the evaluation itself, it is possible to use typing of soil types contained in the it seems to set a hierarchy
from
digitalthesoilmost
map.to the least suitable one. For the evaluation itself, it is possible to use typing of soil
typesThecontained in thedeals
third factor digitalwithsoil the
map.distance of communications from the potential places of DS
The third
dislocation. Forfactor
DS, it is deals with the
important distance
to be—if of communications
possible—within the reach from thecommunication
of the potential places of DS
network
dislocation. For DS, it is important to be—if possible—within the reach
and for the vehicles to move on an unpaved surface as little as possible. That is why it is necessary to of the communication
network
create a map and of
fordistances
the vehicles to thetonearest
move communication.
on an unpaved surface Therefore, as little as possible.
the model That aisprocess
will contain why it ofis
necessary to create for
distance calculation a map whichof the
distances
input datato thelayer nearest
will becommunication.
a communication Therefore,
network.the model will
contain a process of distance calculation for which the input
The fourth factor deals with the influence of vegetation, especially of forest data layer will be a covers.
communication
For the
network.
deployment of DS, continuous treeless area with given minimal dimensions and area is ideal. In this
The fourth factor deals with the influence of vegetation, especially of forest covers. For the
deployment of DS, continuous treeless area with given minimal dimensions and area is ideal. In this
step, a map of treeless areas with information about their size will be created. Therefore, the model
must contain a process of search for treeless areas whose input data will be a layer of vegetation.
ISPRS Int. J. Geo-Inf. 2019, 8, 171 9 of 21
ISPRS Int. J. Geo‐Inf. 2019, 8, x FOR PEER REVIEW 9 of 22
step, a map of treeless areas with information about their size will be created. Therefore, the model
mustThecontain
fifthafactor
process of search
deals for treeless
with the distanceareasfromwhose
suitable input datasources.
water will be Technologies
a layer of vegetation.
used in DS
Thea fifth
require largefactor
amountdeals of with
waterthe fordistance from suitable
the preparation water sources. blends
of decontamination Technologiesand thenused in DS
also for
require
rinsing aoflarge amount
especially of water for thevehicles.
decontaminated preparationThe of
mostdecontamination
suitable placesblends and thenlocalities
are, therefore, also for rinsing
which
of
haveespecially
the neededdecontaminated
source withinvehicles.
the reachThe most suitable
of suction hoses of places
unitsare, therefore,
designed localities which have
for decontamination.
the needed
If theresource
are nowithin
water the reachinofthe
sources suction
place,hoses
then of units
it is designed
essential for these
to find decontamination.
sources in the nearest
surroundings of DS. That is the reason the next step is to create a map of distances from in
If there are no water sources in the place, then it is essential to find these sources the nearest
surface water
surroundings
sources. The modelof DS. will
Thatcontain
is the reason
a processthe next step is to create
of calculation a map of
of distances to distances
water sources from for
surface
whichwater
the
sources.
input data The model
layer willwill
be acontain
layer ofawaters.
process of calculation of distances to water sources for which the
inputThedatasixth
layerfactor
will beevaluates
a layer ofthe
waters.
influence of resident areas. DS should be located outside of
The areas
resident sixth factor
in orderevaluates
to avoid the influence contamination
secondary of resident areas. DS shouldThus,
of civilians. be located
the modeloutside of resident
must contain
areas in order
a process to avoid secondary
for searching distances fromcontamination
settlements of for
civilians.
which Thus,
a layerthe
of model
built‐up mustareacontain
will beaitsprocess
input
for
data.searching distances from settlements for which a layer of built-up area will be its input data.
The last factor is a corresponding size of area. This factor is evaluated at the end of the complete
analysis, when
whenallall preceding
preceding factors havehave
factors been been
evaluated and when
evaluated anditwhen
is possible
it is topossible
say whattodimensions
say what
the suitable the
dimensions localities
suitableshould have.should
localities Suitable localities
have. Suitable arelocalities
sorted according
are sortedtoaccording
their value to from
their avalue
cost
map
fromand at the
a cost map same
andtime
at theaccording
same time to the size of ato
according continuous
the size ofarea with a given
a continuous areacostwith
range of all cells
a given cost
inside. The resulting cost map works as input data for this process.
range of all cells inside. The resulting cost map works as input data for this process.
Based on an an analysis
analysisof offactors
factorsand andcriteria
criteriaofoftheir
theirevaluation,
evaluation,a process
a process scheme
scheme was
was created.
created. It
It contains
contains basic
basic conditions
conditions asas well
well asas input
input data,
data, processes,
processes, and
and outputs
outputs (Figure4).4).
(Figure
Figure 4. Scheme of the selection process model of a suitable place for decontamination site deployment.
Figure 4. Scheme of the selection process model of a suitable place for decontamination site
3. Obtained Results
deployment.
The multi-criterial analysis itself was realized when evaluating the individual factors influence on
3. Obtained Results
the suitability assessment of the given space for the DS deployment, i.e., a search for alternatives.
The multi‐criterial analysis itself was realized when evaluating the individual factors influence
3.1. Setting of Weights
on the suitability of Factors
assessment of the given space for the DS deployment, i.e., a search for alternatives.
Based on an expert estimation of seven workers who deal with conditions of decontamination in
3.1. Setting
real life, theof Weights ofof
importance Factors
the individual factors influence—with the exception of the corresponding size
of a chosen
Based area—was
on an expert setestimation
as a normalized value
of seven (Table 2).
workers whoExpert
deal estimation was gained
with conditions from a guided
of decontamination
discussion
in real life, with
thetheimportance
above-mentioned
of theworkers.
individualFinally, all participants
factors completed
influence—with the aexception
questionnaire in
of the
which they ranked the importance of the individual factors using Equation (1). A similar
corresponding size of a chosen area—was set as a normalized value (Table 2). Expert estimation was example of
the use of
gained expert
from evaluation
a guided can be found
discussion with inthe
[35].
above‐mentioned workers. Finally, all participants
completed a questionnaire in which they ranked the importance of the individual factors using
Equation (1). A similar example of the use of expert evaluation can be found in [35].
Table 2. Weights of factors and evaluation criteria.
Factor Evaluation Criterion Weight of Factor
Relief of terrain Inclination of slopes 0.25
Soil type Classification of soil types 0.15
ISPRS
ISPRS Int.
Int. J.
J. Geo-Inf. 2019, 8,
Geo‐Inf. 2019, 8, 171
x FOR PEER REVIEW 10
10 of
of 21
22
Communication Distance from the nearest
Table 2. Weights of factors and evaluation criteria. 0.12
relations communication
Vegetation
Factor Size of treeless
Evaluation area
Criterion 0.09 of Factor
Weight
Relief of terrain DistanceInclination
from the of nearest
slopes water 0.25
Waters
Soil type Classification of soil types 0.310.15
Communication relations
course and body of water
Distance from the nearest communication 0.12
Built‐up area
Vegetation OutSize
ofofbuilt‐up
treeless areaarea 0.080.09
Waters Distance from the nearest water course and body of water 0.31
Area of
Built-up area Out of size)
built-up
Not set in the first
Size (minimal ofarea
chosen area 0.08
Area decontamination
of decontamination site site Size (minimal size) of chosen area evaluation
Not set in the first evaluation
3.2. Realization of the Analysis
3.2.
For the
For the model
model example,
example, itit was
was used:
used: position
position model DMÚ25 [36], elevation
elevation model
model DMR4DMR4 [37]
[37]
and Purpose-built
and Purpose‐built SoilSoil Database—PSD
Database—PSD [38]. All analysis were done using using program
program system
system ArcGIS
ArcGIS
10.4.1 [6]
10.4.1 [6] including
including additional
additionalmodules
modules(Extensions).
(Extensions). For
For all
all calculations
calculations itit was
was chosen
chosen toto use
use geodetic
geodetic
coordinate system
coordinate system WGS84
WGS84 andand projection
projection UTM33N.
UTM33N. When When itit was
was used
used with
with raster
raster files,
files, the
the pixel
pixel size
size
of 10
of 10 mm was
was used
used [39].
[39].
In the
In the phase
phase ofof the
the realization
realization ofof the
the analysis,
analysis, aa choice
choice of
of suitable
suitable tools
tools for
for partial
partial analyses
analyses ofof
influences of
influences of the
the individual
individual factors
factors and
and for
for the
the evaluation
evaluation of
of the
the complete
complete influence
influence ofof all
all factors
factors was
was
considered. Furthermore,
considered. Furthermore, classification
classification of acquired information was also considered so that it it was
was
possible to
possible to classify
classify this
this information
information in in aa unified
unifiedevaluation
evaluationscale.
scale.
The whole
The whole procedure
procedure of of the
the solution
solutioncan canbebeshown
shownon onaasimple
simpleflow
flowchart
chart(Figure
(Figure5).5).
Figure 5. Flow
Figure 5. Flow chart
chart of
of the
the whole
whole process.
process.
The
The tool
toolSlope
Slopewas
wasused
usedforforthe
thecalculation
calculation of of
slope inclinations.
slope TheThe
inclinations. calculation gave
calculation a raster
gave file
a raster
of slope inclinations, in which the slope inclination is given as a value of the given pixel.
file of slope inclinations, in which the slope inclination is given as a value of the given pixel. A tool A tool for
calculation of Euclidean distance was used for the calculation of distance, whose
for calculation of Euclidean distance was used for the calculation of distance, whose output is again output is again a
raster field.
a raster The
field. value
The of each
value pixelpixel
of each in this
in field is a Euclidean
this field distance
is a Euclidean of a pixel
distance of acentre
pixel from
centrethefrom
nearest
the
source, e.g., communication, water course, body of water, forest, etc. The following
nearest source, e.g., communication, water course, body of water, forest, etc. The following pictures pictures show
examples of cutouts
show examples of from a raster
cutouts fromlayer of slope
a raster inclinations
layer of slope(Figure 6a), distance
inclinations (Figureto communications
6a), distance to
(Figure 6c), distance to waters (Figure 6e), and to built-up areas (Figure 6f).
communications (Figure 6c), distance to waters (Figure 6e), and to built‐up areas (Figure 6f).ISPRS Int. J. Geo-Inf. 2019, 8, 171 11 of 21
ISPRS Int. J. Geo‐Inf. 2019, 8, x FOR PEER REVIEW 11 of 22
(a) (b)
(c) (d)
(e) (f)
Figure 6.
Figure 6. (a) Cutout of a raster layer of inclination of slopes analyzed from from the raster
raster digital
digital elevation
elevation
model (DMR4).
model (DMR4). (b) Cutout of a raster layer of of soil
soil types.
types. (c) Cutout of a raster
raster layer
layer of
of Euclidean
Euclidean
distanceto
distance tocommunications.
communications.(d) (d)Cutout
Cutout of of a raster
a raster layer
layer of vegetation
of vegetation types.
types. (e) Cutout
(e) Cutout of a raster
of a raster layer
layer of Euclidean distance to waters. (f) Cutout of a raster layer of Euclidean distance
of Euclidean distance to waters. (f) Cutout of a raster layer of Euclidean distance to built-up area. to built‐up
area.
For the analysis of soil suitability codes of soil type from a database of soils [38] were used which
contains
For classifications
the analysis of of soil
soil types according
suitability codes ofto Table
soil type3.from a database of soils [38] were used which
Flat classifications
contains objects of soil of
types
soilwere
typestransformed
according toby a conversion
Table 3. function from a vector format into
a raster file, in which the value of a pixel is a code of soil type. The result of such transformation is
obvious from a picture (FigureTable 3. Codes ofasoil
6b). Similarly, types
raster fileaccording to [38].layer of vegetation was taken,
from a vector
in which a value of a pixel is a code of vegetation type given in the table (Table 4). An example of
Code Soil Type
visualized data can be seen in the picture (Figure 6d).
001 Weak soil (sandy)
002 Lighter moderate soil (loam‐sandy)
003 Moderate soil (loam)
004 Stronger moderate soil (clay‐loam)ISPRS Int. J. Geo-Inf. 2019, 8, 171 12 of 21
Table 3. Codes of soil types according to [38].
Code Soil Type
001 Weak soil (sandy)
002 Lighter moderate soil (loam-sandy)
003 Moderate soil (loam)
004 Stronger moderate soil (clay-loam)
005 Strong soil (clay)
996 Built-up area
997 Water area
998 Not defined
Table 4. Codes of vegetation types [36].
Code Vegetation Type
EA030 Forest nursery
EA040 Orchard
EA050 Vineyard
EB010 Pasture, meadow
EB020 Scrubs
EC015 Forest
NoData No vegetation
Values of pixels in all input layers were changed into a raster file by a method of their transformation.
That is why it was necessary to set a way of usage of these values in terms of their influence on the
complete analysis. One of the ways how to reach this is to assign number values to classes in each map
layer, i.e., reclassify them.
During reclassification the values of pixels of each layer were divided depending on the extent of
suitability for the given purpose. The division was done in a way so that the original values were put
into ten classes where numbers 1–10 were new values of the individual pixels. Number 10 represented
the best value and number 1 on the contrary the worst value. Based on the character of the raster file
content, the method of automatic or manual scaling was chosen.
Automatic scaling into 10 levels of suitability was chosen with all layers that reached the value
of Euclidean distance. In case of slope inclination with regards to the condition for the activity of
DS only two levels were chosen: 10 for places with slope inclination up to 5◦ and 1 for other values.
With respect to the directive [27] all the terrain less than or equal to 5◦ is equally appropriate for DS.
Manual scaling was chosen for classification of enumeration (nominal) value, i.e., for the
reclassification of types of soil and vegetation. In the model example in terms of soils, places
with light soil are suitable, or also lighter moderate soil, less suitable are places with moderate, stronger
moderate, and strong soil [34,40]. Unsuitable places are those where in terms of surface coverage there
are identified built-up areas outside of villages and bodies of water. The used values are given in the
table (Table 5).
Table 5. Codes of soil types and their suitability for deployment of DS.
Code Soil Type Suitability Coefficient
001 weak soil (sandy) 10
002 lighter moderate soil (loam-sandy) 10
003 moderate soil (loam) 9
004 stronger moderate soil (clay-loam) 8
005 strong soil (clay) 7
996 built-up area 1
997 water area 1
998 not defined 1ISPRS Int. J. Geo‐Inf. 2019, 8, x FOR PEER REVIEW 13 of 22
including forest nurseries, orchards, and vineyards, are considered unsuitable [41,42]. These values
are added in Int.
ISPRS theJ. Geo-Inf.
table 2019,
(Table
8, 1716). 13 of 21
Table 6. Codes
Reclassification of vegetation
of vegetation types
was done and their
similarly. In suitability for deployment
terms of vegetation type, the of DS. places
suitable
are without forest cover, acceptable are pastures and meadows, and also bush covers. Forest covers,
including forestCode
nurseries, orchards, Vegetation
and vineyards,Type
Suitability
are considered unsuitable [41,42]. These values
are added in the table (Table 6). Coefficient
EA030 Forest nursery 1
Table 6. Codes of vegetation types and their suitability for deployment of DS.
EA040 Orchard 1
EA050
Code Vineyard
Vegetation Type 1
Suitability Coefficient
EB010
EA030 Pasture, meadow
Forest nursery 1 7
EA040 Orchard 1
EB020
EA050 Scrubs
Vineyard 1 6
EC015
EB010 Pasture,Forest
meadow 7 1
EB020 Scrubs 6
NoData
EC015
NoForest
vegetation 1
10
NoData No vegetation 10
In reclassified classes the individual pixels have the same influence on the result and they differ
only internally by their value.
In reclassified classesHowever,
the individualsince each
pixels individual
have evaluation
the same influence criterion
on the result and has itsdiffer
they own weight
only internally by their value. However, since each individual evaluation criterion has
(Table 2), it is necessary to apply these weights in the final multi‐criterial analysis. By the application its own weight
(Table 2), it is necessary to apply these weights in the final multi-criterial analysis. By the application
of MCA in the GIS environment a so‐called cost map is calculated. It is created by a combination of
of MCA in the GIS environment a so-called cost map is calculated. It is created by a combination of
the partial
thereclassified files.files.
partial reclassified The Theinput criteria
input criteriaare
aremultiplied
multiplied bybythethe weights
weights and added
and then then added
together.together.
For the calculation itself itself
For the calculation it is possible to to
it is possible use
usetools
tools of mapalgebra
of map algebra or weighted
or weighted overlayoverlay
(Figure(Figure
7). The 7). The
final result of a process model is shown in the next picture (Figure 8).
final result of a process model is shown in the next picture (Figure 8).
FigureFigure
7. Example of setting
7. Example weights
of setting weights of entrylayers
of entry layers with
with weighted
weighted overlay.
overlay.
The resulting cost map only presents potential of the countryside for the deployment of
decontamination site. The intervention commander, however, needs information about the size
of available areas with the required characteristics that lie outside the impacted and endangered area.
That is why it is necessary to transform the cost map from a raster into vector format. This transformation
provides polygons whose attribute will be a value of suitability for deployment of DS and at the same
time also areas of these polygons.ISPRS Int. J. Geo-Inf. 2019, 8, 171 14 of 21
In the next step, all polygons with the highest value suitability and at the same time with a
corresponding area for deployment of DS which are larger or equalled 2.5 km2 are chosen. If such
areas are not found, it is necessary to decrease the requirement for the level of suitability and make a
required choice again according to area.
ISPRS Int. J. Geo‐Inf. 2019, 8, x FOR PEER REVIEW 14 of 22
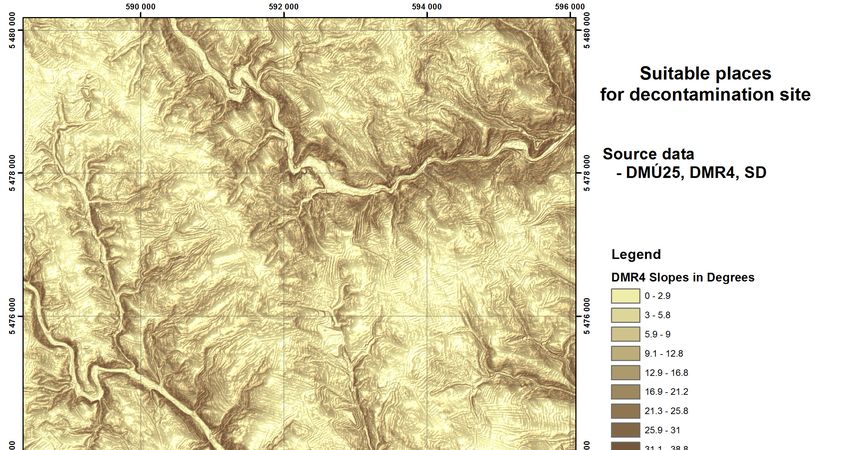
Figure 8. Cost
Cost map
map for
foran
anevaluation
evaluationofofsuitable places
suitable forfor
places thethe
deployment of the
deployment decontamination
of the site
decontamination
from data of DMU25, DMR4, and SD.
site from data of DMU25, DMR4, and SD.
The
The final step of
resulting themap
cost complete
only analysis
presentsispotential
to chooseoffrom the those potential
countryside forplaces that are inside
the deployment of
the impacted andsite.
decontamination endangered zone. Only
The intervention then this analysis
commander, however, gives
needs theinformation
interventionaboutcommander
the sizetheof
information about possibilities of deployment of DS and then it is his/her
available areas with the required characteristics that lie outside the impacted and endangered area. decision which places to
choose
That iswithwhyregards to the whole
it is necessary situation inthe
to transform the cost
securedmapspace.from a raster into vector format. This
The mentioned
transformation stepspolygons
provides were appliedwhoseto the modelwill
attribute example.
be a valueAfterofthe transformation
suitability of the costofmap
for deployment DS
into a vector format required polygons
and at the same time also areas of these polygons. were provided. However, in the subsequent analysis it turned
out that none
In the of step,
next the areas with a higher
all polygons with value of suitability
the highest for the deployment
value suitability and at theofsame DS—which
time with wasa
10—did not meet the requirements regarding its dimensions. That is
corresponding area for deployment of DS which are larger or equalled 2.5 km are chosen. If suchwhy the requirement
2 for suitability
was
areasdecreased and ititwas
are not found, searched for
is necessary places that
to decrease thehad the value for
requirement of suitability
the level of 9–10. From these
suitability chosen
and make a
polygons function
required choice Erase
again removedtosuch
according area.polygons that lay inside of the impacted or endangered zone.
The result of the
The final stepcomplete analysisanalysis
of the complete can be seen
is tofor the complete
choose from those range of secured
potential placesarea
that(Figure
are inside9) and
the
then also in detail (Figure 10).
impacted and endangered zone. Only then this analysis gives the intervention commander the
Based on
information the detail
about review of
possibilities of the resulting analysis
deployment of DS and it is possible
then to identify
it is his/her that the
decision chosen
which placesareas
to
do not meet 100% of all original requirements
choose with regards to the whole situation in the secured space. due to the features of MCA itself but also due to the
qualityTheofmentioned
the source geographic data andtomethods
steps were applied the model of their reclassification.
example. If the model example
After the transformation of the was
cost
to apply in real life, it would be necessary to verify the results of the
map into a vector format required polygons were provided. However, in the subsequent analysis it analysis for the quality of used
DGD
turnedand outmethodology
that none of the of MCA.
areas During this verification
with a higher it is necessary
value of suitability for the to deployment
observe the influences
of DS—which of a
change
was 10—didin quality of thethe
not meet source DGD on the
requirements carriedits
regarding outdimensions.
analysis as That well as influences
is why of a changefor
the requirement in
weights of the individual criteria in the MCA itself and the used decision-making
suitability was decreased and it was searched for places that had the value of suitability 9–10. From rule or unifying
function.
these chosen The polygons
final verification
function of Erase
the suggested
removedprocedure,
such polygons however,that shall be realized
lay inside of thedirectly
impacted in the
or
real environment.
endangered zone. The result of the complete analysis can be seen for the complete range of secured
area (Figure 9) and then also in detail (Figure 10).You can also read