Mediterranean nascent sea spray organic aerosol and relationships with seawater biogeochemistry
←
→
Page content transcription
If your browser does not render page correctly, please read the page content below
Atmos. Chem. Phys., 21, 10625–10641, 2021
https://doi.org/10.5194/acp-21-10625-2021
© Author(s) 2021. This work is distributed under
the Creative Commons Attribution 4.0 License.

Mediterranean nascent sea spray organic aerosol
and relationships with seawater biogeochemistry
Evelyn Freney1 , Karine Sellegri1 , Alessia Nicosia1,a , Leah R. Williams2 , Matteo Rinaldi3 , Jonathan T. Trueblood1 ,
André S. H. Prévôt4 , Melilotus Thyssen5 , Gérald Grégori5 , Nils Haëntjens6 , Julie Dinasquet7,8,b ,
Ingrid Obernosterer8 , France Van Wambeke5 , Anja Engel9 , Birthe Zäncker9 , Karine Desboeufs10 , Eija Asmi11 ,
Hilkka Timonen11 , and Cécile Guieu12
1 Université Clermont Auvergne, CNRS, Laboratoire de Météorologie Physique (LaMP), 63000 Clermont-Ferrand, France
2 Aerodyne  Research, Inc., Billerica, Massachusetts, USA
3 National Research Council of Italy, Institute of Atmospheric Sciences and Climate (CNR-ISAC), Bologna, Italy
4 Laboratory of Atmospheric Chemistry, Paul Scherrer Institute, 5232 Villigen PSI, Switzerland
5 Aix-Marseille Université, Université de Toulon, CNRS, IRD, Mediterranean Institute of Oceanography,

UM110, 13288 Marseille, France
6 School of Marine Sciences, University of Maine, Orono, ME 04469, USA
7 Marine Biology Research Division, Scripps Institution of Oceanography, La Jolla, CA 92037, USA
8 CNRS, Sorbonne Université, Laboratoire d’Océanographie Microbienne, UMR7621, 66650 Banyuls-sur-Mer, France
9 GEOMAR, Helmholtz Centre for Ocean Research Kiel, 24105 Kiel, Germany
10 Université de Paris, Univ. Paris Est Créteil, CNRS, Laboratoire Interuniversitaire des Systèmes Atmosphériques, IPSL,

Paris, France
11 Atmospheric Composition Research, Finnish Meteorological Institute, Helsinki, 00101, Finland
12 Sorbonne Université, CNRS, Laboratoire d’Océanographie de Villefranche, LOV, 06230 Villefranche-sur-Mer, France
a now at: National Research Council of Italy, Institute of Atmospheric Sciences and Climate (CNR-ISAC), Bologna, Italy
b now at: Center for Aerosol Impacts on Chemistry of the Environment,

CASPO, Scripps Institution of Oceanography, UCSD, La Jolla, CA 92037, USA

Correspondence: Evelyn Freney (evelyn.freney@uca.fr)

Received: 25 April 2020 – Discussion started: 23 June 2020
Revised: 22 March 2021 – Accepted: 30 March 2021 – Published: 14 July 2021

Abstract. The organic mass fraction from sea spray              operating with 10 min time resolution and with filter-based
aerosol (SSA) is currently a subject of intense research.       chemical analysis on a daily basis. Using positive matrix fac-
The majority of this research is dedicated to measurements      torization analysis, the ToF-ACSM non-refractory organic
in ambient air. However a number of studies have recently       matter (OMNR ) was separated into four different organic
started to focus on nascent sea spray aerosol. This work        aerosol types, identified as primary OA (POANR ), oxidized
presents measurements collected during a 5-week cruise in       OA (OOANR ), methanesulfonic acid type OA (MSA-OANR ),
May and June 2017 in the central and western Mediterranean      and mixed OA (MOANR ). In parallel, surface seawater bio-
Sea, an oligotrophic marine region with low phytoplankton       geochemical properties were monitored providing informa-
biomass. Surface seawater was continuously pumped into          tion on phytoplankton cell abundance and seawater particu-
a bubble-bursting apparatus to generate nascent sea spray       late organic carbon (1 h time resolution) and seawater sur-
aerosol. Size distributions were measured with a differen-      face microlayer (SML) dissolved organic carbon (DOC) (on
tial mobility particle sizer (DMPS). Chemical characteriza-     a daily basis). Statistically robust correlations (for n > 500)
tion of the submicron aerosol was performed with a time-        were found between MOANR and nanophytoplankton cell
of-flight aerosol chemical speciation monitor (ToF-ACSM)        abundance, as well as between POANR , OOANR , and particu-

Published by Copernicus Publications on behalf of the European Geosciences Union.
10626                                                      E. Freney et al.: Mediterranean nascent sea spray organic aerosol

late organic carbon (POC). Parameterizations of the contribu-      latter type and are widely used instruments to monitor the
tions of different types of organics to the submicron nascent      chemical composition of submicron particulate matter in the
sea spray aerosol are proposed as a function of the seawater       atmosphere. The design of this instrument is optimized to in-
biogeochemical properties for use in models.                       vestigate the non-refractory fraction (defined as material that
                                                                   vaporizes at 600 ◦ C) of aerosol mass in the atmosphere. In the
                                                                   majority of atmospheric environments, the submicron frac-
                                                                   tion of the aerosol is dominated by non-refractory organic
1   Introduction                                                   and inorganic species. In marine environments, aerosol mass
                                                                   spectrometry has been used to better characterize the chem-
Oceans cover approximately 70 % of the Earth’s surface, and        ical properties of ambient marine aerosol particles, from the
sea spray emissions contribute up to 6 kt yr−1 of particulate      Atlantic (Ovadnevaite et al., 2011) to Antarctic coastal en-
matter, making them a major source of primary aerosol in           vironments (Schmale et al., 2013; Giordano et al., 2017).
the atmosphere (Lewis and Schwartz, 2004). The majority            Using a combination of high-resolution aerosol mass spec-
of the mass associated with sea spray emissions is in the          trometry and positive matrix factorization analysis, different
form of coarse-mode sea salt particles. However, it is now         marine organic aerosols have been identified including sec-
well known that the submicron fraction of marine emissions         ondary marine organic aerosols, organic aerosols containing
is also important and contains a significant portion of or-        methanesulfonic acid (MSA), and organic aerosols associ-
ganic compounds (Facchini et al., 2008). This organic frac-        ated with amino acid (AA). The latter were thought to be pri-
tion tends to be highest during phytoplankton bloom events         marily linked to local sea life emissions at the measurement
(O’Dowd et al., 2004). Although the organic fraction of the        site (Schmale et al., 2013).
aerosol population represents little mass, the high number            Most of these studies measured ambient aerosol already
concentration of these aerosol particles makes them a signif-      modified through atmospheric chemical and physical pro-
icant contributor to the potential cloud condensation nuclei       cesses. Current knowledge on the source and evolution of
concentration (Burrows et al., 2014). Organics in sea spray        nascent sea spray organic emissions is still limited. This is
have also been shown to contribute to potential marine ice         attributed to the natural variability of marine organic aerosol
nuclei (McCluskey et al., 2017). Understanding how the or-         and to the lack of high-temporal-resolution studies at the
ganic fraction of marine aerosol particles transfer to the at-     ocean–atmospheric interface. A limited number of studies
mosphere is essential to help identify the contribution of the     have focused directly on the composition of nascent sea spray
marine aerosols to the Earth’s radiative budget.                   aerosol particles emitted from wave action in controlled sim-
   In general, sea spray aerosol is generated through bubble       ulation chambers (Wang et al., 2015; Collins et al., 2016)
bursting after wave breaking at the ocean surface, a process       or through dedicated bubble-bursting experiments in ambi-
that has been described in early publications (Blanchard and       ent environments (Bates et al., 2012, 2020; Dall’Osto et al.,
Woodcock, 1980). Once bubbles burst, film and jet droplets         2019; Park et al., 2019). These studies in controlled envi-
are ejected into the atmosphere and dry to leave aerosol par-      ronments identified the presence of aliphatic-rich and amino-
ticles as residuals containing the different constituents of the   acid-rich organic aerosols related to different phases of phy-
bulk seawater and surface microlayer. The size distribution        toplankton blooms (Bates et al., 2012; Wang et al., 2015).
of this sea spray aerosol (SSA) extends from the fine par-         Dall’Osto et al. (2019) identified an amino acid contribu-
ticle range, with diameters < 100 nm, to the super-micron          tion in both nascent sea spray aerosol and ambient aerosols.
range (up to 3 µm). The super-micron range is known to be          Park et al. (2019) observed that sea salt aerosol production
mainly composed of refractory NaCl and different MgCO3             was positively correlated with organic compounds in the wa-
or (Mg)2 SO4 species, while the submicron fraction tends to        ter, notably dissolved organic carbon, marine microgels, and
be enriched with organic compounds (O’Dowd et al., 2004).          chlorophyll a (chl a). However, in all of these studies, sam-
   Traditionally, measurements in and around the marine            ples were collected at point intervals and were not able to
boundary layer were made using offline filter measurements         provide information on the evolution of aerosol physical and
followed by laboratory-based analysis using either ion chro-       chemical properties over a large spatial area. In addition to
matography or organic carbon and elemental carbon anal-            this, previous studies do not provide measurements of seawa-
ysis. However, over the last decade, there has been a sig-         ter composition, making it impossible to provide the quanti-
nificant increase in the number of studies deploying online        tative link between seawater biogeochemistry and the SSA
aerosol mass spectrometry methods, including laser ablation        organic composition.
mass spectrometry (Dall’Osto et al., 2019) and thermal va-            In this work, we characterized the chemical composi-
porization followed by electron impact ionization methods          tion of the nascent sea spray submicron aerosol contin-
(Giordano et al., 2017; Ovadnevaite et al., 2011; Schmale          uously generated from an underway seawater system on
et al., 2013). The aerosol mass spectrometer (AMS, Aero-           the R/V Pourquoi Pas? over a 5-week campaign in the
dyne Research, Inc.) and aerosol chemical speciation mon-          Mediterranean Sea. The Mediterranean Sea is a low-nutrient
itor (ACSM, Aerodyne Research, Inc.) are examples of the           low-chlorophyll (LNLC) environment and was characterized

Atmos. Chem. Phys., 21, 10625–10641, 2021                                          https://doi.org/10.5194/acp-21-10625-2021
E. Freney et al.: Mediterranean nascent sea spray organic aerosol 10627
by oligotrophic conditions along the whole field campaign orescence in the red (FLR > 652 nm) and orange (FLO 552–
(Guieu et al., 2020a). Understanding the formation of nascent 652 nm) ranges in the size range of 1 to 800 µm. Two trigger
sea spray aerosols in such an LNLC system can provide valu- levels were applied for the distinction between highly con-
able information and be extrapolated to other oligotrophic centrated picophytoplankton and cyanobacteria groups (trig-
environments. ger level FLR 7.34 mV, sampling at a speed of 4 mm3 s−1
and analyzing 0.65 ± 0.18 cm3 ) and less concentrated nano-
and microphytoplankton (trigger level FLR 14.87 mV, at a
2 Methodology speed of 8 mm3 s−1 and analyzing 3.57 ± 0.97 cm3 ). Differ-
ent sets of 2D projections were plotted in Cytoclus® soft-
2.1 The PEACETIME oceanographic campaign ware to manually gate phytoplankton groups. To follow sta-
bility of the flow cytometer, 2 µm red fluorescing polystyrene
The French research vessel, the R/V Pourquoi Pas?, was
beads (Polyscience) were regularly analyzed. The use of sil-
deployed for a 5-week-long period from 10 May to
ica beads (1, 2, 3, 5, and 7 µm in diameter, Bangs Laboratory)
10 June 2017 on the Mediterranean Sea, as part of the project
for size-retrieving estimates from FWS were used to separate
PEACETIME (ProcEss studies at the Air-sEa Interface after
picoplankton from nanoplankton clusters.
dust deposition in The Mediterranean sea). The ship track
(Fig. 1) started and ended in La Seyne-sur-Mer, France. The 2.2.2 Chlorophyll a and POC
ship traveled clockwise, covering latitudes in the Mediter-
ranean Sea from 35 to 42◦ and longitudes from 0 to 21◦ . From the underway seawater system, chl a was derived
Results from a suite of hydrology and biogeochemistry from the particulate absorption spectrum line height at
measurements performed on board are given in Guieu et 676 nm (Boss et al., 2013) after the relationship was
al. (2020a). In addition to standard seawater temperature (T ) adjusted to PEACETIME chl a derived from HPLC
and salinity (S) measurements, the concentrations of a wide (chl a = 194.41 × line_height1.131 ). POC was estimated from
range of chemical and microbiological parameters were particulate attenuation at 660 nm using an empirical relation-
monitored hourly. Several plankton functional groups were ship specific to PEACETIME (POC = 1405.1 × cp (660) −
identified, including Synechococcus, Prochlorococcus, na- 52.4), which was slightly higher than the literature value
noeukaryotes, coccolithophore-like plankton, cryptophyte- likely due to the small dynamic range (1.27 higher on aver-
like plankton, and microphytoplankton. The sea surface tem- age for the range observed; Cetinic et al., 2012). Particulate
perature (T ) showed a gradual increase from the start to the attenuation and absorption of surface water were measured
end of the campaign from 19 to 23 ◦ C. Sea surface salin- continuously with a WET Labs spectral absorption and at-
ity (S) varied from 36 to 39 PSU (practical salinity units), in- tenuation meter using a flow-through system similar to the
creasing from east to west. The sampling region was charac- setup described in Slade et al. (2010). Both the chl a and the
teristic of open sea (average depth 2750 m ± 770 m along the POC were obtained with a time resolution of 1 min.
transect). The sea was calm to moderately rough throughout
the sampling period, with conditions always remaining be- 2.3 Surface microlayer (SML) sampling and analysis
low Beaufort 4. Wind speed varied between 10 and 20 m s−1 .
Total chlorophyll a (chl a) and particulate organic car- 2.3.1 Sampling
bon (POC) were also measured. In line with the olig-
otrophic state of the Mediterranean Sea during this period, Surface microlayer SML sampling was conducted twice a
the POC concentrations were highest at the most northern day from a zodiac using a 50 cm × 26 cm silicate glass plate
latitudes and gradually decreased along the ship transect sampler (Harvey, 1966; Cunliffe and Wurl, 2014) with an ef-
(Fig. 1a), while the chl a concentration remained stable and fective sampling surface area of 2600 cm2 considering both
low (0.07 ± 0.013 mg m−3 ) throughout the sampling period sides. For sampling, the zodiac was positioned 0.5 nmi away
(Fig. 1b). from the research vessel and into the wind direction to avoid
contamination. The glass plate was immersed perpendicular
2.2 Surface seawater analysis to the sea surface and withdrawn at ∼ 17 cm s−1 . SML sam-
ples were removed from the plate using a Teflon wiper (Cun-
2.2.1 Flow cytometry liffe and Wurl, 2014) and collected in an acid-cleaned and
rinsed bottle. Prior to sampling, all equipment was cleaned
Phytoplankton cells were counted with 1 h time resolu- with acid (10 % HCl), rinsed in Milli-Q water, and copiously
tion using an automated Cytosense flow cytometer (Cyto- rinsed with seawater directly before samples were taken.
buoy, NL) connected to a continuous-clean-pumping under-
way seawater system, as described in Thyssen et al. (2010)
and Leroux et al. (2017). Particles were brought within a
laminar-flow-filtered seawater sheath fluid and detected with
forward scatter (FWS) and side scatter (SWS) as well as flu-
https://doi.org/10.5194/acp-21-10625-2021 Atmos. Chem. Phys., 21, 10625–10641, 202110628 E. Freney et al.: Mediterranean nascent sea spray organic aerosol
Figure 1. The ship track in the Mediterranean Sea during the PEACETIME expedition. The trajectory is colored by (a) POC and (b) chl a.
2.3.2 DOC analysis sizer (DMPS) coupled with a condensation particle counter
(CPC, model 3010, TSI), and an impactor (Dekati, PM1 ) for
The concentration of dissolved organic carbon (DOC) was collecting submicron particulate matter for offline ion chro-
determined in samples filtered online (Sartoban © 300; matography and chemical analysis. All three sampled from
0.2 µm filters). Subsamples of 10 mL (in duplicate) were the headspace above the seawater in the tank. A silica gel
transferred to pre-combusted glass ampoules and acidified dryer was connected to the output of the chamber, which
with H3 PO4 (final pH = 2). The sealed glass ampoules were was subsequently connected to a flow dispatcher having three
stored in the dark at room temperature until analysis. DOC outputs of equal length (< 50 cm), one to the ToF-ACSM,
measurements were performed on a Shimadzu TOC-V-CSH one to the DMPS, and one to the impactor. The aerosol rel-
(Benner and Strom, 1993). Prior to injection, DOC samples ative humidity was measured continuously and varied from
were exposed to CO2 -free air for 6 min to remove inorganic 20 % to 40 % (Fig. S1 in the Supplement). The total sampling
carbon. A 100 µL aliquot of sample was injected in tripli- line length after the sea spray generator was approximately
cate, and the analytical precision was ±2 %. Standards were 2 m with a sampling flow of 5 L min−1 giving a residence
prepared with acetanilide. Analysis of DOC was performed time of less than 30 s. A schematic of the sampling setup is
on both SML and the underlying seawater sampled from the shown in Fig. S2. Regular tests were performed to ensure
zodiac. that the system was airtight and free from external aerosol
influences.
2.4 Sea spray generation and analysis
2.4.2 Aerosol physical and chemical properties
2.4.1 General setup
The sea spray generator has been characterized and deployed Size distribution measurements
in a number of previous studies, and full details are re-
ported in Schwier et al. (2015). Briefly, it consists of a 10 L Particle size distribution and number concentration measure-
glass tank, fitted with a plunging jet system for the water. ments were obtained using the DMPS. Measurements were
A particle-free air-flushing system is placed perpendicular to provided approximately every 10 min for 25 different size
the water surface at a distance of 1 cm to send a constant air- bins ranging from 10 nm up to 500 nm. The size distribution
flow across the surface of the water to replicate the effects was relatively constant throughout the measurement period,
of wind on the surface (13 m s−l ). The sea spray generator giving a principal size mode at 110 nm and a second mode
was supplied with a continuous flow of seawater collected at at 300 nm. This size distribution is characteristic of the bub-
a depth of 5 m by an underway seawater circulating system bler seawater generation method (Schwier et al., 2015) and is
operated with a large peristaltic pump (Verder® VF40 with similar to that from other nascent seawater aerosol generators
EPDM hose). The wastewater was evacuated downstream of (Bates et al., 2012) and to that observed in the clean marine
the sampling location to avoid any contamination. boundary layer (Yoon et al., 2007). Although the size distri-
The aerosol instrumentation included a time-of-flight bution remained constant, the absolute number concentration
aerosol chemical speciation monitor (ToF-ACSM, Aerodyne varied by a factor of 3 over the sampling period. Details of
Research, Inc.), a custom-made differential mobility particle these changes in aerosol number concentration as well as the
Atmos. Chem. Phys., 21, 10625–10641, 2021 https://doi.org/10.5194/acp-21-10625-2021E. Freney et al.: Mediterranean nascent sea spray organic aerosol 10629
associated cloud condensation nuclei activity are detailed in this reason, we presented WIOC and OC data only for sam-
Sellegri et al. (2021). ples that have both quantifiable OC and WSOC.
The amount of inorganic carbon varies between 12 % and
Offline PM1 filter analysis 71 % of TC, and thus the acidification process for sea spray
is an important step to follow for OC measurements. Or-
In parallel to the online aerosol physical and chemical mea- ganic carbon was converted to organic mass using conver-
surements, the generated nascent sea spray aerosol particles sion factors of 1.4 for the conversion of WIOC to WIOM
were also sampled onto PM1 quartz filters in the impactor. and 1.8 for the conversion of WSOC and WSOM (Facchini
Aerosol samples were stored in airtight containers and were et al., 2008). Although filters were only collected on a daily
transported to the laboratory for analysis following the field basis, they provided valuable information on the refractory
campaign. In the laboratory, aerosol samples were extracted component of the aerosol population. In order to compare
in Milli-Q water by sonication (30 min) for analysis of the filter measurements with volume concentrations measured by
water-soluble components. Extracts were analyzed by ion the DMPS, filter volume concentrations were calculated from
chromatography for the quantification of the main inorganic the measured mass concentrations using a density value of
ions (Sandrini et al., 2016). An IonPac CS16 3 × 250 mm 1.2 g cm−3 for organic matter and a density of 2.165 g cm−3
Dionex separation column with gradient MSA elution and for the other remaining components, SO4 , chl, Na, and Cl as-
an IonPac AS11 2 × 250 mm Dionex separation column with suming a density for sea salt (Seinfeld and Pandis, 2016).
gradient KOH elution were deployed for cations and anions, These concentrations compared well with those from the
respectively. The contributions of the estimated ssSO4 (sea DMPS (Fig. S3).
salt SO4 ), ssK, ssMg, ssCa, and ssCl were calculated based
on the seawater theoretical ratio (Seinfeld and Pandis, 2016). ToF-ACSM
These ratios are 0.25 for SO4 , 0.06 for K, 0.12 for Mg,
and 0.04 for Ca. The remaining non-sea-salt (nss) fraction The ToF-ACSM is based on the same operating principles
of the inorganic aerosol was within the measurement error of as the aerosol mass spectrometer (Drewnick et al., 2009).
the instrument. The ToF-ACSM contains a critical orifice, a PM1 aerody-
The water-soluble organic carbon (WSOC) content of the namic lens to focus submicron particles into a narrow beam
extracts was quantified using a total organic carbon (TOC) that flows into a differentially pumped vacuum chamber, a
thermal combustion analyzer (Shimadzu TOC-5000A) (de- standard vaporizer heated to 600 ◦ C to vaporize particles, an
tection limit (DL) = 1.9 µgC/filter). Measurements of the to- electron-emitting tungsten filament (70 eV) to ionize the va-
tal carbon (TC) content were performed on a filter punch cut por, a compact time-of-flight mass analyzer (ETOF, Tofw-
before water extraction by a thermal combustion analyzer erk AG, Thun, Switzerland), and a discrete dynode detector
equipped with a furnace for solid samples (Analytik Jena, (Fröhlich et al., 2013). It does not have the ability to size
multi NC2100S; Rinaldi et al., 2007) (DL = 37.9 µgC/filter). aerosol particles but has the advantage of being more com-
For the organic carbon (OC) analysis, the punch was acid- pact and more robust for continuous observations than the
ified before analysis to remove inorganic carbon from TC AMS (Fröhlich et al., 2013). The ToF-ACSM alternates be-
and obtain OC. This process included positioning the punch tween sampling ambient air and sampling through a filter in
in the instrument sample container, covered with 40 µL of order to subtract the signal due to air.
H3 PO4 (20 % w/w) and left under oxygen flow, at room tem- During this experiment the ToF-ACSM was operated in
perature, for ca. 5 min to allow the volatilization of carbon- a 2 min filter and 8 min sample mode with a measure-
ates as carbon dioxide (CO2 ). The process was monitored ment every 10 min. The aerodynamic lens transmits parti-
online by nondispersive infrared (NDIR) spectroscopy CO2 cles between 70 and 700 nm, making the ACSM approx-
detector: when the CO2 level went back to baseline condi- imately a PM1 measurement. The non-refractory particle
tions, the vessel was placed into the furnace (950 ◦ C) for the material (NR-PM) is defined similarly as in DeCarlo et
OC analysis. al. (2006) as aerosol particles that are vaporized using the
The water-insoluble organic carbon (WIOC) is not mea- 600 ◦ C resistively heated vaporizer and detected during the
sured directly but is derived from the difference between instrument sampling interval. The relative ionization effi-
WSOC and OC. As mentioned, the measurements of OC ciency for NH4 was 3.12 and for SO4 was 0.8, determined
and WSOC are made with two different instruments with from calibrations with ammonium nitrate and sulfate. How-
that for WSOC having a much lower limit of detection (DL). ever, considering that the measured SO4 concentrations rep-
Although the quantification of WSOC was always possible, resent sea salt (ss) SO4 , we adjusted the relative ionization
some samples had OC concentrations < DL, assuming that efficiency (RIE) of SO4 to 0.3 so that the mass concentration
OC = WSOC (and WIOC = 0) would be incorrect and would of SO2−4 from the ACSM agrees with that of the filters during
result in significant error in the estimate of total OC. There the periods when filter and ACSM total mass concentrations
could be a significant amount of WIOC that we cannot quan- were in agreement (before 30 May; see Fig. S3).
tify because of the lower sensitivity of the OC analysis. For
https://doi.org/10.5194/acp-21-10625-2021 Atmos. Chem. Phys., 21, 10625–10641, 202110630 E. Freney et al.: Mediterranean nascent sea spray organic aerosol
The temperature of the vaporizer and the size range do not spectra. The ToF-ACSM gives unit mass resolution (UMR)
permit efficient detection of sea salt particles with the ToF- mass spectra, so it is not possible to distinguish between salt
ACSM. However, in situations of high sea salt concentra- and non-salt ions at a given m/z. A decision was made to re-
tions, detection of sea salt ions and related halides have been move all sea-salt-related ions from the organic mass spectral
reported (Bates et al., 2012; Giordano et al., 2017; Ovad- data matrix, giving a total of 116 m/z from 0 up to 150. We
nevaite et al., 2011; Schmale et al., 2013; Timonen et al., are aware that removing the m/z’s associated with NaCl (23,
2016). Likewise, in this study mass spectral signals associ- 35, 37, 58, 60, 81, and 83) will also remove contributions
ated with sea salt were observed. In addition, the contribution from organics at these m/z’s. However, the organic contribu-
from chloride was very high (72 % of the total mass). In some tions at these m/z values are small relative to the rest of the
quadrupole ACSM instruments, negative Cl peaks are some- organic MS and are typically a factor of 10 smaller than sea
times observed (Tobler et al., 2020) due to slow evaporation salt in the ACSM signal.
of refractory material from the vaporizer relative to the 30 s During sampling, the ToF-ACSM was run with a 2 min fil-
switching time between filter and sample. This tends to over- ter and 8 min sample cycle. When sampling with long times
estimate the filter measurement and underestimate the sam- between filters, any drift in sensitivity can result in a dif-
ple measurement and can lead to negative values for the dif- ference signal that is an artifact. This is especially true for
ference. However, during these measurements with the ToF- those signals with a high background (e.g., from air at m/z 29
ACSM, negative Cl was not observed likely because of the from 15 NN), and when measuring low concentrations of or-
long switching times. ganic mass (as is the case during this experiment). In PMF
The typical signature peaks for sea salt aerosol in our in- solutions including m/z 29, one of the factors contained pre-
strument were confirmed by atomizing pure aerosol particles dominantly m/z 29, and the time series was noisy and flat.
generated from sea salt solution (Biokar, synthetic sea salt, Down-weighting m/z 29 (by ×100) did not help distribute
lot: 0017475), passing the particles through a silica gel dryer the signal at m/z 29 into the other organic factors. There-
and into the ToF-ACSM instrument. In the default fragmen- fore, since m/z 29 was only contributing to noise and not
tation table used to assign the signals at individual m/z’s to to chemical information, we removed it. The PMF solutions
chemical species (Allan et al., 2004), peaks associated with were explored up to six factors, as a function of f-peak val-
sea salt were identified as organic aerosol fragments. In or- ues from −1 to +1 (Figs. S4 to S10). The four-factor solution
der to better represent the measured aerosol composition, we was chosen, based on correlations with reference mass spec-
modified the standard fragmentation table by introducing a tra. The correlations for the three- and five-factor solutions
sea salt species that includes m/z fragments at m/z 23 (Na+ ), are illustrated in the Supplement (Figs. S5, S6, S9, and S10).
m/z 35 and 37 (35 Cl− , 37 Cl− ), 58 and 60 (Na35 Cl, Na37 Cl), The four identified factors, as well as their mass spectral fin-
and 81 and 83 (NaCl2 , NaCl37 Cl). For m/z 81, there is over- gerprints and time series, will be discussed in the following
lap with an SO4 fragment, and a correction suggested by sections.
Schmale et al. (2013) was applied (Eq. 1). This correction
accounted for less than 10 % of the signal at m/z 81 and 3 %
of the total sulfate signal. 3 Results and discussions
frag_SO4 [81] = 81 − frag_organic[81] − 0.036 × frag_Na[23] (1)
3.1 Time evolution of the chemical composition of
Quantification of sea salt is difficult in the ToF-ACSM as a nascent sea spray
result of inefficient vaporization and a nonlinear contribution
to the Na+ signal from surface ionization on the vaporizer. Mass concentrations of aerosol chemical composition ob-
Therefore, in this work we do not attempt to quantify the sea tained from the submicron offline filter measurements are
salt fraction, but instead we use the mass spectral information listed in Table 1. The soluble inorganic species concentra-
to separate it from the organic aerosols. A standard collection tions were mostly found with proportions similar to the ref-
efficiency (CE) of 0.5 was applied to all data obtained from erence average seawater composition (Seinfeld and Pandis,
the ACSM (Middlebrook et al., 2012). Regular particle-free 2016). However, enrichment in K+ (69 % of which was not
sampling periods were performed to ensure that there was no explained by the average seawater composition) and a slight
buildup of material on the vaporizer and that the sampling enrichment of Ca2+ were measured toward the end of the
setup was leak-free. campaign (17 % of Ca2+ was not explained by reference
seawater composition from 28 May onward). In contrast,
Positive matrix factorization (PMF) the magnesium was slightly depleted (20 % less than ex-
pected in reference seawater composition) but less towards
In order to identify the different organic aerosols present in the end of the campaign. Filter-based organic matter (OM)
the sea spray from primary seawater, unconstrained positive was evenly split between WIOM (9 % ± 0.5 % of total mass)
matrix factorization, using the SoFi interface (Canonaco et and WSOM (6 % ± 6 % of total mass), which contrasts with
al., 2013), was performed on the ToF-ACSM organic mass previous studies where organic matter in ambient marine
Atmos. Chem. Phys., 21, 10625–10641, 2021 https://doi.org/10.5194/acp-21-10625-2021E. Freney et al.: Mediterranean nascent sea spray organic aerosol 10631
Figure 2. Time series of the fractional contribution of different species to the ToF-ACSM signal, as well as the total mass concentrations
measured by the ACSM (black), and the missing fraction relative to the DMPS measurement (FRefrac) in grey.
Table 1. Concentrations of different chemical species in PM1 pri- of the mass and were not included in the volume calculation.
mary seawater aerosols measured using offline analysis of filters The ACSM volume concentration was compared to the vol-
and online measurements from the ACSM. The cited uncertainty ume concentration measured by the DMPS, giving a correla-
represents 1σ . tion (r) of 0.49 and slope (b) of 1.21 (Fig. 3). The variation in
the total sea spray mass concentration with time is a result of
Offline analysis of filters % Non-refractory PM1 %
the variability in the number of sea spray particles generated
(µg m−3 ) (ACSM) (µg m−3 )
from the sea spray generation device. The size distribution of
ssSO2−
4 1.22 ± 0.48 5.3 % SO4 0.78 ± 0.34 9.5 % the aerosol remained stable throughout the experiment, but
Sea salt− 17.54 ± 7.1 76.4 % NO3 0.02 ± 0.02 0.2 % the sea spray number emission flux is influenced by the vari-
ssCa2+
− 0.18 ± 0.07 0.8 % NH4 0.04 ± 0.11 0.5 % ability in seawater biogeochemical properties. This is pre-
ssK+ 0.03 ± 0.01 0.13 % Sea salt 6.7 ± 5 82 %
Mg+ 0.59 ± 0.23 2.6 % Org 0.67 ± 0.26 8.2 %
sented and discussed in detail in a companion paper (Selle-
WIOM 2.02 ± 0.12 8.77 % gri et al., 2021), where we show a clear relationship between
WSOM 1.39 ± 1.3 6.06 % the sea spray number concentrations generated in the bubble-
bursting system and the nanophytoplankton concentration of
the seawater, not only in the PEACETIME experiment but
aerosol was almost exclusively composed of WIOM (Fac- also in other seawater types.
chini et al., 2008). However, these previous studies were con- The agreement between the two instruments is relatively
ducted during phytoplankton bloom events of the North At- good in the first part of the campaign, but the difference
lantic Ocean, where POC is usually enhanced. Considering between the ACSM-derived volume and the DMPS-derived
that the Mediterranean Sea is characterized by oligotrophic volume increases during the later parts of the campaign from
conditions during PEACETIME, it could explain the rela- 1 to 10 June (Fig. 3). We ruled out the possibility that the
tively low contributions of WIOM. high fraction of inorganics in the SSA led to an accumu-
The chemical composition of SSA measured by the ACSM lation of refractory or semi-refractory material on the va-
is shown in Fig. 2 and listed in Table 1 and was primarily porizer and a corresponding decrease in the ability to mea-
composed of sea salt aerosol (determined from the signals at sure non-refractory material by examining the background
m/z 23 (Na+ ), m/z 35 and 37 (35 Cl− , 37 Cl− ), m/z 58 and (filter) signals. Figure S11 shows the background signal at
60 (Na35 Cl, Na37 Cl), and m/z 81 and 83 (NaCl2 , NaCl37 Cl), m/z 58 (NaCl+ ) as a function of time; this signal varies as a
representing 82 % ± 61 %), followed by SO4 at 9.5 % and or- function of total mass loading but does not progressively in-
ganic matter at 8.2 %. The variability in the different chemi- crease over time. Similarly, particle-free sampling periods at
cal compositions throughout the sampling is thought to be a the start and the end of the field campaign show that m/z 58
result of the differing associated contributions of refractory background levels dropped to comparably low values. There-
compounds (Ca2+ , Mg+ , K+ , etc.) in the sea salt sample. fore, we conclude that overloading of the ACSM by refrac-
In order to determine how representative the ACSM PM1 tory, or semi-refractory slowly vaporizing, material did not
measurements were of the total PM1 mass, the total ACSM occur, and the missing mass is due to increased refractory
PM1 mass concentration was converted into volume concen- content. The fraction of missing mass, FRefrac, is estimated
tration (dividing organic mass concentrations by a density as the difference between the DMPS volume and ACSM vol-
value of 1.2 g cm−3 , and the other remaining components ume divided by the DMPS volume and is shown as the grey
SO4 , Cl, and NaCl by 2.165 g cm−3 (Seinfeld and Pandis, area in Fig. 2. The latter period of the field campaign corre-
2016). Contributions from NO3 and NH4 were less than 1 % sponds to a change in seawater type with more inputs from
https://doi.org/10.5194/acp-21-10625-2021 Atmos. Chem. Phys., 21, 10625–10641, 202110632 E. Freney et al.: Mediterranean nascent sea spray organic aerosol
Figure 3. Comparison between the ACSM and the DMPS volume concentration (cm−3 , m−3 ).
the Atlantic Ocean and a corresponding decrease in practi- with reference mass spectra are illustrated in Fig. S8. The
cal seawater salinity (Fig. S13). It is possible that during this OOANR contributed 51 % ± 2 % to OA and had signature
sampling period, the seawater contains higher fractions of peaks with high m/z 44 and m/z 28 and correlated with
refractory material that are less efficiently measured by the an OOA reference mass spectrum (r = 0.98). It did not con-
ACSM. An additional means to estimate the missing mass is tain any other m/z values that might suggest a contribution
to subtract the total ACSM mass loading from the total mass from other species. The O/C ratio of the OOANR fraction
measured on the filters. Comparing this estimation of missing was 1.6 (calculated using the method described in Cana-
mass to the different species measured on the filters shows garatna et al., 2015), which is significantly higher than the
the best correlations with Mg2+ , Ca2+ , and SO2− 4 (Fig. S14). average O/C ratio of LV-OOA found in terrestrial ambi-
This might suggest that the ability of the ACSM to measure ent aerosols (0.8) (Canagaratna et al., 2015). High O/C ra-
NaCl particles depends on how NaCl is associated with other tios have been reported in ambient studies where carbonate
compounds in the sea spray. species were thought to be measured by the ACSM (Bozzetti
The PM1 mass concentrations of WSOM and WIOM cal- et al., 2017; Vlachou et al., 2019) and additionally have been
culated from the filters were additionally compared with the associated with aerosols subjected to aqueous phase process-
total OM measured from the ACSM (OMACSM ) (Fig. S14). ing (Canagaratna et al., 2015). It is also possible that the PMF
The OMACSM represented on average 27 % of the total fil- analysis wrongly attributed excess m/z 44 to OOA at the ex-
ter OM. In the following section, we analyze in more detail pense of other species such as the MSA-OANR discussed be-
the different organic aerosol species present in the SSA sam- low. This would impact the reported absolute concentrations
ples and determine to what extent they are related to seawater of the OOANR vs. the MSA-OANR .
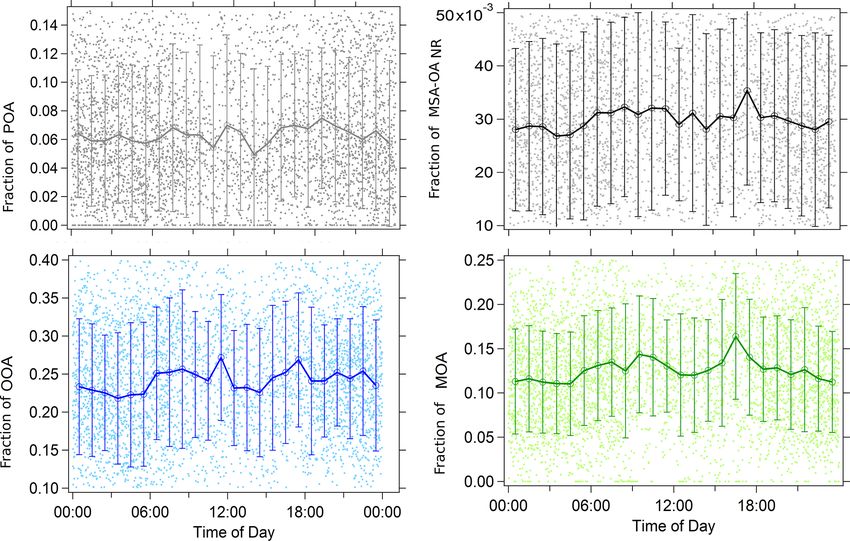
biogeochemical properties. The second most dominant species was defined as a mixed
organic aerosol (MOANR ). This factor contributed to 15 %
3.2 Marine organic aerosol speciation of the total OANR at the start of the campaign and then in-
creased to 28 % and 35 % later on in the campaign (Fig. 4a).
As explained in Sect. 2 (Methodology), PMF was used to This MOANR factor contained several mass peaks associated
separate organic factors. Based on the correlations with ref- with amino acids (AAs) reported in reference mass spec-
erence mass spectra and on observations of the temporal tral signatures of leucine and valine (Schneider et al., 2011).
variations, we chose a four-factor solution. These factors AA signature peaks were identified at m/z 41, 70, 98, 112,
include an oxidized organic aerosol (OOANR ), similar to 115, 117, 119, and 131 and were similar to signature peaks
ambient reference OOA (Ng et al., 2010), somewhat oxi- that had been identified in previous studies by Schmale et
dized OA containing mixed amino acid and fatty acid sig- al. (2013) in ambient marine aerosols and by Schneider et
natures (mixed OA, MOANR ), primary organics containing al. (2011) during a series of laboratory studies on differ-
aliphatic signature peaks as well as several peaks correspond- ent AAs. Similar marker m/z’s were present for fatty acid
ing to fatty acids signatures (POANR ), and a methanesulfonic species such as palmitic and oleic acid (Alfarra et al., 2004).
acid-like OA (MSA-OANR ) (Phinney et al., 2006). The av- The MOANR factor had an O/C of 0.53 and an H/C of 1.39,
erage composition for two distinct time periods, the mass hence much less oxidized than the OOANR type. These val-
concentrations as a function of time, and the mass spec- ues are intermediate between those often calculated for low-
tra are shown in Fig. 4. The fractional contribution of each volatility and semi-volatility OOANR in the ambient atmo-
factor to the total mass as a function of time is shown in sphere (Canagaratna et al., 2015) and are similar to those
Fig. S7. The correlations of each of the identified factors
Atmos. Chem. Phys., 21, 10625–10641, 2021 https://doi.org/10.5194/acp-21-10625-2021E. Freney et al.: Mediterranean nascent sea spray organic aerosol 10633
the H/C ratio (1.64), was similar to the aliphatic-rich organic
aerosol species measured in contained wave chamber exper-
iments during a phytoplankton bloom (Wang et al., 2015).
Once the bloom passed the H/C of these aerosol particles
decreased, and it was hypothesized that the primary organ-
ics were transformed through microbial activity in the water.
During the PEACETIME campaign, the POANR factor had
higher concentrations at the start of the field campaign and
then later decreased. This decrease in POANR was accompa-
nied by an increase in the more oxidized MOANR (Fig. 4b).
The last factor, MSA-OANR ; contributed 6 % ± 1 %, con-
tained typical signature peaks at m/z 65, 79, and 96; and
correlated with reference mass spectra of MSA (r = 0.34)
(Fig. S8). This mass spectrum is similar to that identified by
Timonen et al. (2016) in Antarctica. However, unlike previ-
ously measured ambient MSA-like species (Schmale et al.,
2013), it contained little or no oxygenated peaks at lower
masses (m/z 43, 44, 45), making it impossible to calculate
an O/C ratio. As mentioned above, it is possible that, given
the low temporal variability, the m/z 44 was incorrectly at-
tributed by the PMF analysis, resulting in an excess m/z 44
in OOA and missing m/z 44 in MSA-OANR . The H/C ra-
tio of 1.12 was similar to 1.2 measured by Ovadnevaite et
al. (2011) but lower than the reported 1.6 by Schmale et
al. (2013) for MSA-OANR , both detected in ambient aerosol.
The presence of an MSA-OA in nascent sea spray gener-
ated in the present study suggests that this compound is al-
ready present in the seawater and not only produced from
gas-phase DMS emissions and oxidation in the atmosphere.
The Mediterranean Sea experiences a high level of radiation
(MerMex Group, 2011) and could also explain the presence
of MSA-like compounds from DMS oxidation within the
seawater. Precursor species of MSA exist in seawater, such
Figure 4. (a) The contribution of the different organic factors during
different periods of the PEACETIME ship campaign (identified by as dimethylsulfoniopropionate; however, the available refer-
the grey bars at the top of b). (b) The mass concentrations of each ence mass spectra of this compound (determined using liquid
factor (OOANR , MOANR , POANR , and MSA OANR ) as a function chromatography MS) contain m/z values at 63, 73, and 135,
of time. (c) The mass spectra of the factors. none of which are visible in our organic spectra (Swan et
al., 2017; Spielmeyer and Pohnert, 2010). Therefore, we be-
lieve that the MSA-OANR species measured in these seawa-
identified by Schmale et al. (2013) for an amino-acid-type ter samples resembles MSA more than one of its precursor
aerosol (O/C 0.35 and H/C 1.65) detected in an ambient ma- species.
rine aerosol. AAs containing OA have been measured at a number of
The third most prominent factor was identified as a pri- coastal sites, and their formation in the ambient atmosphere
mary organic aerosol (POANR ) and contributed 26 % to the is similar to that of MSA, where the AAs are formed from
total organics at the start of the campaign, decreasing to 9 % the gas-phase partitioning of amines such as trimethylamine
near the end of the campaign (Fig. 4a). This factor con- or dimethylamine into the particulate phase (Facchini et al.,
tained typical aliphatic signatures and had little contribution 2008). These AA OA signatures were detected during mea-
from m/z 44. The mass spectral signature of the POANR fac- surements made on the east coast of America, in the Arc-
tor correlated well with reference mass spectra of leucine tic (Dall’Osto et al., 2019), and also during controlled wave
(r = 0.56) and valine (r = 0.51) but also with fatty acid mass and bubble-bursting chamber experiments (Dall’Osto et al.,
spectra of oleic (r = 0.69), palmitic acid (r = 0.74), and hy- 2019; Decesari et al., 2019; Kuznetsova et al., 2005; Wang et
drocarbon organic aerosol (HOA) (r = 0.78). The O/C ratio al., 2015).
of this POANR was 0.1 and the H/C was 1.64, which is typi- In our experimental setup, the short time between particle
cal for values of primary organic aerosol in the ambient atmo- generation and analysis (less than 30 s) does not allow for the
sphere. The POANR factor identified in this work, as well as formation of secondary aerosol through oxidation and parti-
https://doi.org/10.5194/acp-21-10625-2021 Atmos. Chem. Phys., 21, 10625–10641, 202110634 E. Freney et al.: Mediterranean nascent sea spray organic aerosol
Figure 5. Diurnal variation in the four PMF organic factors chosen to represent the measured non-refractory organic aerosol: average (circles)
and standard deviation (vertical bars) of the measurements by hour during the whole PEACETIME cruise. The underlying raw data are shown
with small dots.
tioning of gas-phase species into the particle phase. Since important to identify other marker species or processes that
these amino acid signatures are internally mixed with signa- can be used to correctly link seawater chemical composition,
tures for several different species, we assume that they are biological activity, and the organic fraction in the seawater
present in the organic matter of the seawater, similar to con- aerosol that can represent up to 15 % of the total submicron
clusions made by Dall’Osto et al. (2019). sea spray mass in oligotrophic waters.
Although very weak and within the measurement error, In a companion paper, we illustrate that the total number
OOANR , MSA-OANR , and MOANR factors had a similar di- of sea spray particles measured by the DMPS was corre-
urnal variation with increases during the early hours of the lated to the nanophytoplankton cell abundance (NanoPhyto)
morning and again in the afternoon (Fig. 5). POANR showed (r = 0.33, n = 501, p < 0.001) (Sellegri et al., 2021). The
similar variation to the other species in the morning but a hypothesis behind the dependence of the sea spray number
second increase was not observed in the afternoon. A lack concentration on NanoPhyto is that organic matter released
of strong diurnal variation in MSA-OANR and OOANR indi- by NanoPhyto influences the surface seawater (SSW) surface
cates that the secondary (oxygenated) nature of these com- tension and therefore the bubble lifetime that drives the num-
pounds might be a result of biological processing rather than ber of film drops ejected to the atmosphere.
photochemical processes.
3.3.1 High-time-resolution correlations
3.3 The sources and formation pathways of marine
organic aerosol species In this section we will investigate the dependence of each of
the organic classes identified in sea spray on the SSW bio-
In several large-scale climate models chl a is used as a geochemical properties. The relationships of the total factor
proxy of phytoplankton biomass to predict the organic frac- mass concentrations and the fractional factor contributions to
tion of sea spray. In this study, the measured chl a in the the seawater biochemistry were investigated (Fig. 6).
underway surface seawater was low and had little variability MOANR was strongly linked to NanoPhyto (r = 0.34),
(0.07±0.013 mg m−3 ), therefore making it difficult to extract as was MSA-OANR and OOANR but with less significance
any significant relationship between our measured organic (r = 0.25). Therefore, these organic classes follow the to-
mass fractions and the measured chl a. No significant cor- tal sea spray mass and number behavior, as illustrated in
relations were observed between the mass concentrations of Sellegri et al. (2021). The hypothesis of organic matter
the OM (measured by either the ACSM (OMACSM ) or on fil- influencing the surface tension of seawater, bubble life-
ters (OMfilter = WIOM + WSOM) and chl a concentrations, time, and the number of film drops is therefore linked to
or between the fraction of these two organic classes to the this specific class of organic matter. Fatty acids, consistent
total sea spray mass and chl a (not shown). Therefore it is with the MOANR and OOANR spectra, have been reported
Atmos. Chem. Phys., 21, 10625–10641, 2021 https://doi.org/10.5194/acp-21-10625-2021E. Freney et al.: Mediterranean nascent sea spray organic aerosol 10635
Figure 6. Pearson correlation coefficients for the four different organic factors (MOANR , POANR , OOANR , and MSA-OANR ) and their frac-
tion of the total sea spray mass (fMOA, fPOA, fOOA, and fOA) with several phytoplankton functional group abundances (cells per cubic cen-
timeter) (Synechococcus, picoeukaryotes, nanoeukaryotes (Nano-phyto), coccolithophore (coccolith), cryptophytes), total chl a (mg m−3 ),
and POC (mg m−3 ) in the sampled seawater during the whole campaign. Sample number = 461. Correlations with absolute R values < 0.16
had Pearson’s two-tailed significance values lower than 0.001 and were therefore left blank.
to be enriched in the SML (Cunliffe et al., 2013), which small cells and the larger ones that rather drive the POC con-
would explain their impact on the bubble-bursting process. tent.
POANR species are instead significantly correlated with par- Except for MOANR , all correlations for the absolute mass
ticulate organic carbon concentrations, POC (r = 0.40), and of these different types of organic matter are also observed
Coccolithophore-like abundance (r = 0.38). A relationship when the fractional contribution of these species to the total
between Coccolithophore-like cell abundance and [POC] is mass of SSA (determined from the DMPS) are considered,
likely linked to the ability of the coccolithophores or similar although less significantly (lower part of Fig. 6). However,
groups of phytoplankton to secrete large amounts of sticky for MOANR species, correlations with NanoPhyto no longer
carbon which can result in the formation of gels and POC hold if the fractional contribution of these species to the total
(Engel et al., 2004). As the time variation in POANR does not mass of sea spray is considered. Instead, fMOA is correlated
follow that of total sea spray mass, it is possible that POA is to picoeukaryotes and Synechococcus. This is likely due to
not linked to film drop formation and is ejected into the at- the strong anticorrelation of the fraction of all other organic
mosphere via a separate mechanism, such as jet drops. It was classes with these classes of small phytoplankton. At low
recently shown by Wang et al. (2017) that jet drops can con- picoeukaryotes and Synechococcus cell abundances, fPOA,
tribute significantly to the population of submicron SSA (up fOOA, and fMSA-OA are higher, artificially decreasing the
to 43 %). The jet-drop-originating SSA has a different chem- proportion of fMOA to the rest of the organic matter.
ical composition than the film-drop-originating SSA and is
more influenced by the SML (Wang et al., 2017). The hy- 3.3.2 Filter-based resolution correlations
pothesis of POANR being linked to jet drops is supported by
its relationship to POC in SSW. Since the non-refractory organic components analyzed us-
The time series of OOANR had positive relationships with ing the ACSM technique are only a fraction of the marine
NanoPhyto (r = 0.25), but also with coccolithophore-like organic mass, we investigate the relationships between off-
cell abundances (r = 0.25) and POC (r = 0.21), and hence line filter-based organic compounds and seawater biogeo-
OOANR seem to have an intermediate behavior between chemical properties. Filter-based organic fractions are also
POANR and MOANR . All organic classes except MOANR compared to seawater properties at the filter sampling time
are anticorrelated to the classes of small phytoplankton (pi- resolution. The organic mass concentration from filters is
coeukaryotes and Synechococcus). This anticorrelation could correlated to the coccolithophore cell abundance (r = 0.88,
be the result of the competition for nutrients between these n = 13). The fraction of OM to total mass analyzed on fil-
ters (OMSS) was also correlated to coccolithophore cell
abundance (r = 0.72, n = 13) and POC (r = 0.6, n = 13).
https://doi.org/10.5194/acp-21-10625-2021 Atmos. Chem. Phys., 21, 10625–10641, 202110636 E. Freney et al.: Mediterranean nascent sea spray organic aerosol
Figure 7. Time series of the DOC enrichment factor (EF), POC concentrations, and PMF organic factors MOANR and POANR .
This indicates that the total organic matter present in sea 3.3.3 Predicting organic matter in sea spray from
spray behaved similarly to the non-refractory POANR and seawater biogeochemical properties
OOANR analyzed by the ACSM. Previous studies observed a
connection between seawater POC and SSA organic fraction. By combining relationships between filter-based chemical
Facchini et al. (2008) found that WIOM in SSA was related analysis, ACSM organic source apportionment, and seawater
to seawater POC derived from microgels. Furthermore, dur- properties, it is possible to propose a general relationship that
ing mesocosm bubbling experiments using Emiliania huxleyi can be used to predict the different fractions of organic matter
cultures and low heterotrophic prokaryote abundance counts, in the nascent sea spray emitted from oligotrophic seawaters.
O’Dowd et al. (2015) suggested that the aggregation of dis- These different organic fractions may have different atmo-
solved organic carbon (DOC) into POC in the form of insol- spheric properties related to their climate impact, such as ice
uble gel colloids was the driving force behind the enrichment nuclei properties (Trueblood et al., 2021). We chose to pa-
of organic matter into submicron SSA. The authors hypoth- rameterize the organic fractions of sea spray rather than com-
esized that the organic fraction of SSA can be controlled ei- puting organic mass fluxes, for an easier implementation in
ther by DOC or POC, depending on the biological state of models that already have an inorganic sea spray source func-
the waters. tion. However, as shown in the preceding section, the total
Measurements of DOC in the SML and underlying seawa- mass of sea spray is significantly influenced by SSW biology,
ter were performed daily, as well as surface seawater bacte- and we recommend that the biology-dependent sea spray
rial total counts from daily surface water samples (5 m depth) number flux modulation computed in Sellegri et al. (2021) is
(the description of these methods is provided in Sect. S2). applied before biology-dependent organic fractions are cal-
DOC was slightly enriched in the SML compared to the culated.
underlying seawater, with enrichment factors varying be- We initially examined the relationship with offline filter or-
tween 1 and 1.2 (Fig. 7). The filter-based total organic con- ganic measurements of water-insoluble and water-soluble or-
tent of sea spray aerosol was not correlated to DOC or total ganic matter fractions (FWIOM and FWSOM, respectively)
bacterial count in the SML and neither was OMSS. How- with POC (Eqs. 2 and 3). These showed positive correlations
ever we observe that MOANR was correlated to the enrich- of both WIOM and WSOM with POC measurements.
ment of DOC in the SML (r = 0.55, n = 9), suggesting again
FWSOM =0.002[POC] − 0.0393r = 0.55, n = 19,
that MOANR is likely linked to organic matter present in
the SML. The correlation between MOA and DOC enrich- p < 0.01 (2)
ment in the SML suggests that the fraction of DOC which FWIOM =0.002[POC] + 0.031r = 0.54, n = 12,
is enriched in the SML contains lipids and amino acids
p < 0.05 (3)
found in the MOANR fraction. Although MOANR is an oxi-
dized organic class, it does not seem to be the result of the Using the higher-time-resolution data obtained from the
bacterial production (BP) of organic matter in the seawa- ACSM, the non-refractory organic fraction of nascent sea
ter. Instead, we found a significant anticorrelation between spray can also be predicted using three different equations,
MOANR and bacterial production (r = −0.82, n = 10), indi- with MSA-OANR being a negligible fraction of the total sea
cating that MOANR could instead be consumed by this pro- spray mass:
cess.
Atmos. Chem. Phys., 21, 10625–10641, 2021 https://doi.org/10.5194/acp-21-10625-2021E. Freney et al.: Mediterranean nascent sea spray organic aerosol 10637
Figure 8. Time series and correlation plots of each of the parameterizations (Eqs. 4 to 6) for the determination of the different organic
fractions in nascent SSA.
4 Conclusions
fPOA =0.0002[POC] − 0.001
r = 0.31, n = 459, p < 0.001 (4) The primary objective of this experiment was to study the re-
fOOA =0.0002[POC] + 0.02 lationships between sea spray chemical properties and those
of seawater. This work presents a unique dataset, which de-
r = 0.20, n = 478, p < 0.001 (5)
scribes the first deployment of a ToF-ACSM to character-
−6
fMOA =4.5 × 10 × (picoeukaryotes) + 0.009 ize, in a continuous way, the organic fraction present in sea
r = 0.37, n = 459, p < 0.001. (6) spray aerosol generated from Mediterranean surface seawa-
ter. The non-refractory part of the organic content of sea
These relationships apply to the ranges of POC and pi- spray was characterized by low concentrations and low vari-
coeukaryotes measured during the PEACETIME cruise. ability along a 4300 km transect. Yet, using a positive ma-
Hence they may be applicable to other oligotrophic waters. If trix factorization on the ACSM organic mass spectra, it
larger ranges of seawater biogeochemical properties are con- was possible to extract signatures for fatty acids, amino
sidered in the future, fractions of organic classes should be acids, and marine primary organic aerosols in non-refractory
parameterized as logarithmic laws asymptotic to 1, in order nascent sea spray. We identified four organic classes: two
to take into account the saturation of the organic fraction at were composed of mixtures of amino acids and fatty acids
1 for the largest POC values. (a primary aerosol POANR and a slightly oxidized MOANR
Figure 8 shows the reconstruction of these organic factors factor), and two were identified as more oxidized organic
using the parameterizations determined in Eqs. (4) to (6). aerosol (OOANR and MSA-OANR ). The POANR factor was
The parameterizations correctly represent the absolute con- similar to that observed in wave chamber experiments and
centrations. However, the short-term variability is less well correlated well with POC concentrations in the seawater, as
represented, with correlations varying from 0.20 to 0.37. For did the OOANR and MSA-OANR . The MOANR concentra-
this sample size (n > 450) the significance of this correla- tions had a different behavior and correlated well with the
tion is < 0.001. These relatively low correlations suggest that nanophytoplankton cell abundance in the seawater, and also
there are parameters other than POC influencing the emission with the total sea spray number concentration and DOC en-
of these organic species, especially for OOA that is believed richment in the surface microlayer. It is hypothesized that
to be more linked to the SML properties than to the bulk sea- MOANR is related to surface tension properties that influence
water. However, these parameterizations are useful to pro- the bubble-bursting process and the resulting number of film
vide a first approximation of the organic matter exported to drops ejected to the atmosphere. In contrast, the fraction of
the SSA and in this type of environment (LNLC) are a better POANR , OOANR , and MSA-OANR classes is not connected
choice than using chl a. to the sea spray number concentration but is linked to POC of
https://doi.org/10.5194/acp-21-10625-2021 Atmos. Chem. Phys., 21, 10625–10641, 2021You can also read