MEDICAID EXPANSION IN WYOMING - ENROLLMENT AND COST PROJECTIONS - Wyoming Department of Health
←
→
Page content transcription
If your browser does not render page correctly, please read the page content below
MEDICAID EXPANSION IN
     WYOMING
 ENROLLMENT AND COST PROJECTIONS

       Wyoming Department of Health
             February 1, 2021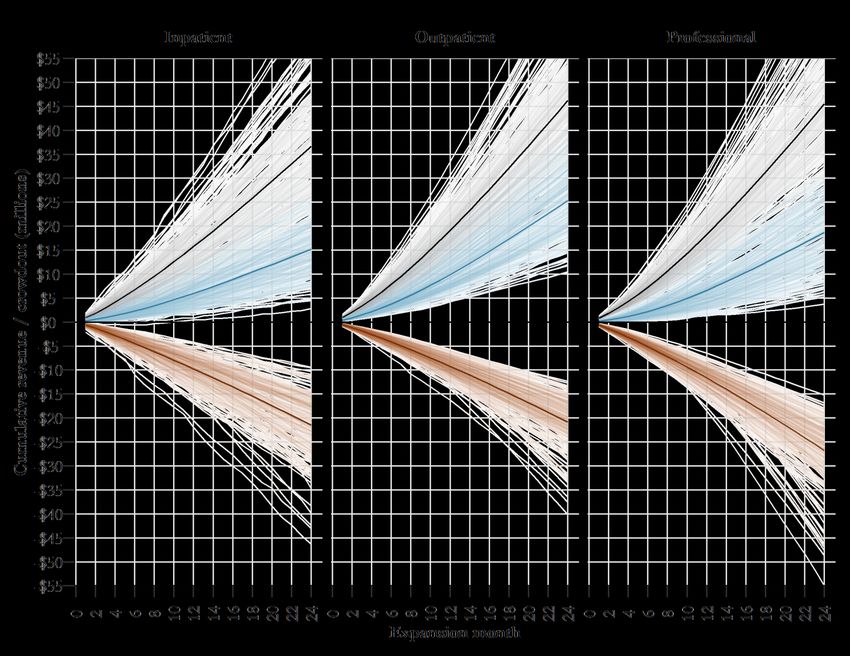
TABLE OF CONTENTS
Background - Traditional Medicaid...................................................................................... 2
Background - Medicaid Expansion ...................................................................................... 7
Executive Summary................................................................................................................ 9
Motivation ............................................................................................................................. 10
Enrollment And Costs ......................................................................................................... 13
Enrollee Profile ..................................................................................................................... 18
Effects On Members............................................................................................................ 21
Effects On Providers ........................................................................................................... 23
Effects On Private Insurance.............................................................................................. 26
Effects On State Finances ................................................................................................... 29
Methodology ......................................................................................................................... 30
Models.................................................................................................................................... 34

        Wyoming Department of Health | Director’s Unit for Policy, Research, and Evaluation | February 2021 | Page 1
BACKGROUND - TRADITIONAL MEDICAID
These two background sections provide a high-level overview of the overall Wyoming Medicaid
program before describing the specific circumstances around Medicaid Expansion.
What is Medicaid?
Medicaid is a joint Federal-State social insurance program that pays for the medical care and
long-term care of low-income and medically-needy individuals and families. Table 1, below,
illustrates the range of services that Medicaid pays for.
Table 1: General overview of Medicaid services (not inclusive)
Service type Examples
Physician and other provider office visits
Outpatient and inpatient hospital services
Medical care
Prescription drugs
Mental health and substance abuse treatment
Extended Dental
medical Vision
benefits
Facility-based / institutional services
o Nursing homes
Long-term o Wyoming Life Resource Center
care In-home services (“Home and Community-based
Waivers”) for people with physical or
intellectual/developmental disabilities.
Non-emergency transportation
Screenings and treatment referrals
Other
Cost-sharing for Medicare medical services for
certain members.
Medicaid eligibility is limited
While most people on Wyoming Medicaid are low-income, this fact does not automatically qualify
them for coverage; people must fall into certain categories based on age or physical health status.
These categories include, but are not limited to, those in Table 2 on the next page, which breaks
down average monthly enrollment in SFY 2020 for the largest eligibility categories.
Wyoming Department of Health | Director’s Unit for Policy, Research, and Evaluation | February 2021 | Page 2
Table 2: SFY 2020 largest Medicaid eligibility categories by enrollment (~93% of total enrollment)

                Eligibility category                                               Average enrollment
                Low-income children                                                      33,526
                Very low-income family caretakers                                        6,246
                On Supplemental Security Income (SSI)                                    5,650
                Long term care - elderly and physically disabled                         4,107
                Individuals with intellectual/developmental disabilities                 2,497
                Pregnant women                                                           1,717

Medicaid’s history is part of the long history of ‘poor relief’ programs
The roots of Medicaid, along with other means-tested programs like food stamps or welfare, go back
to the system of “indoor” and “outdoor” relief formalized by the Elizabethan Poor Laws (1597 -
1601) and adopted in the Colonies and later the United States. These kinds of local- and county-level
relief programs to the poor were greatly expanded after the Great Depression, and increasingly
centralized under State and Federal governments in the 1960s and 1970s.

Today’s Skilled Nursing Facilities (SNFs), for example, are the current incarnation of what were
called “rest homes” in the 1950s, which, in turn, evolved out of the “board and care homes” that
gradually replaced the “almshouses” of the 18th and 19th centuries. In the 1940s and 50s, nursing
homes began to be paid primarily through state and federal “medical vendor” programs; these were
supplanted in the early 1960s by the Kerr-Mills “Medical Assistance to the Aged” program, which
formed the base for Medicaid five years later.

Medicaid, as we know it today, was officially created as a voluntary State-Federal partnership in 1965
with addition of Title 19 to the Social Security Act. Wyoming began participating in July of 1967
with the passage of Senate File 183. Arizona was the last state in the Union to join, in October of
1982.

Medicaid is not Medicare
Medicare is an entirely federal health insurance program that pays most medical costs (and some
short-term home and facility care costs) for individuals age 65 and older and certain disabled
individuals under age 65.

Unlike Medicaid, the idea of Medicare developed between 1945 and 1965 as a way to provide health
insurance to older Americans, who, due underwriting to their age and medical conditions, had
difficulty obtaining insurance on the private market.1 This was a relatively new problem, since health

1   In the 1960s, 56% of Americans over 65 were not covered by health insurance.

         Wyoming Department of Health | Director’s Unit for Policy, Research, and Evaluation | February 2021 | Page 3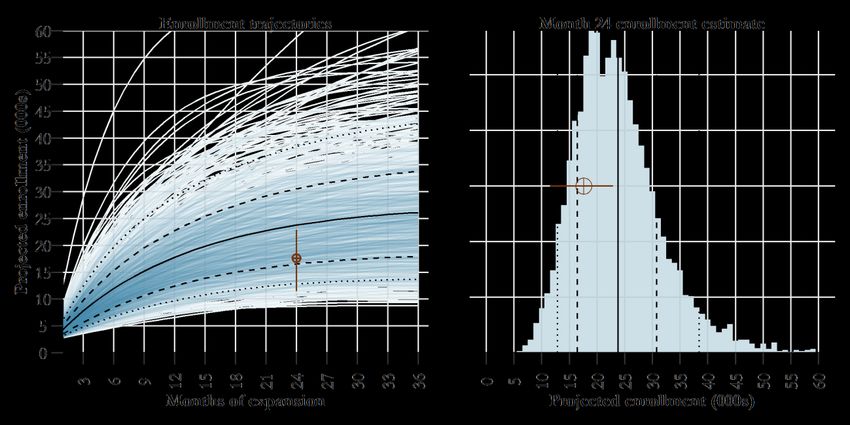
insurance only became widespread after the medical industry was thoroughly reformed in the early
20th century, and medicine actually began to prove useful to society in the 1930s and 1940s.
Medicare is a collection of four different benefit plans:
Part A pays for approximately 80% of hospital and short-term nursing home and home-health
services. Medicare generally does not pay for long-term care. Because of the high cost-sharing
requirements of Part A and absence of an out-of-pocket maximum, many beneficiaries also
purchase private “MediGap” policies to cover this risk.
Part B, which is optional, covers medically-necessary office and outpatient services from
physicians and other practitioners.
Part C, also known as “Medicare Advantage”, is an option for enrollees to replace “traditional
Medicare” (Parts A and B) with enrollment in a privately-operated managed care plan.
Part D, available since 2006, covers prescription drugs.
Where Medicare funding comes from a mix of sources — Medicare payroll taxes (36%), beneficiary
premiums (15%) and federal general revenues (43%) — Medicaid is funded through a combination
of federal general revenues and State funds.
Despite Medicaid and Medicare being distinct programs, many low-income older people can be on
both programs at the same time. For these “dual-eligibles”, Medicaid acts like a supplemental
‘MediGap’ policy, covering much of the patient cost sharing, as well as member premiums.
State administration, federal oversight
Medicaid is administered by states per agreements with the federal Centers for Medicare and
Medicaid Services (CMS) known as a “State Plans”. Any changes to each State Plan must be
approved by CMS, but states do have significant leeway in operating their programs between certain
guardrails.
Federal matching funds are significant
Most importantly, the federal government also reimburses states a significant fraction of their
Medicaid expenditures, known as the “Federal Matching Assistance Percentage” (FMAP). The
match varies by state and over time, but is set by formula in proportion to the state’s per-capita
personal income relative to the national per-capita personal income.
For Wyoming, the FMAP we have received over the last decade has generally been around the
statutory floor of 50% (with the exception of a recent temporary bump in response to the COVID-
19 pandemic). Poorer states like Mississippi and West Virginia have FMAPs as high as 77%.
Wyoming Department of Health | Director’s Unit for Policy, Research, and Evaluation | February 2021 | Page 4
The history of Wyoming’s FMAP is shown in Figure 1, below, along with the ratio of our per-capita
       personal income to the national figure. That trend indicates that Wyoming’s FMAP will remain at
       the 50% floor for the foreseeable future.

        Figure 1: History of Wyoming’s per-capita personal income in relation to the national figure (left),
                              and how this has affected our Federal Match (right).

       Expenditures and enrollment have increased significantly since the 1980s, but have been
       relatively stable over the last decade.

Figure 2: Historical Wyoming Medicaid enrollment (left), expenditures (middle, with nominal expenditures
in dark blue, inflation-adjusted 2020 dollars in light blue), and per-member per-month (PMPM) costs (right
            panel, with nominal and inflation-adjusted lines in dark and light blue, respectively)

             Wyoming Department of Health | Director’s Unit for Policy, Research, and Evaluation | February 2021 | Page 5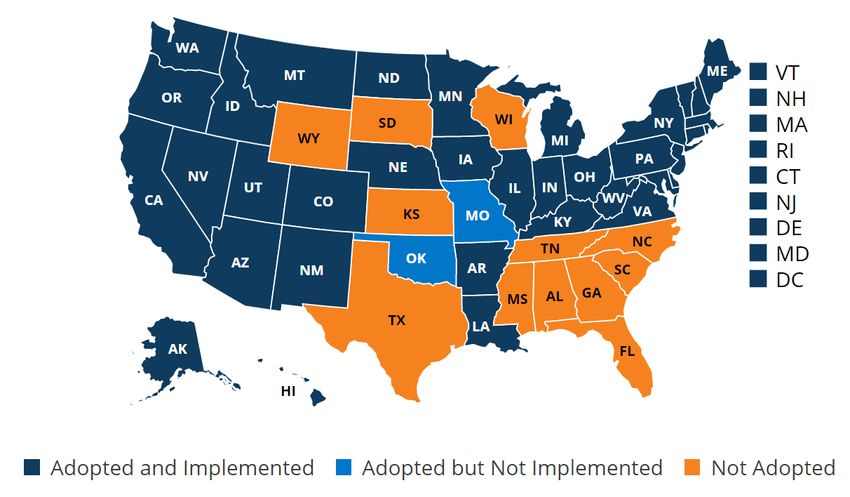
Because eligibility is partly tied to income, enrollment in Medicaid tends to increase in bad economic
times and decrease when things improve. Complicating the picture in Wyoming, however, was the
implementation of a rules-based eligibility system in 2014 that has significantly tightened up
eligibility decisions — note the steady decline in enrollment from 2015 to 2020.

Trends in enrollment, expenditures, and per-member per-month (PMPM) costs over the last decade
are shown specifically in Table 3, below:

Table 3: Medicaid expenditures, average monthly enrollment and per-member per-month (PMPM)
                                       costs, 2010 - 2020

                               SFY Expenditures Avg. Enroll PMPM
                               2010     $514,529,323         68,484        $626
                               2011     $519,823,344         69,756        $621
                               2012     $510,857,708         69,561        $612
                               2013     $512,934,509         69,166        $618
                               2014     $513,535,575         70,386        $608
                               2015     $524,279,441         74,812        $584
                               2016     $556,565,588         67,907        $683
                               2017     $556,274,739         63,247        $689
                               2018     $567,478,640         60,263        $674
                               2019     $554,032,539         59,826        $771
                               2020     $543,792,374         58,130        $779

It is important to point out, however, that the SFY 2020 figure does not reflect the recent increase in
eligible persons since the COVID-19 pandemic. While the Public Health Emergency has given
Wyoming Medicaid a small FMAP increase, it has also prevented the program from dis-enrolling any
members. As of December 2020, Medicaid enrollment stood at 64,979.

      Wyoming Department of Health | Director’s Unit for Policy, Research, and Evaluation | February 2021 | Page 6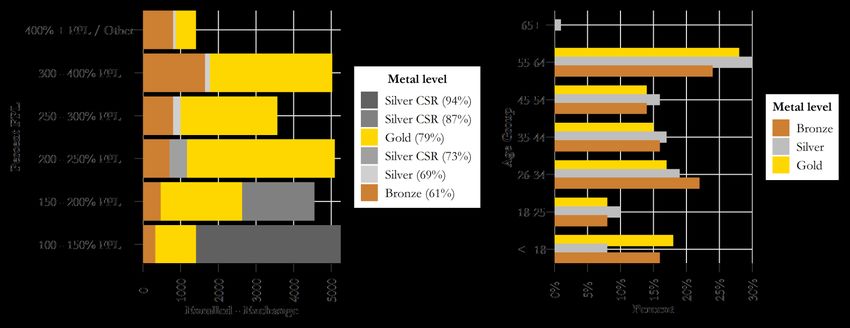
BACKGROUND - MEDICAID EXPANSION
Medicaid expansion is an optional path to provide health insurance to low-income, childless
adults, who otherwise have no options in this regard.

The original idea of expanding Medicaid medical coverage to low-income adults was a component
of the 2010 Patient Protection and Affordable Care Act (“the ACA”). The expansion was designed
to act in concert with the private insurance provisions of the ACA to allow all individuals under
400% of the Federal Poverty Level (FPL) to acquire subsidized health insurance.

The Supreme Court, however, ruled in 2012 (National Federation of Independent Business v. Sebelius) that a
mandatory expansion of Medicaid would be unconstitutionally coercive on states. This effectively
made Medicaid expansion an optional issue.

Currently, 39 states have elected to expand Medicaid; 12 have not. Figure 3, below, illustrates
Medicaid expansion decision status as of February 1st, 2021.

                                Figure 3: Map of Medicaid expansion states2

2 Kaiser Health News. https://www.kff.org/medicaid/issue-brief/status-of-state-medicaid-expansion-decisions-
interactive-map/

      Wyoming Department of Health | Director’s Unit for Policy, Research, and Evaluation | February 2021 | Page 7
From a pocket-book perspective, this decision has created a health insurance ‘coverage gap’ in the
   lowest-income group (0-100% of the Federal Poverty Level) because the original ACA contemplated
   that all of these individuals would be covered by Medicaid. Table 4, below, shows what kind of
   subsidized health insurance (Medicaid in purple, Exchanges in green) is available for a single,
   childless adult at various income levels.

                             Table 4: Insurance coverage options for childless adults
Income        Upper                                        Coverage options
range         bound
(percent      income       Non-Medicaid Expansion states                         Medicaid Expansion states
of the        for
Federal       2021
Poverty                                              Cost-sharing                                      Cost-sharing
                           Premium subsidy                                 Premium subsidy
                                                       subsidy                                           subsidy
Level)

   0-
              $12,880               No subsidy available                                Medicaid - low cost-
 100%                                                              Medicaid - low to no
                                                                                        sharing (plan covers
                            Plan premium           Plan covers 94%     premiums
 100 -                                                                                   >97% of average
              $17,774     capped at 2.07% of          of average                           medical costs)
 138%
                               income.              medical costs.

                            Plan premium           Plan covers 94%          Plan premium            Plan covers 94% of
 138 -
              $19,320     capped at 3.10% of          of average          capped at 3.10% of          average medical
 150%
                               income.              medical costs.             income.                     costs.

                            Plan premium           Plan covers 87%          Plan premium            Plan covers 87% of
 151 -
              $25,760     capped at 4.14% of          of average          capped at 4.14% of          average medical
 200%
                               income.              medical costs.             income.                     costs.

                            Plan premium           Plan covers 73%          Plan premium            Plan covers 73% of
 201 -
              $32,200     capped at 6.52% of          of average          capped at 6.52% of          average medical
 250%
                               income.              medical costs.             income.                     costs.

                            Plan premium           No cost-sharing          Plan premium             No cost-sharing
 250 -
              $38,640     capped at 8.33% of       subsidy, multiple      capped at 8.33% of         subsidy, multiple
 300%
                               income              plans available in          income                plans available in
                            Plan premium           various levels of        Plan premium             various levels of
 300 -                                             generosity (metal                                 generosity (metal
              $51,520     capped at 9.83% of                              capped at 9.83% of
 400%                                                   levels)                                           levels)
                               income                                          income

     400% +                                                   No subsidy available

           Wyoming Department of Health | Director’s Unit for Policy, Research, and Evaluation | February 2021 | Page 8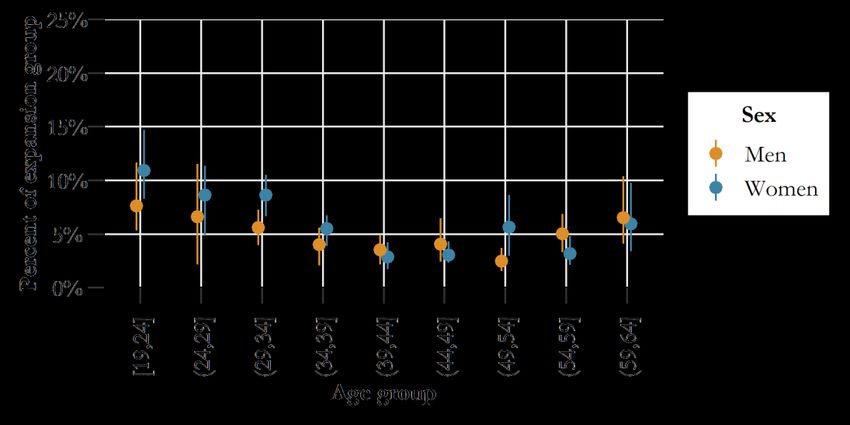
EXECUTIVE SUMMARY
If Wyoming were to expand Medicaid to non-disabled childless adults under 138% of the Federal
Poverty Level (FPL) per the Patient Protection and Affordable Care Act (“the ACA”), the
Department of Health would recommend an initial biennial appropriation of $20 million in
State General Funds and $144 million in Federal Funds. There are four important caveats:
This estimate comes with significant uncertainty — for State Funds, we are 90% sure it will be
$14 - $27 million over the first two-year period;
It assumes an enrollment growth curve that begins at zero and continues to grow well past two
years; subsequent biennial appropriations will necessarily be larger.
It assumes a “vanilla” expansion of Medicaid, without the kind of bells and whistles that would
require a waiver.
All analyses are based on pre-COVID data, and it’s unclear how long-lasting the economic
effects of the pandemic will be. Additionally, the effect of any Medicaid budget cuts is not
considered; currently those rate cuts would reduce costs (and revenues) by 2.5%.
Aside from the appropriation recommendation, the highlights from this analysis include:
We anticipate approximately 24,000 new Medicaid enrollees by the end of the first biennium.
This figure is higher than the original (2011) Milliman estimate, and we project both a wider
range of uncertainty — with 90% of scenarios falling between 13,000 and 38,000 people at the
24-month mark — and that the 24-month estimate is only part of a larger enrollment trajectory
that will continue to grow before flattening out after 36 months.
Of those enrolling, approximately half of individuals will have incomes in the insurance coverage
gap (100% FPL or less); 64% will have previously been uninsured (the remainder having some
form of insurance coverage today); and ~ 60% will be employed.
The estimated impacts of Medicaid expansion on newly-enrolled members include: a slight
decrease in mortality for uninsured individuals between 45 and 64, increased healthcare
utilization, improved mental health, and increased financial stability.
Two significant second-order effects of expansion come from the “crowding-out” of private
insurance coverage (i.e., previously insured members moving to Medicaid). These include:
o Significant (~50-67%) dampening of projected revenues to providers due to Medicaid
rates being lower than commercial rates, though net provider revenue will almost
certainly increase.
o A probable (though not guaranteed) 5 to 15% decrease in average per-person costs for
members remaining on the Exchange. This effect is similar to the implementation of a
high-risk pool.
Wyoming Department of Health | Director’s Unit for Policy, Research, and Evaluation | February 2021 | Page 9MOTIVATION
Why revise Wyoming’s original (2011) projections for Medicaid expansion? The simple answer is
that experience from other expansion states has shown that actual enrollment has often exceeded
original projections. This gap — between original projections3 and actual enrollment4 — is shown
in Figure 4, below.
Figure 4: Gap between projected and actual enrollment, by state. Dark blue bars show actual
enrollment, and light blue bars show original projections.
Figure 4 clearly demonstrates the need to thoroughly revise Wyoming’s estimates of enrollment and
costs, since many of the models used to estimate enrollment in these states may have been the same
We do so using two important principals:
Projections should either be based on (a) empirical data or (b) fully-explained assumptions
grounded in economic theory.
Modeling and quantifying uncertainty is just as important as making point estimates.
As a comparison, our revised estimates are built off a statistical model that estimates overall
enrollment trajectories. Figure 5, on the next page, shows how this model (blue lines and shaded
regions) fits the actual experience for expansion states (black circles) and predicts the experience of
non-expansion states.
3 Projections collected by the AP, available here: https://www.washingtontimes.com/news/2015/jul/19/projected-
actual-enrollment-for-medicaid-expansion/
4 https://www.kff.org/health-reform/state-indicator/medicaid-expansion-enrollment
Wyoming Department of Health | Director’s Unit for Policy, Research, and Evaluation | February 2021 | Page 10Figure 5: Actual (black circles) vs. predicted (blue) enrollment trajectories and uncertainty. Dashed
lines indicate SAHIE estimates of total adults under 138% FPL.
Wyoming Department of Health | Director’s Unit for Policy, Research, and Evaluation | February 2021 | Page 11The Department has been refining these estimates each year since 2014, as more current data
becomes available.
The last version of these estimates was released in December 2019; at that point, we estimated
expansion would cover an estimated 20,000 people and cost the State approximately $18 million in
State General Funds in the first biennium.
The models and data behind this document are largely similar to the 2019 estimates. We did,
however, make some tweaks:
New enrollment data for new expansion states (Montana, Idaho, Utah, Virginia and Maine)
was added to the enrollment model.
The demographic group denominator for the enrollment model was improved by using
Small Area Health Insurance Estimates (SAHIE) data, and interpolating yearly estimates
smoothly over time (i.e., per the dashed lines on Figure 2).
We also re-parameterized the enrollment model and used ‘broader’ predictors (e.g., using
dimension-reduction techniques like Principal Components Analysis) in order to avoid over-
fitting.
The core dataset was changed from 5-year 2013-2018 American Community Survey data to
1-year 2019 ACS data. This tradeoff reduces precision but, in theory, increases currency,
though the effects of the COVID pandemic are, unfortunately, not able to be taken into
account.
Ultimately, these changes have resulted in some shifts from last year’s projection:
Our enrollment projection is somewhat higher (24,000 vs. 20,000) and somewhat less certain
than last year. The new enrollment model includes data from Idaho, Montana, and Utah;
since both Idaho and Montana experienced higher-than-national-average enrollment
trajectories, this has likely pulled up Wyoming’s estimate, which was previously influenced
more by lower-than-average enrollment states like North Dakota.
Due to the enrollment increase, costs to the state are thus slightly higher ($20 million in
SGF, vs. $18 million).
Wyoming Department of Health | Director’s Unit for Policy, Research, and Evaluation | February 2021 | Page 12ENROLLMENT AND COSTS
Enrollment
After two years (24 months), we expect Medicaid expansion enrollment to be at approximately
24,000 people, though the count is projected to grow slightly over subsequent years before
plateauing. Figure 6, below, shows the significant range of uncertainty behind this 24-month
snapshot (right) and in the overall trajectories out to 36 months (left).
Figure 6: Uncertainty in enrollment
On the figures, the blue histogram (right) and blue lines (left) show the range of potential scenarios
resulting from the model. In order to quantify specific ranges, we annotate this figure with three sets
of intervals:
Dashed lines represent 67% percentile (equal-tailed) intervals. This means that, working in
from tails, 67% of potential scenarios lie between the dashed lines.
Dotted lines show 90% percentile intervals.
The brown circle and lines show estimates from Milliman (2011) and their “high” and “low”
scenarios. Our estimates are roughly consistent with the original Milliman projections at 24
months, but note that the range of uncertainty is larger, and that we project a growth curve
past the first biennium.
Wyoming Department of Health | Director’s Unit for Policy, Research, and Evaluation | February 2021 | Page 13Costs
We project Medicaid medical and administrative costs for this population at ~$164 million for the
first biennium. These costs will grow with a flatter trajectory than enrollment, due to the effects of
adverse selection, as our model assumes that the first people to sign up for Medicaid expansion will
be the least healthy and thus the most expensive to cover.
This means that, in the world of this model, enrollment has an inverse relationship with per-member
per-month costs. In other words, if enrollment take-up is low, we anticipate the covered population
to be sicker (and therefore more costly) than if take-up rate is high. Figure 7, below, shows the
estimated trajectories for total monthly cost (upper panel) and per-member per-month medical costs
(lower panel). Higher enrollment scenarios are shown as more intense shades of blue.
Figure 7: Projected monthly Medicaid expenditures (upper) and per-member per-month (PMPM)
medical costs (lower). The white lines show expected values.
Note on the figure above that the expected total monthly costs at the end of the biennium are
approximately $9 million. With no other information, this is the figure we would use to project costs
for the next biennium.
Wyoming Department of Health | Director’s Unit for Policy, Research, and Evaluation | February 2021 | Page 14Per-member per-month costs
Breaking down per-member per-month (PMPM) costs by claim type in Figure 8, below, we see a
similar correlation between enrollment and PMPM — scenarios where we expect more enrollment
will, generally speaking, have lower PMPM costs.
Figure 8: Modeled per-member per-month costs by service type. Blue lines represent scenarios
where overall enrollment is higher. The white line shows the expectation across all scenarios.
Cost by provider category
When we combine expected expenditures by claim type with existing utilization patterns for low-
income adults currently on Medicaid, we can estimate how many dollars will go to which kind of
providers.
Table 5, on the next page, illustrates this breakdown of the total ~$164 million expected biennial
cost. It tells us, for example, that we can expect in-State hospitals to receive ~$26.2 million in
inpatient revenue and ~$24.0 million in outpatient revenue. Note, however, that crowd-out of
private insurance (discussed in a subsequent section) may reduce potential revenue received by all
providers, though net revenue will remain positive.
Wyoming Department of Health | Director’s Unit for Policy, Research, and Evaluation | February 2021 | Page 15Table 5: Expected biennial expenditures by provider type and in-State vs. out-of-State location
Percent of claim Expected
5
Expected type Expenditures
biennial Out-of- Out-of-
Claim type cost Provider category In-State State In-State State
Dental $3.9 Dental 96.6% 3.4% $3.8 $0.1
Inpatient $36.7 Hospital 71.3% 28.7% $26.2 $10.5
Ambulance 3.2% 0.4% $1.3 $0.2
Behavioral Health 19.2% 0.1% $8.0 $0.0
Dental 0.1% 0.0% $0.0 $0.0
Equipment / Supplies 3.2% 1.3% $1.3 $0.5
Laboratory/Imaging 4.2% 3.2% $1.7 $1.3
Professional $41.6
Other 11.4% 0.7% $4.7 $0.3
PT/OT 4.2% 0.1% $1.7 $0.0
Primary Care 17.8% 2.5% $7.4 $1.0
Specialist 24.6% 2.5% $10.2 $1.0
Vision 1.0% 0.2% $0.4 $0.1
Ambulatory Surgical Center 3.8% 0.1% $1.8 $0.0
Hospital 52.0% 4.4% $24.0 $2.0
Outpatient $46.2 Other 1.2% 0.4% $0.6 $0.2
PT/OT 0.1% 0.0% $0.0 $0.0
Primary Care 37.8% 0.3% $17.5 $0.1
Pharmacy $27.2 Pharmacy 83.1% 16.9% $22.5 $4.6
Total medical $155.6 85.4% 14.6% $132.9 $22.7
Administrative $7.8
Total cost $163.4
Administrative costs
With a “vanilla” expansion (e.g., no waivers or other administrative overhead), we estimate
administrative costs at 5% of total medical costs, which is consistent with the costs of the current
Medicaid program. In any other scenario (e.g., waivers that change how Medicaid would administer
the program or what benefits are offered), expected costs could increase.
Administrative costs pay not only for State infrastructure, but for all the marginal costs of processing
additional claims and eligibility applications generated by the new members.
5 These percentages come from existing Family Care (low-income Medicaid adult) utilization patterns.
Wyoming Department of Health | Director’s Unit for Policy, Research, and Evaluation | February 2021 | Page 16Required appropriation
In order to translate these total costs into a potential appropriation recommendation, we make some
adjustments:
Per the ACA, the Federal government will pay 90% of these medical costs after CY 2020.
This only applies to a “vanilla” expansion. It’s unclear what the matching percentage would
be for a scenario under various Medicaid expansion waivers, but it could be lower than 90%
depending on program elements and design.6
The Federal government will match 50% of administrative expenditures.
Figure 9, below, shows the uncertainty in the State General Fund (SGF) and Federal Fund (FF)
required expenditures for the first biennium.
Figure 9: Uncertainty in first biennium expenditures, by source
The uncertainty here is important. Our recommendation of $20 million SGF is based on the
expected value, but there is some non-negligible probability that actual SGF expenditures could be
as high as $27 million or as low as $13 million.
6 FMAP for Wyoming has, in recent years, been at 50%.
Wyoming Department of Health | Director’s Unit for Policy, Research, and Evaluation | February 2021 | Page 17ENROLLEE PROFILE
Because the simulation for enrollment and costs is based around Census data, we can take the
simulation results and put together a profile of enrollees based on available demographic data.
Demographics
In terms of age and sex, we characterize the Medicaid expansion population as having two broad
groups:
A group of younger (< 35 years old) enrollees, making up an estimated 48% (38 -58%) of
the total population. This population will largely be female.
An older (over 50 years old) group of enrollees, making up an estimated 29% (20 - 40%) of
the expansion group.
This bimodal distribution can be seen in Figure 10, below, where orange dots and ranges show
estimates for men and blue dots and ranges show estimates for women.
Figure 10: Age and sex estimates
Health status
Looking at seven different chronic conditions, we estimate that the expansion eligible group will be
roughly similar to those adults between 18 and 64 that are currently on Medicaid or Medicare
(“publicly-insured”). Figure 11, on the next page, shows our estimate of prevalence for Wyoming
adults in various categories, as well as the total number of co-occurring conditions.
Wyoming Department of Health | Director’s Unit for Policy, Research, and Evaluation | February 2021 | Page 18Figure 11: Chronic conditions
These estimates, of course, are for the total eligible, not those actually enrolled. As previously noted,
the overall health of the pool will likely be negatively correlated with its size; a larger pool will be, on
average, healthier. Conversely, a low-enrollment scenario will likely be less healthy, and thus have the
higher per-member per-month costs seen in the lower panel of Figure 6.
Wyoming Department of Health | Director’s Unit for Policy, Research, and Evaluation | February 2021 | Page 19Education
The vast majority of people will be high school graduates and most (~58%) will have at least some
college education.
Poverty level
We estimate that approximately half (41 - 56%) of enrollees will have incomes below 100% FPL; the
other half will be between 100 - 138% FPL.
Employment and insurance coverage
Approximately 60% will be employed, 34% will not be in the labor force (e.g., retired or not looking
for work), and 5% will be unemployed (and actively looking for work).
Regarding insurance, we estimate that 64% (45 - 76%) of enrollees will have been previously
uninsured, with the next largest fraction being the 26% (15 - 48%) that previously had directly-
purchased insurance.
The remainder of this page has intentionally been left blank.
Wyoming Department of Health | Director’s Unit for Policy, Research, and Evaluation | February 2021 | Page 20EFFECTS ON MEMBERS
Aside from the obvious impact of expanding health insurance coverage and reducing the uninsured
rate, many studies have attempted to estimate the effects of Medicaid expansion on newly-enrolled
low-income individuals. The Kaiser Family Foundation maintains a good current summary of the
literature.7 Most of these studies, however, are observational and vary in quality and reliability.
Two studies are worthy of serious attention; both come from quasi-experimental randomized
controlled trials — the gold standard for any experiment, since it offers the best chance to estimate
causal effects isolated from the problems of confounding variables.
(1) The first rigorous study was conducted in Oregon, which implemented a limited expansion of
Medicaid in 2008, prior to the passage of the Affordable Care Act and the availability of the optional
adult Medicaid expansion. The lottery-based design of the expansion afforded researchers a unique
opportunity to conduct a randomized trial.
The following summary of effects comes from a dedicated web-page for the experiment, which can
be accessed at https://www.nber.org/oregon/
(a) Health utilization generally increased, specifically in the following areas:
Hospitalizations;
Emergency department visits;
Office visits;
Prescriptions, particularly for mental health and diabetes; and,
Preventive screenings - cholesterol monitoring and mammograms
(b) Financial hardship decreased. Medicaid members reported decreases in out-of-pocket
spending, catastrophic medical expenditures, medical debt, and skipped bills.
(c) Self-reported health status increased and reported depression decreased, but physical
health markers did not improve by any statistically-significant degree.
Members on Medicaid had a 25% higher probability of reporting themselves in good to
excellent health compared to the control group.
Rates of reported depression decreased by 9.2 percentage points compared to the
control group baseline rate of 30 percent.
7 https://www.kff.org/medicaid/issue-brief/the-effects-of-medicaid-expansion-under-the-aca-updated-findings-from-a-
literature-review-august-2019/
Wyoming Department of Health | Director’s Unit for Policy, Research, and Evaluation | February 2021 | Page 21 No statistically-significant changes to blood pressure, cholesterol or glycated hemoglobin
were detected.
(d) There was no statistically-significant evidence that Medicaid expansion changed
employment status, earnings, or receipt of government cash benefits (e.g. TANF,
SSI/SSDI).
Researchers did note a small increase in SNAP (“food stamps”) enrollment.
(2) The most recent study8 took advantage of an IRS mailing in 2017 to 3.9 million randomly-
selected individuals (out of 4.5 million) who had paid a tax penalty for lacking health insurance
under the ACA. The objective of the mailing was to encourage people to enroll in coverage. As with
the Oregon Health Insurance Experiment, this afforded researchers the opportunity to conduct a
randomized study. On average, researchers found that each letter increased insurance coverage in
this group by approximately 1 year for every 87 letters sent.
(a) The most important finding from this study, however, was the estimated reduction in
mortality for previously-uninsured 45-64 year-olds over the next two years by
approximately 1 death for every 1,648 individuals who were sent the letter. The study
found no evidence of a reduction in mortality for younger age groups.
This study is groundbreaking in the sense that its size and quasi-experimental nature allowed
researchers to rigorously estimate the effect of health insurance coverage on a relatively-rare
outcome (death).
Application to Wyoming
If we assume the expansion of Medicaid in Wyoming has an effect analogous to this IRS mailing
(i.e., it represents an intent-to-treat on the whole population of eligible people, not just those who
enroll), this estimate would translate into ~ 3 - 4 avoided deaths for the approximately 6,055 (+/-
870) uninsured individuals between 45 and 64 in Wyoming below 138% FPL 9 over the next two
years, who would otherwise experience ~ 50 - 70 deaths (an estimated baseline mortality rate of
1%) in the same period.
8 Goldin, Lurie and McCubbin. “Health Insurance and Mortality: Experimental Evidence from Taxpayer Outreach”.
NBER working paper No. 26533. http://papers.nber.org/tmp/91050-w26533.pdf
9 American Community Survey 5-year PUMS (2012-16)
Wyoming Department of Health | Director’s Unit for Policy, Research, and Evaluation | February 2021 | Page 22EFFECTS ON PROVIDERS
At first blush, Medicaid expansion would seem to be a pure benefit to medical providers in
Wyoming. After all, if many previously-uninsured people are now covered by Medicaid, hospitals
and physicians will see a decline in uncompensated care and bad debt, which will no doubt increase
revenue (i.e., per Table 1 in the Costs section.)
Medicaid expansion will indeed reduce uncompensated care, but the actual revenue situation for
providers is not so clear-cut. While we believe net revenues will ultimately increase, they will also be
lower than total new revenue might suggest, due to the effect of “crowd-out” on private insurance.
What is crowd-out?
Many members who might be eligible for Medicaid expansion are currently covered by federally-
subsidized private insurance purchased directly from the ACA Exchange.
Here, premium subsidies (Advanced Premium Tax Credits, or APTCs) are generally available
to individuals between 100 - 400% of the Federal Poverty Level (FPL), and cost sharing
reduction (CSR) subsidies are generally available between 100 - 250% FPL.10
Both of these subsidies make acquiring and using directly-purchased insurance fairly
affordable for these income brackets.
This situation should be contrasted with that of individuals below 100% FPL and individuals
above 400% FPL, who get absolutely nothing.
“Crowd-out” therefore means that individuals between 100% and 138% FPL on the Exchange
would almost certainly drop their private plans and enroll in Medicaid. This is for three reasons:
Most importantly, when individuals attempt to re-enroll on the Exchange during open
enrollment season, they will be administratively re-directed to enroll in Medicaid.
These individuals have already demonstrated a need for health insurance.
Depending on plan design, Medicaid will generally be more affordable than even these
highly-subsidized plans.
10While the federal government has stopped paying insurers Cost Sharing Reduction subsidies, they still mandate the
availability of low cost-sharing plans. In response, most insurers have significantly increased their premiums for Silver-
level plans, dramatically increasing the revenue from Advance Premium Tax Credits. While this creates significant
distortions between metal-level pricing, cost-sharing reduction subsidies are now effectively available from the APTC
funding.
Wyoming Department of Health | Director’s Unit for Policy, Research, and Evaluation | February 2021 | Page 23Some individuals covered by employer insurance will also move over to Medicaid, but this effect is
less predictable (see the Methodology section for details on how crowd-out was implemented).
Effect on provider revenues
Generally, private insurance pays higher unit prices than Medicaid. This means that the same
previously-insured individuals using the same amount of health care under Medicaid would translate
into a revenue loss for their providers for those particular patients.11
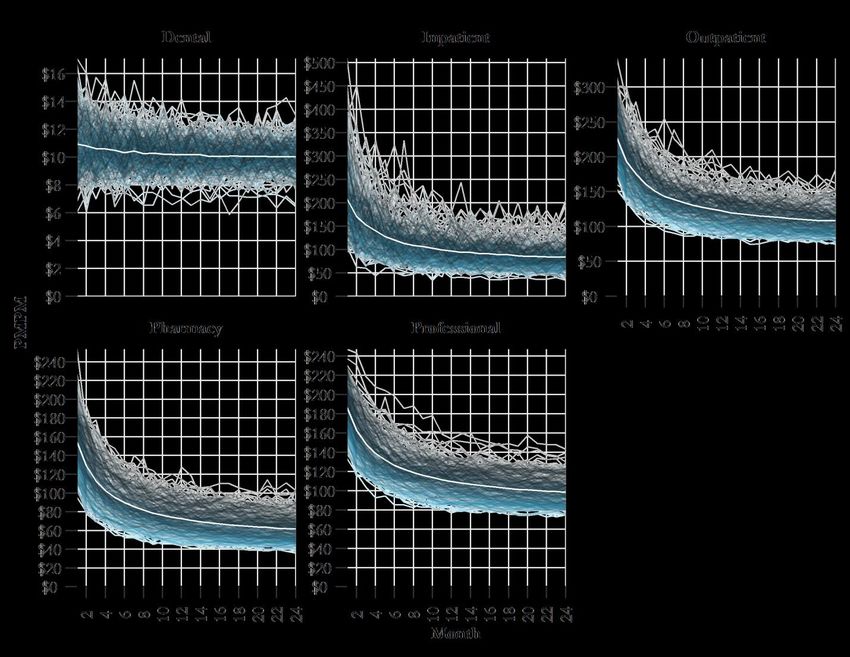
Figure 12, below, illustrates the cumulative effect of new Medicaid revenues (in black) against the
lost revenue due to crowd-out (brown), with the net revenue shown in blue. Note that in all
scenarios, net revenue is positive for providers despite crowd-out.
Figure 12: New revenue (black), est. crowd-out (brown), and net revenue (blue)
11It should be noted that these lower unit prices (along with the 10% State match) also translate into probable net
savings for the Federal government, but this effect is harder to estimate and will not be discussed here. Nonetheless, it
does explain much of the reluctance by the Federal government to agree to partial Medicaid expansions (e.g., under
100% FPL).
Wyoming Department of Health | Director’s Unit for Policy, Research, and Evaluation | February 2021 | Page 24To estimate these effects, we applied an estimated Medicaid-to-commercial rate ratio to the
inpatient, outpatient and professional costs12 experienced by those who were previously directly-
insured or covered by employer-sponsored insurance in the simulation.
Table 6: Estimated Medicaid-to-commercial rate ratios by claim type
Medicaid-
Commercial
Claim Type Ratio Methodology Source
Weighted average of ratios for provider
Navigant 2018 Medicaid
types where rates were known
Professional 0.64 rate benchmarking
(behavioral health, laboratory, primary
report.
care, specialist, and vision).
Weighted average of estimated hospital
Milliman hospital cost
aggregate rate (with UPL) and
Outpatient 0.85 study; CHIP data on
estimated FQHC/RHC rates (higher
FQHC/RHC payments
than commercial).
Estimated hospital aggregate rate (with Milliman hospital cost
Inpatient 0.69
UPL) study
For each claim type, the weighted average was calculated using existing low-income adult Medicaid
utilization (by expenditure), shown in Table 5 in the costs section.
The remainder of this page has intentionally been left blank.
12We specifically exclude pharmacy costs since changes in unit rates (a) largely accrue to out-of-state pharmaceutical
companies and (b) the effects are difficult to determine due to the complications in pharmacy pricing (rebates, pharmacy
benefit managers, etc.).
Wyoming Department of Health | Director’s Unit for Policy, Research, and Evaluation | February 2021 | Page 25EFFECTS ON PRIVATE INSURANCE
The major effect Medicaid expansion has on the private insurance market is a probable reduction in
Exchange pool costs somewhere between 5 - 15%. This is a positive outcome, but it is not
guaranteed.
This effect is akin to that of a high-risk pool: if the sickest (and therefore, the most expensive)
enrollees are moved over to Medicaid, costs should decrease for the rest of the private market.
The real question is: are the individuals moving from Exchange coverage to Medicaid truly sicker or
more-expensive than the pool average? Available evidence indicates that they are.
One national study estimated average cost reductions at approximately 11%13; the same
authors more recently estimated the impact on private insurance rates if Wisconsin were to
expand Medicaid at 13 - 19%.14
An actuarial study of New Hampshire’s Medicaid Expansion concluded that if the expansion
group were removed from the Exchange, adjusted claims costs would decrease by 14%.15
The Kaiser Family Foundation estimates that states that expanded Medicaid had lower
aggregate risk scores on their Exchange than states that did not.16
Using a Census-based simulation similar to the Medicaid expansion methodology, but restricted to
the population of directly-insured individuals in Wyoming17, we also arrive at a similar estimate of
reduction in modeled costs: ~10%, with a 95% credible interval between 5% and 15%.
In addition to this evidence, there are also intuitive reasons to believe that the Medicaid expansion
members are likely sicker and more costly than average.
13 Sen and DeLeire. “How does expansion of public health insurance affect risk pools and premiums in the market for
private health insurance? Evidence from Medicaid and the Affordable Care Act Marketplaces.” Health Economics. July
30, 2018. https://onlinelibrary.wiley.com/doi/abs/10.1002/hec.3809 and previous work (2016) here:
https://aspe.hhs.gov/system/files/pdf/206761/McaidExpMktplPrem.pdf
14 Sen and DeLeire. “Medicaid Expansion in Wisconsin Would Lower Premiums For Those With Private Insurance.”
Health Affairs blog. June 6th, 2019. https://www.healthaffairs.org/do/10.1377/hblog20190605.87178/full/
15 Gorman Actuarial. 2016 Actuarial Analysis of NH Premium Assistance Program.
https://www.nh.gov/insurance/reports/documents/08-28-17-ga-nh-pap-analysis-final.pdf
16 https://www.kff.org/health-reform/issue-brief/data-note-effect-of-state-decisions-on-state-risk-scores/
17 In the simulation, we apply the BRFSS model (Model 2 in the Technical Details section) to estimate the count of
chronic diseases for the subset of directly-insured individuals in the American Community Survey PUMs. We then apply
a MEPS-based utilization model (Model 5, based on directly-insured individuals in that survey) to estimate standardized
costs based on the predicted chronic disease count and demographic factors. Simulation results are used to estimate
what happens to overall enrollment and pool average costs if individuals between19-64 and below 138% FPL are
removed.
Wyoming Department of Health | Director’s Unit for Policy, Research, and Evaluation | February 2021 | Page 26The first reason is the well-established correlation between income and health, known as the
“income-health gradient.”18 On average, poorer people also tend to be sicker. So, without knowing
anything else, it stands to reason that taking the poorest members of the Exchange out of the pool
might improve the average health of the remaining covered lives.
The second reason is the evidence on plan selection from the Exchange itself (Figure 13, below),
that provides two important takeaways:
The closest analog to the Medicaid Expansion group (100 - 150% FPL) has largely bought
the most generous plans available to them. Higher actuarial value (i.e., less cost-sharing, on
average) usually translates into higher utilization because there is less 'skin in the game' for
the member. Higher utilization translates into higher cost.
On the panel to the right, it’s clear that people who buy Silver plans (i.e., the bottom two
income groups, where CSR Silver variants are most prevalent) are largely older than those
who buy Gold or Bronze plans (the upper income groups). Older people are generally sicker
and more expensive to insure than younger people.
Figure 13: 2019 Marketplace plan selections by income and age group19
18A good summary can be found here: https://www.irp.wisc.edu/publications/focus/pdfs/foc301b.pdf
19Data from CMS Marketplace Open Enrollment Public Use File (PUF) for Wyoming.
https://www.cms.gov/Research-Statistics-Data-and-Systems/Statistics-Trends-and-Reports/Marketplace-
Products/2019_Open_Enrollment
Wyoming Department of Health | Director’s Unit for Policy, Research, and Evaluation | February 2021 | Page 27Alternative scenario
This outcome, however, is not guaranteed, and Wyoming’s experience may vary from these national
estimates. The primary insurer on the Exchange, Blue Cross Blue Shield (BCBS) notes, for example,
that there is a reasonable possibility that the health status of the enrolled population at the higher
income levels may actually be worse than that of the low-income population that would move to
Medicaid, and thus some chance that the remaining risk pool post-expansion would be most costly
than the current risk pool, resulting in higher rates for the non-subsidized individuals.
This is potentially due to the unique selection effects of significant federal premium subsidies
(Advanced Premium Tax Credits) that mask the traditional income-health gradient on the Exchange
by making the effective price of insurance for low-income individuals dramatically cheaper than for
higher-income people. This lower effective price for the member means that healthier low-income
individuals (with low or zero premiums) are more likely to enroll than healthier higher-income
members.
BCBS also notes that the loss of individuals purchasing mostly Silver-level plans may also reduce the
value of the “silver loading” strategy to the covered members that remain.
Note on selection effects
While there is no doubt that there is a selection effect caused by the subsidies, the Department
believes that these effects are more likely to happen in much higher income levels (i.e., around the
400% FPL cliff, not near 138% FPL) because the premium tax credit subsidies ramp down gradually
between 100% - 400% FPL before disappearing entirely.
As shown in Figure 13, the 100 - 150% group is only ~20% of the total Exchange population. The
real question is therefore whether this bottom fifth is less healthy than the much larger 150 - 400%
group above it that remains, not necessarily how the 100% - 400% group compares with the 400%+
group.
Wyoming Department of Health | Director’s Unit for Policy, Research, and Evaluation | February 2021 | Page 28EFFECTS ON STATE FINANCES
In and of itself, the expansion of Medicaid to low-income adults will not generate any revenue for
the State of Wyoming’s government. Without any State action, any additional federal funding
flowing into Wyoming would go directly to medical providers.
What expansion might do is allow for potential State-level efficiencies by substituting a dollar of
State General Funds with 10 cents of State General Funds plus 90 cents of Federal Funds in certain
programs.
Over the years, the State has created a number of programs funded largely by the State General
Fund (SGF) to provide safety-net health care services to the State’s most vulnerable and low-income
populations. If the State expands its Medicaid program, these programs, as currently conceived,
would no longer need to be funded at the same levels, because individuals previously served by these
programs will have access to comprehensive health insurance — either through Medicaid or through
subsidized private plans on the Exchange.
These cuts are known as “offsets”, and can be used to partly make up the State General Fund
appropriation required to fund Medicaid Expansion. The offsets are only realized, however, if the
political decision is made to make this substitution; i.e., by cutting State General Funds under the
assumption that the providers that were paid from those Funds can make it up in Medicaid billing.
The remainder of this page has intentionally been left blank.
Wyoming Department of Health | Director’s Unit for Policy, Research, and Evaluation | February 2021 | Page 29METHODOLOGY
All of the estimates in this document come from a simulation-based approach that combines the
most recent and detailed Census data available for Wyoming (2019 1-year ACS estimates) with four
different models to project:
How many members will enroll in Medicaid;
What kind of people are most likely to enroll; and,
How much those members will incur in health care costs to the Medicaid program.
Figure 14, below, shows how the models interact with the core Census data (black) in the simulation.
Narrative explaining the figure follows on the next page.
Figure 14: Medicaid expansion model framework
Wyoming Department of Health | Director’s Unit for Policy, Research, and Evaluation | February 2021 | Page 30Generally speaking, the each iteration of the simulation follows a series of steps:
(1) We start by narrowing the universe of potentially eligible members from all Wyoming residents
to civilian, non-institutionalized adults between the ages of 19 and 64 who are under 175% of the
Federal Poverty Level.20 We also exclude individuals who already have Medicare or Medicaid as their
primary insurance.
Using the person-level and replicate weights included in the Public Use Microdata Sample
(PUMS), we estimate an expected total (this happens to be 48,316 in the 2019 1-year ACS data)
and standard deviation (3,377) for this subset of people. We then draw a value from this
(assumed normal) distribution to use as the eligible population count for each iteration of the
simulation. This allows us to propagate at least some of the measurement error of the Census
microdata into the results.
We use the replicate weight variable with the total number of people closest to this draw as the
base weight for each iteration, and then use it to expand the Census microdata samples into a
simulated group of people. In this case, there are 468 observations in the survey data that are
repeatedly expanded into some number between 42K and 54K “people”. Note that using the 5-
year ACS PUMS would have resulted in a more granular sample (~5x the data), but also one that
would have been less current.
(2) Now we need some mechanism to sort the simulated group of people by their propensity to
enroll in Medicaid. To do this, we make the assumption that those individuals with higher expected
personal healthcare costs are more likely to enroll than those without. This is due to adverse
selection (e.g., sicker people are more likely to need insurance), but also to the fact that eligibility in
Medicaid can be ‘retroactive,’ which allows for many of the sickest members to automatically be
enrolled post hoc if the hospital they end up in finds they are uninsured.
The first step is to predict the total number of chronic conditions (out of 10 measured) in
each simulated person, based on their age, sex, race/ethnicity, household income, veteran status,
whether they own or rent, employment status and insurance type. The chronic disease model
(Model 2 in the next section) is based on restricted 2017 survey data collected in Wyoming by
the Behavioral Risk Factor Surveillance System (BRFSS).
Using the same demographic data plus the predicted number of chronic conditions, we then
predict expected (average) standardized21 health care costs for the simulated individuals
20 The actual income eligibility criteria for Medicaid expansion is 138% of FPL, but the simulation allows for the
potential of individuals close to the eligibility criteria to intentionally reduce their income in order to qualify for health
care coverage. This was done in response to surprisingly high take-up rates in some expansion states, but it does not
materially affect the overall enrollment projections.
21 In the MEPS data, both total expenditures and utilization (visits / prescriptions / inpatient stays) are surveyed. Since
prices differ across payers, we calculate average prices by aggregating expenditures and dividing by aggregate units for
Wyoming Department of Health | Director’s Unit for Policy, Research, and Evaluation | February 2021 | Page 31using a model built off of 2017 Medical Expenditure Panel Survey (MEPS) data (Model 3, in the
next section). While this is a national dataset (not Wyoming-specific), it covers a large universe
of individuals (e.g., including the uninsured), and contains a lot of demographic information that
helps model annual health care costs.
What we’re basically doing in these first two steps is generating an extensively-underwritten
health insurance premium for each simulated person.
After each member is assigned an expected total cost, we use the following simplifying
assumptions to modify that total cost into an estimated personal cost (e.g., out-of-pocket costs
to the individual). These include:
o Insured individuals, whether with employer-sponsored insurance (ESI) or directly-
purchased insurance, will only personally face 20% of their costs, with a maximum out-
of-pocket of $5,000.22
o Uninsured individuals (including those with only VA/TRICARE or IHS) will only have
a willingness-to-pay that is ~20% - 35% of their total costs.23 Health care economists
generally believe this is due to the moral hazard effects of EMTALA and
uncompensated/ charity care.
o Individuals with ESI will face an approximate “hassle cost” of $1,000 in order to switch
from their employer plan to Medicaid.
o Individuals with directly-purchased insurance who are below 138% (i.e., those currently
purchasing insurance on the individual ACA marketplace) will be prodded automatically
to enroll in Medicaid (and subsidies for this population would be unavailable). We model
this as a strong incentive of -$1,000.
At this point, the list of individuals in the simulation is sorted by a “willingness to pay” for
Medicaid coverage.
(3) Based on the state-level enrollment model (Model 1 in the next section), we draw a random
enrollment trajectory, which estimates the total number of people enrolled in Medicaid for each
month. These trajectories can be seen in the right panel of Figure 2 in the Enrollment section.
each utilization category (e.g., total ED costs / total ED visits). We then apply the average price for each category to the
units reported by each person and add up total standardized costs to use as the outcome variable.
22 This is based on the 20% coinsurance and approximate MOOP in the State Employees Group Insurance plan.
23 Finkelstein, et. al. “Subsidizing health insurance for low-income adults: evidence from Massachusetts.” National
Bureau of Economic Research. Working Paper 23668. Page 31. Finkelstein also cites three other papers with similar
estimates.
Wyoming Department of Health | Director’s Unit for Policy, Research, and Evaluation | February 2021 | Page 32For each month of the trajectory, we fill the required number of people by drawing from the top of
the “willingness to pay” list and “enrolling” them in Medicaid. This means that the people enrolling
in Month 1 will also be enrolled through Month 24. We do not attempt to model churn (people
losing eligibility), though this would likely be more realistic.
(4) At this point in the simulation, we have a list of Medicaid member-months, with individual
demographic characteristics for all the people enrolled. Now we use the Medicaid claims data
model (Model 4) to estimate monthly health care costs by five different claim types - Inpatient,
Outpatient, Professional, Pharmacy and Dental.
Because of its structure, this model allows us to assume utilization across claim types are correlated
within individuals; for example, someone with a lot of inpatient services is also likely to have a lot of
professional medical claims.
These four steps show what happens inside one single iteration of the simulation.
Repeating the simulation for many iterations — all the while using different random draws from
each model — allows us to propagate uncertainty through to the final estimates. Due to time
restrictions, we ran 261 iterations of the simulation. This is adequate for the expected values and
intervals presented in this document, but obviously more would have been better. In future
iterations of this project, we need to explore more efficient simulation methods to increase the
number of iterations generated in a fixed period of time.
Once the simulations are complete, analysis is relatively straightforward: we just ask questions of the
results. How many men versus women? How many 45-50 year olds are uninsured? And so forth.
The expectation (mean) of all iterations gives us the central estimate, and the remaining uncertainty
in the results can be quantified by the uncertainty intervals you see throughout this document.
Wyoming Department of Health | Director’s Unit for Policy, Research, and Evaluation | February 2021 | Page 33You can also read