May 2021 - cloudfront.net
←
→
Page content transcription
If your browser does not render page correctly, please read the page content below
May 2021
Forward-Looking Statements

Statements in this presentation that are not historical are considered “forward-looking
statements” and are subject to change based on various factors and uncertainties that may
cause actual results to differ significantly from expectations. Those factors are contained in
Enerpac Tool Group’s Securities and Exchange Commission filings.
All estimates of future performance are as of March 24, 2021. Enerpac Tool Group’s inclusion
of these estimates or targets in the presentation is not an update, confirmation, affirmation or
disavowal of the estimates or targets.
In this presentation certain non-GAAP financial measures may be used. Please see the
supplemental financial schedules at the end of this presentation or accompanying the Q2
Fiscal 2021 earnings press release for a reconciliation to the appropriate GAAP measure.

 2

A Global Leader in Industrial Tools and Services

                                                                                                         Global leader in high
110               Menomonee
                  Falls, WI
                                       ~2,300                    100+                  100+              precision tools, controlled
YEARS OF
                  HEADQUARTERS
                                       EMPLOYEES                 MANAGEMENT TEAM       # OF COUNTRIES    force products and
                                                                                                         solutions for precise heavy
HISTORY                                                          YEARS EXPERIENCE      PRODUCTS SOLD
                                                                                       INTO
                                                                                                         lifting.

    Products                   Service and             Extensive Global             Diversified
                               Rental                  Distribution                 Customer Base
    Cylinders/Jacks,
    Pumps, Bolting tools,      Bolting,                1,500+ long-standing         Specialty Dealers
    Presses, Pullers,          machining and           distribution relationships
    Tools, Heavy Lifting       joint integrity                                      National
    Technology                                         3,500+ distributor           Distribution
                                                       locations
                                                                                    Large OEMs

    STRONG
    BRAND                   Premium Industrial Tools         Service                  Medical
    RECOGNITION             Heavy Lifting                    Rental                   Industrial Ropes
                                                             Training

3
Positioned to Deliver Long-Term Value

    Sustainable business model
    built on well recognized brands, robust global
    distribution and broad reach of end markets

    Clear strategy
    to drive core growth above market and expand     BEST IN
    margins
                                                     CLASS
                                                     RETURNS
    Disciplined capital deployment
    powered by strong balance sheet and free cash
    flow conversion

    Experienced leadership team
    capable of executing to win

4
Delivering Profitable Growth

NET SALES                                                                 ADJUSTED OPERATING PROFIT
 $660                                                  $655               $100
                                                                                                                                 $78
 $650                              $641                                    $80                               $65
 $640
                                                                           $60
 $630                                                                                    $43
               $617
 $620                                                                      $40
 $610                                                                      $20
 $600
 $590                                                                      $-
              2017                2018                2019                              2017                2018                 2019

ADJUSTED EBITDA MARGIN                                                    RETURN ON INVESTED CAPITAL
 16%                                                  15%                   16%
                                                                                                                                  14%
 14%                              13%                                       14%
 12%                                                                        12%                               11%
              10%
 10%                                                                        10%
                                                                                          8%
     8%                                                                         8%
     6%                                                                         6%
     4%                                                                         4%
     2%                                                                         2%
     0%                                                                         0%
              2017                2018                2019                               2017                 2018                2019

 5        Note: Fiscal 2020 is not included above as results are not representative of the business due to impact of COVID-19. We anticipate to
          return to normal growth patterns post COVID.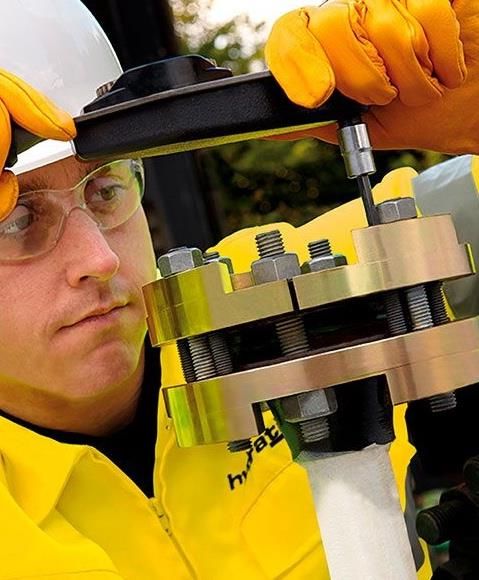
Macro Industry Dynamics Support Growth

       Growth in Alternative Energy                                 Increasing Product Complexity

Products and services span multiple alternative markets        Products are high precision matched to the increasing
including nuclear, wind, oil & gas                             standards and tolerances.
Mission critical tools are required for difficult conditions   The right tool makes all the difference when precision
                                                               and safety are of the highest importance

            Infrastructure Demand                                           Growth in Aerospace

Heavy lifting technology provides reliable solutions to        Tools are used throughout the Aerospace industry for
match challenging infrastructure demands                       the building and on-going maintenance and repair of jet
                                                               engines with greatest opportunity in military applications
Aging infrastructure demands products to safely build
and repair infrastructure across the globe                     Highest reliability and precision in critical functions

6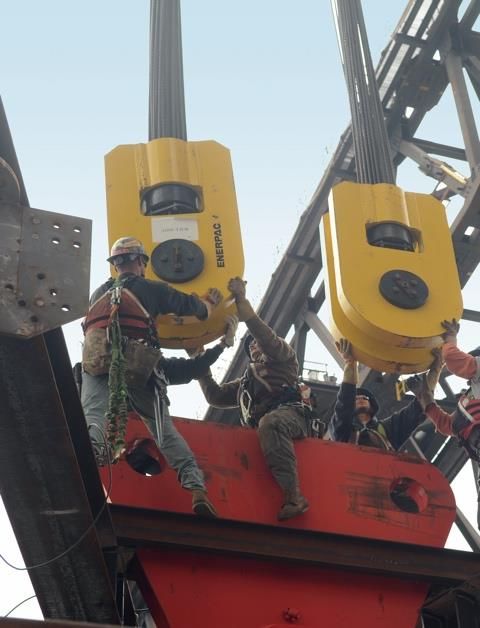
Broad Global End Markets

    13 VERTICAL END MARKETS

    Civil Construction   Power Gen        Diverse verticals provide
                         & Utility        reduced cyclicality and
                         Off-Hwy          increased predictability
    Oil & Gas
                         Vehicle Repair

    Industrial MRO       On Hwy
                         Vehicle Repair
    Manufacturing
    and Machine          Paper/Wood
    Tools
                         Military
    Mining

                         Steel & Metal
    Aerospace

    Rescue

7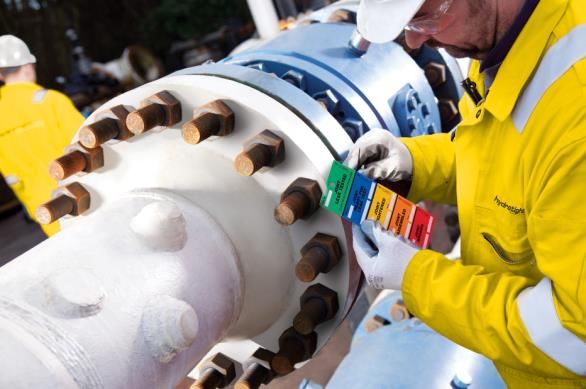
Wide Array of Products

                                                       Heavy Lift
            Bolting              Cylinders                             Presses

    Pumps             Work Holding           Pullers       Spreaders     Cutters

8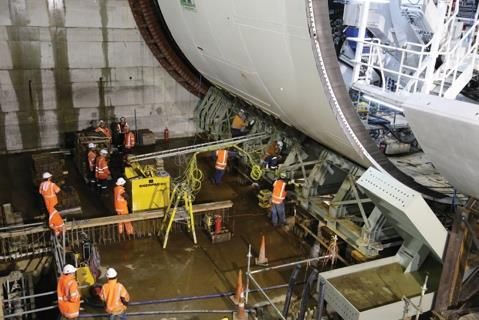
Hydratight Service
•   Primary focus on repairs and maintenance work versus CAPEX projects
      •    MRO is less cyclical, less prone to cancellation due to market factors (oil
           pricing, weather, geopolitical disruptions)
•   Primarily mid to down stream oil & gas exposure - trillions of dollars of installed
    assets need to be maintained
•   Verticals include oil & gas – with significant growth in additional markets including
    power generation, wind, plant and infrastructure, military
•   Leveraging our core competencies to win higher value work including:
       •   Flange joint integrity and related software
       •   Specialty Machining and Inspection
       •   Project Management and Auditing
       •   Technical Training and Certification
•   Service provides vehicle to sell Enerpac products and rentals

9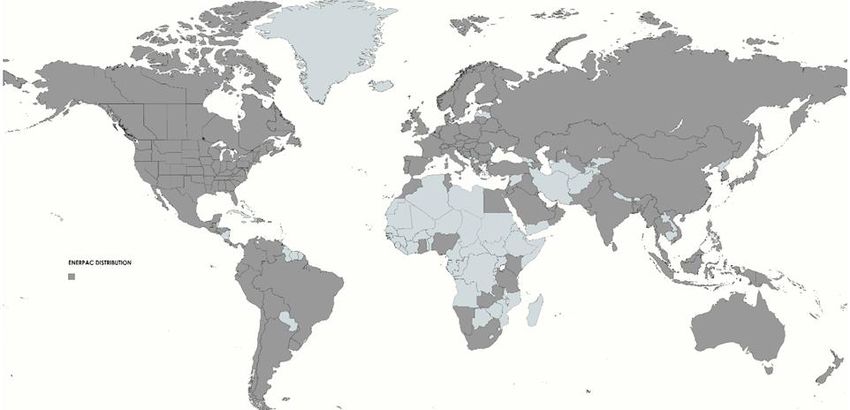
Serving a Wide Variety of Geographic Regions

Enerpac Tools and Services
benefit from having a diverse
geographic customer base
                                                          37%
                                                                                      Geographic
                                                                      United States
                 Australia                                                            diversification of sales
                                                                                      reduces overall
                                     4%
        Mexico/Canada                                                                 exposure to regional
                                4%                                                    economic downturns
        South America                            Sales of
                                                $493m in
                                4%

                                4%             Fiscal 2020
                 Other

                                     11%                        24%

                         Asia                                            Europe
                                                    12%

                                      Middle East

10
Extensive Global Footprint
Our Global Footprint Allows
Us To Better Serve Our
Customers and Shareholders
• Producing near our
customers leads to a
quicker response time
• Understanding local
market needs and demand
• Some projects require in-
country production
• Low cost country
manufacturing/sourcing
drives competitive margins
Corporate Headquarters Manufacturing Locations Enerpac Tool Center Service Center and/or
Sales Office
11Extensive Global Distribution
Global Distribution Network
is a competitive advantage
• Most robust distribution
network in the
1500+ 3500+ 100+ competitive space
distributors points of sale countries • Application experts with
hands-on product
demonstrations
• Local access to world-
class tools quickly and
conveniently
• Buy or rent the right tools
when & where you need
them
• Ability to support Global
customers
in all regions
12Clear Value Creation Model – Long Term Vision
CORE GROWTH ABOVE MARKET DRIVING EFFICIENCY AND PROFITABILITY
~5% CORE GROWTH CAGR OR ~25% EBITDA MARGINS
200-300bps CORE SALES GROWTH > MARKET ▪ Incremental margin ▪ Completion of service &
expansion product line restructuring
▪ Product innovation ▪ Commercial effectiveness exits
& share capture ▪ Optimized manufacturing
▪ Expand industries and footprint ▪ Strategic sourcing
regions ▪ Incremental growth
through strategic M&A ▪ Structural cost reduction ▪ Proprietary products
STRONG CASH FLOW GENERATION BEST-IN-CLASS RETURNS AND DISCIPLINED
CAPITAL DEPLOYMENT
+100% FCF CONVERSION = FUEL FOR GROWTH
~20% RETURN ON INVESTED CAPITAL
▪ Margin expansion ▪ Drive working capital ▪ Organic growth: products, ▪ Debt reduction; maintain
velocity services & people strong balance sheet
▪ Low capital intensity
(Capex ~2% of sales) ▪ Strategic acquisitions ▪ Leverage target of
1.5x – 2.5x
▪ Opportunistic share
repurchases
13 The timeline to achieve these goals will be re-established as soon as practicable once the market has appropriately recoveredAchieving EBITDA Margin Expansion with Market Recovery
Cost Structure Progression Market Recovery Drives Incremental Profitability
Incremental Profit EBITDA ~25%
on Growth
Incremental Profit on
▪ Based on structural
20% EBITDA Margins Revenue Growth
Growth actions taken and when
markets return to
Strategic Vision
Return to Pre- ▪ Incremental margin growth, positioned to
Footprint Optimization generate EBITDA
COVID Levels expansion on
Structural Incremental Profit margins of 25% or
product sales
Cost Reduction $5M on Growth better.
▪ $575M - $600M ▪ Focus on value
of core sales added service and
$13M ✓ Cortland plant
~$5M rental
consolidation
▪ Growth from market
✓ Eliminate EC&S ▪ Enerpac plant
~$5M and NPD
$15M stranded costs ~$3M optimization
✓ Redundancy in segment
✓ Enerpac/Hydratight vs corporate costs
✓ Reduced third party ~$10M
Consolidation
support costs
Removed $33M of Structural Costs From the Business Timing Impacted by COVID-19
Structural Cost Reductions Expected to Drive Stronger Incremental Margins on Future Growth
14Return on Invested Capital - Deploying Capital to Create
Long-Term Sustainable Returns
Goal of enhancing
Enerpac’s position as a
premier industrial tools and
services company and its
commitment to sustainable
Invest in Ourselves to Disciplined M&A within shareholder value creation
Drive Organic Growth Tool Space
Reduce Debt and Maintain Opportunistic Share
a Strong Balance Sheet Buybacks
15Driving Organic Growth: New Product Development
NEW PRODUCT DEVELOPMENT NEW PRODUCT SALES NEW PRODUCT VITALITY
▪ Focusing on innovation through Centers
of Excellence (CoE) and Vertical Market FY15 FY19 FY20 FY21+
teams 3.5% 7% 11% 10+%
▪ Bringing new products to market faster
▪ Improving utilization of resources
between CoE’s, supply chain and regions Investment in NPD which began in FY’16
to drive launch execution has driven acceleration in new products as a
percent of sales
FY15 FY16 FY17 FY18 FY19 FY20 FY21 FY22 FY23
E-Pulse Hydraulic Pump New Self Locking Cube XC-Torque Wrench Pump Clamshell Cutters RSL Torque Wrench Lock-Grip Pullers
Jack
16Driving Organic Growth: Commercial Effectiveness
CHANNEL DEVELOPMENT COVERAGE
▪ Partnership with Program Distributors and National ▪ Increasing distributor support from field-based
Accounts Product and Market specialist teams
▪ Selectively expanding network of value-added ▪ Expanding key / national account coverage
distributors targeting key vertical markets leveraging Enerpac and Hydratight relationships
▪ Strengthening distributor relationship via expanded ▪ Sales and Marketing aligned to leverage our strong
product offerings and technical support brand, drive demand, generate leads and sell more
products
EXPANDED NETWORK OF VALUE ENERPAC TOOL CENTERS
ADDED DISTRIBUTORS
▪ Opened pilot ENERPAC Tool Center with launch in
▪ Enhancing distributor capabilities and coverage Deer Park, TX
▪ Expanding Enerpac Tool Center capability- Product
Sales, Rental, Service, Calibration, Training, Product
Demos
▪ Enhances distribution coverage
▪ Drives additional rental of Enerpac tools
17Driving Operational Excellence
Philosophy of continuous
improvement
Opportunity to Manufacturing Excellence
Drive Profitability
▪ Facilities/locations
• Enhancing EBITDA growth
through operational ▪ Employing lean techniques and
improvements continuous operational
improvements/SQDC
▪ Optimized manufacturing,
service and distribution
Value Added Service Strategic Sourcing &
▪ Focus on value-add Supply Chain
service – joint integrity, ▪ Proven competency of
custom machining, leveraging global supply
bolting chain
▪ Eliminating commodity ▪ Sales & operations
service creates profit planning (S&OP)
improvement
18Incremental Growth - Disciplined M&A Strategy
Investing in strategic
acquisitions through a
disciplined process to
capture new growth
opportunities
DISCIPLINED DRIVING GROWTH STRONG
STRATEGY THROUGH M&A BALANCE SHEET
▪ Targeting bolt-on and ▪ Goal is to become larger, ▪ Will maintain strong
strategic acquisitions of more meaningful provider financial position
small to mid-sized
companies ▪ Any acquisition must ▪ Current liquidity gives us
support the extension of ample capacity between
▪ Any target must meet product lines and/or provide our cash on hand,
our financial and technology, which gives existing credit facilities
operational criteria Enerpac a competitive and access to debt
advantage markets
▪ Margins in line with
Enerpac line average
19Significant Market Opportunity
Enerpac Today* Tool Industry Market*
Strong Market Position in Key Segments Targeting Growth in High Margin Segments
Heavy Industrial
Heavy Industrial
Sales: $3B
Consumer
Margins: 50%+
Sales: $35B
Light Industrial $70B Tool Margins: 40%
Sales: $6B Industry
Light Industrial Margins: 45%+
Vehicle Repair Commercial
Sales: $12B Sales: $15B
Margins: 45%
Margins: 45%+
*Based on management estimates
20Tools Industry — Consumer to Heavy Industrial 21 * Based on management estimates
Tools Industry – Consumer to Heavy Industrial

  22
People & Culture

                                                 OUR VALUES
OUR VISION
                                                 ▪ We put safety and integrity first
Is to be our customers’ preferred partner
                                                 ▪ We focus on our customers
through relentless innovation of industrial
tools and services that help them safely and     ▪ We work collaboratively
reliably tackle their toughest jobs around the
                                                 ▪ We deliver on our commitments
world.
                                                 ▪ We support our employees and
                                                   communities

OUR PEOPLE                                        DIVERSITY, EQUITY & INCLUSION
                                                  Focused on building an accepting and welcoming
Our talented teams across the globe are           culture where all ethnicities, genders, points of view
our most valuable asset. We recognize             and backgrounds feel a sense of belonging.
their hard work and dedication to make
Enerpac Tool Group what it is today. We           Dedicated to creating an environment that allows for
are focused on employee development and           open communication about diversity and inclusion.
retention of our talent.
                                                  Launched Women’s initiative to support
  23                                              development and success of diverse talent.
Commitment to ESG and Sustainability
SAFETY COMMUNITY OUTREACH SUSTAINABILITY
Safety is our #1 priority. We strive to improve the quality of life and Our company promotes awareness about
enhance the vitality of the communities in protecting the environment, and considers
We are committed to the safety, security
which we operate throughout the world. environmental criteria when evaluating
and health of our people along with the
projects, products, processes and
safety and protection of the facilities and We encourage our employees to volunteer
purchases.
communities in which we operate. their time and talent on behalf of the
company and provide paid time off for We encourage technologies that do not
Safety is deeply embedded in Enerpac’s
team-related, sanctioned events. pollute and employ processes and
culture and is fully embraced by all
product designs that minimize waste.
leaders in our organization. We strive to Our “Give Where You Live” program
achieve the highest health, safety, supports local organizations both Recently added Sustainability section to
security, environmental, and quality financially and through employee volunteer enerpactoolgroup.com highlighting our
standards for our products, services and efforts. sustainability efforts.
solutions. We are committed to
achieving the Goal of Zero harm to
employees, customers and end users of
our products.
24Appendix
Fiscal 2021 Second Quarter – Executing on Key Priorities

     Employee Safety Remains #1 Concern
     ▪ Plants continue to operate with appropriate safety measures in place
     ▪ Travel to customer/project sites varies by region but consistently finding ways to promote Enerpac products
     Financial Highlights
     ▪ Did not experience typical top line seasonal declines
     ▪ Decremental margins in line with expectations

     Remain Focused on Long-Term Strategy
     ▪ NPD continues to deliver results
     ▪ Capital allocation priorities remain unchanged
     ▪ Balance sheet remains strong; paid down $45 million of debt
     Diversity, Equity & Inclusion
     ▪ Employee Development: Recruit, Develop & Retain
     ▪ Regional Diversity Councils
     ▪ Women of Enerpac
26
Market Update
Product Net Sales
▪ Order rates continued to improve during the quarter, with IT&S product core sales declines improving
sequentially to 10% in Q2 from 14% in Q1
▪ As we proceed toward year-over-year growth, our focus shifts to reviewing our business in pressure waves
rather than weekly order rates
▪ The pressure wave shows that in Q3 we expect to be at the low end of the 5-year range (pre-COVID) and in Q4
be squarely back in range
IT&S Consolidated Product Net Sales* The pressure
(pre-COVID)
wave to the left
shows the peaks
and valleys of the
five-year sales
range and the
overall cyclicality
of our business
27
*incl acquisitions from date of purchase and excluding strategic exitsSecond Quarter 2021 Summary
Financials
▪ Sales: $121M
▪ Core sales decline of 11% (Product down 11% and Service down 12%)
▪ Adjusted EBITDA decremental margins of 29%, excluding the impact of currency
(better than our target range of 35-45%) driven by mix and additional SAE costs
▪ Adjusted Diluted EPS: $0.06
▪ Temporary cost actions provided ~ $1M in benefit in the quarter
▪ Free Cash Flow: $1M of cash generated compared to $9M usage in the
comparable prior year period
▪ Paid down $45 million of debt, leverage at 2.1x
IT&S Regional Core Sales
▪ Asia Pacific decline: LSD
▪ Europe decline: MSD
▪ Middle East decline: LDD
28 ▪ Americas decline: LDDRegional/Vertical Markets
Americas / Europe
▪ Continued sequential improvement in the Americas; Europe consistent with
expectations
▪ US impacted by weather in Texas
▪ Key Verticals
▪ Positive trends continue in Power Generation (Wind/Nuclear) and Construction
▪ Infrastructure in Europe is particularly strong
▪ Mining activity strong in Western Canada and Latin America
▪ Distribution
▪ Sentiment is favorable for the back half of the fiscal year
▪ Uptick in customer / distributor site visits, but access remains limited
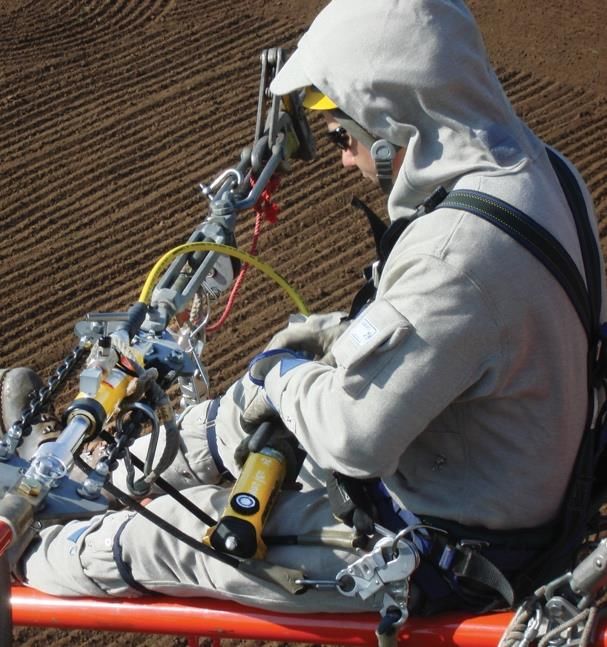
▪ Additional stocking activity in the quarter Supplying heavy cylinders,
pumps and controls, this project
Asia Pacific shows our strong capabilities
with unique customer solutions
▪ China remains stable, Australia & New Zealand are showing signs of improvement to challenging problems.
while Southeast Asia is a bit slower to recover due to continued COVID restrictions
▪ Key Verticals
▪ Mining continues to remain strong in the region driven by global demand for iron ore
▪ Starting to see increased oil & gas activity in Australia
29 ▪ Continue to see positive trends and wins in Power Generation, especially wind energyRegional/Vertical Markets and Operations
Middle East/North Africa/Caspian (MENAC)
▪ MENAC region pressured with renewed COVID-19 related border lockdowns
▪ Planned maintenance projects scheduled to begin in Q2 were pushed out
▪ Key Verticals
▪ Solid progress toward expansion beyond oil & gas
▪ Power Generation product and service work in the quarter
▪ Other vertical opportunities include: Construction, Rail and Aero
Operations
▪ Safety, Quality and On-Time Delivery were all positives
▪ Utilization improved as the quarter progressed
▪ Scaling our operations and supply chain for growth in the back half of the year
▪ Managing logistics challenges and commodity price increases
30Second Quarter 2021 Comparable Results
(US$ in millions except EPS)
NET SALES*
$133 12.0% 12.2% • Core sales decreased 11% - product -11% and service -12%
$119 $121 9.5% • IT&S product sales -10%
• Continue to be impacted by COVID-19 pandemic
• Rate of decrease improved from -14% in Q1
• Other product -21%
• New Product Development (NPD) – 2 new products families launched
• NPD % of product sales ~10%
Q2 2020 Q1 2021 Q2 2021 Q2 2020 Q1 2021 Q2 2021 • HTL acquisition ~ $3M
Net Sales* Adjusted EBITDA %* • Favorable impact of FX ~$3M
$0.09 $0.09
ADJUSTED EBITDA*
7.4% 7.9% • Decremental margins of ~29%, excluding the impact of currency
5.6% $0.06
ADJUSTED OPERATING PROFIT*
• Year-over-year decline due to significantly reduced product
volume partially offset by restructuring and other cost savings
initiatives
Q2 2020 Q1 2021 Q2 2021 Q2 2020 Q1 2021 Q2 2021
ADJUSTED DILUTED EPS*
Adjusted Operating Profit %* Adjusted Diluted EPS* • Year-over-year adjusted operating profit decline was partially
offset by interest savings
*Adjusted Operating Margin, EBITDA Margin and EPS excludes • Adjusted tax rate for the quarter ~16%
restructuring, impairment and other charges identified in the accompanying
reconciliations to GAAP measures. In addition, see reconciliation of net
31 sales to core sales in the appendix.Net Sales Waterfall*
(US$ in millions)
$140
$135 $2.9
$11.2 The impact of the
COVID-19 pandemic
$133.4 (including border
$130
closings in the MENAC
region) resulted in lower
sales year-over-year
$125 offset by a $3M benefit
$4.4 from foreign currency
We are encouraged by
$120
the level of activity that
$120.7
we are beginning to see
as our primary markets
$115 recover
$110
Q2 FY20 Fx Translation Volume -Product Volume- Service Q2 FY21
32
* See the reconciliation of net sales to core sales in the appendix.Adjusted EBITDA Waterfall*
(US$ in millions)
$20
Adjusted EBITDA
decreased year-over-
$18
$3.4 $7.3 year primarily due to
COVID-19 product
$16 $0.0 volume decreases,
$16.0 partially offset by
$14 restructuring and other
cost savings initiatives
$12 $2.9 $1.7 resulting in decremental
$0.7
$1.1 EBITDA margins of
$10 $11.5 29%, excluding the
12.3% 13.3% impact of currency,
$8 better than our target
range of 35-45%
$6
Commodity price
$4
pressure in steel,
aluminum and freight to
be passed through via
$2
upcoming price
increases
$0
Q2 FY20 Fx Translation Restructuring Volume - Volume & Mix - Mfg Variances SG&A Other Q2 FY21
Savings Product Service
33
* Includes certain Non-GAAP financial measures. See the accompanying reconciliation tables for additional details.Liquidity – Positioned for Success
(US$ in millions)
$7 $163 $159
$286
$255
$1 $115 2.1
$210 1.9
Q2 2020 Q1 2021 Q2 2021 1.3
($9)
Q2 2020 Q1 2021 Q2 2021 Q2 2020 Q1 2021 Q2 2021 Q2 2020 Q1 2021 Q2 2021
Free Cash Flow Cash Balance Gross Debt TTM Financial Leverage*
Free Cash Flow (FCF) Debt & Leverage
• FCF generation of $8M in first half of fiscal year compared • Paid down $45 million of debt in Q2 of fiscal 2021
to $34 use of cash in the first half of the prior year • Remain well within target range of 1.5-2.5x
• First time in five years (FY 2016) generating FCF in the • Slight uptick in leverage was expected due to COVID
second quarter impacted quarters with lower EBITDA
• Proactively managing Receivables and Inventory
34 * Calculated in accordance with the terms of the Company’s March 2019 Senior Credit FacilityThoughts on Remainder of Fiscal 2021
▪ Anticipate that net sales will return to pre-COVID levels as we exit the fiscal year
▪ Expect incremental EBITDA margins on the high end of 35%-45%, excluding the impact of currency
▪ Continue to execute our strategy
▪ Continue to invest in long-term growth through new product development and commercial effectiveness
▪ Manage liquidity and maintain strong balance sheet
▪ Remain focused on cost management to deliver solid margins
Near-term Industrial Production Estimates (Annualized q/q %) * Sentiment has
shifted to growth
Calendar
Low High in coming
quarters but
Q1 21 -3.7% 5.9% variance remains
Q2 21 2.0%
17.5% as to how much
Q3 21 1.4% growth and how
11.2%
Q4 21 0.8% fast the recovery
12.7%
Q1 22 -0.6% will happen
10.3%
Q2 22 1.1%
7.8%
Despite continued economic uncertainty, barring any additional COVID related shutdowns, we anticipate
the top line returning to pre-COVID levels as we exit the fiscal year.
35 * Chart shows high and low estimates of industrial production from certain economists. Source: Bloomberg. Data used includes estimates updated on or after 12/11/2020.Expectations for Second Half of Fiscal 2021
Expectations for 2H of Fiscal 2021:
▪ Sales of $280 million to $290 million
▪ Continued sequential improvement through Q4
▪ Projected year-over-year core growth by category
▪ IT&S Product ~ mid 20% Barring any additional
COVID related
▪ IT&S Service ~ low to high 40% shutdowns/border
▪ Other ~ low 20% to low 30% closures, we are
projecting to deliver
▪ Incremental EBITDA margins on the high end of 35%-45% growth in the back half
excluding the impact of currency of the year, exiting the
fiscal year at pre-COVID
Fiscal 2021 Annual Modeling Assumptions: run rates
▪ Tax Rate: ~20%-25%
▪ Depreciation/Amortization: ~$20-$24 million
▪ Interest Expense: ~$5-$7 million
▪ Capital Expenditures: ~$10-$15 million
▪ Cash Taxes: ~$3-$5 million
▪ 100% Free Cash Flow conversion
▪ Key FX rates as of January 2021:
▪ $1.22/1€
36
▪ $1.34/1£You can also read