MARKET FORECASTS & STRATEGY - Aerospace ...
←
→
Page content transcription
If your browser does not render page correctly, please read the page content below
MARKET FORECASTS &
          STRATEGY

                FZO-CST-REP-0043

              Published March 2022
Aerospace Technology Institute – FlyZero - Market Forecasts & Exploitation Strategy                          FZO-CST-REP-0043

ABOUT FLYZERO
Led by the Aerospace Technology Institute and backed by the UK Government, FlyZero began
in early 2021 as an intensive research project investigating zero-carbon emission commercial
flight. This independent study has brought together experts from across the UK to assess the
design challenges, manufacturing demands, operational requirements and market opportunity
of potential zero-carbon emission aircraft concepts.

FlyZero has concluded that green liquid hydrogen is the most viable zero-carbon emission fuel
with the potential to scale to larger aircraft utilising fuel cell, gas turbine and hybrid systems. This
has guided the focus, conclusions and recommendations of the project.

This report forms part of a suite of FlyZero outputs which will help shape the future of global
aviation with the intention of gearing up the UK to stand at the forefront of sustainable flight in
design, manufacture, technology and skills for years to come.

To discover more and download the FlyZero reports, visit ati.org.uk

ACKNOWLEDGEMENTS
Lead authors                                    FlyZero would like to acknowledge the support and expertise provided by
                                                the following individuals or organisations noting the conclusions shared
James Cole                                      in this report are those of the FlyZero project: Avalon Consultancy Services,
Strategy Manager                                University of Bath, University of Nottingham, NPL, Qdot Technology, Reaction
                                                Engines, University of Strathclyde and TWI.
William McClintock
Strategy Manager                                FlyZero contributing companies: Airbus, Belcan, Capgemini, easyJet, Eaton,
                                                GE Aviation, GKN Aerospace, High Value Manufacturing Catapult (MTC), Mott
Laura Powis                                     MacDonald, NATS, Reaction Engines, Rolls-Royce, Spirit AeroSystems.
Strategy and Market Specialist

FlyZero was funded by the Department for Business, Energy and Industrial Strategy.

Front cover image © ATI
Copyright 2022 ATI. Parts of this document may be accurately copied, reproduced or redistributed only if unedited, unaltered
and clearly credited to the Aerospace Technology Institute and the document title specified. This excludes images for which
permissions from the copyright holder must be obtained. Aerospace Technology Institute registered in England and Wales
Company No. 08707779 with its registered office at Martell House, University Way, Cranfield MK43 0AL.
                                                                                                                            2
Aerospace Technology Institute – FlyZero - Market Forecasts & Exploitation Strategy   FZO-CST-REP-0043

CONTENTS
           EXECUTIVE SUMMARY                                                                      4
01.        MARKET FORECASTS                                                                      12
 01.1       DEMAND DRIVERS                                                                        12
 01.2       WORLD REGIONS                                                                         14
 01.3       ECONOMICS AND DEMOGRAPHICS                                                            17
  01.3.1      COVID-19 RECESSION AND RECOVERY                                                     17
  01.3.2      LONG-TERM ECONOMIC GROWTH                                                           18
 01.4       AIR TRAVEL COSTS AND EFFICIENCY                                                       21
 01.5       SHIFTS IN PASSENGER DEMAND                                                           24
  01.5.1		 JOURNEY PURPOSE AND RESILIENCE                                                        24
  01.5.2      SURFACE MODE COMPETITION                                                           26
 01.6       DEMAND FORECAST SUMMARY                                                              29
02.        FLEET FORECASTS                                                                       31
 02.1       MARKET SEGMENTS                                                                       31
 02.2       FUTURE FLEET FORECAST                                                                35
 02.3       BASELINE CO2 EMISSIONS FORECAST                                                      36
03.        MARKET OPPORTUNITY                                                                    37
 03.1       MARKET STRATEGY                                                                      37
 03.2       REGIONAL CONCEPT                                                                     39
 03.3       NARROWBODY CONCEPT                                                                    41
 03.4       MIDSIZE CONCEPT                                                                      44
04.        CONCEPT COMPETITIVENESS                                                              48
 04.1       COST COMPETITIVENESS                                                                 48
 04.2       REGIONAL CONCEPT COMPETITIVENESS                                                      51
 04.3       NARROWBODY CONCEPT COMPETITIVENESS                                                   52
 04.4       MIDSIZE CONCEPT COMPETITIVENESS                                                      53
 04.5       COMPETITIVENESS CONCLUSIONS                                                          54
05.        MARKET PENETRATION SCENARIOS                                                          55
 05.1       SCENARIO COMPARISONS                                                                 58
06.        REFERENCES                                                                            61
 06.1       LIST OF ABBREVIATIONS                                                                62
 06.2       TABLE OF FIGURES                                                                     63

                                                                                                     3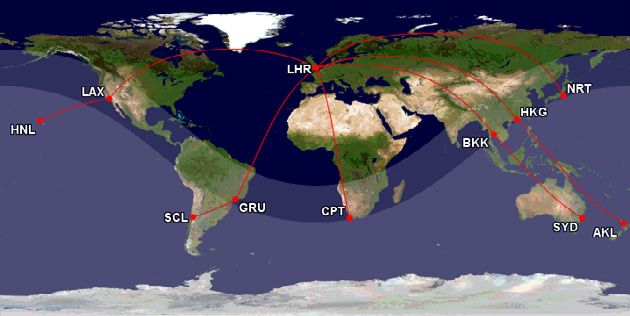
Aerospace Technology Institute – FlyZero - Market Forecasts & Exploitation Strategy      FZO-CST-REP-0043

EXECUTIVE SUMMARY
Market Forecasts
Air travel connects the world and enables affordable mass transportation between continents. It
allows people to re-unite with friends and families, experience new cultures, and do business globally.

The Covid-19 pandemic has had a profound impact on aviation since March 2020. It is the deepest
and most prolonged disruption to air travel in the post war era, but experience of previous crises
indicates that the need for air travel is resilient, and that passenger demand recovers.

This crisis may be different, however, and there are risks that dislocations caused by Covid-19
combined with growing concerns about climate change could have lasting effects, long after the
direct impacts of the pandemic have subsided:
    Has the pandemic nudged societies into different ways of working, requiring less business travel?

    Will the damage to the airline industry lead to loss of competition and more expensive air travel?

    Will pandemic restrictions lead to long-term impediments to international air travel, curtailing
    demand?

    Will environmental concerns and “flight shaming” reduce passenger demand?

    Will government climate change commitments lead to higher carbon pricing and policies to
    dampen aviation growth?

Under the FlyZero baseline forecasts, we expect passenger demand to recover in line with the
post-pandemic economic recovery by the mid-2020s. Traffic grows at an average rate of 3.2% per
annum to 2050, reaching 22.9 trillion revenue passenger kilometres (RPKs).

Figure 1 – FlyZero Global Forecast Scenarios (Source © FlyZero analysis)
                                                                                                         4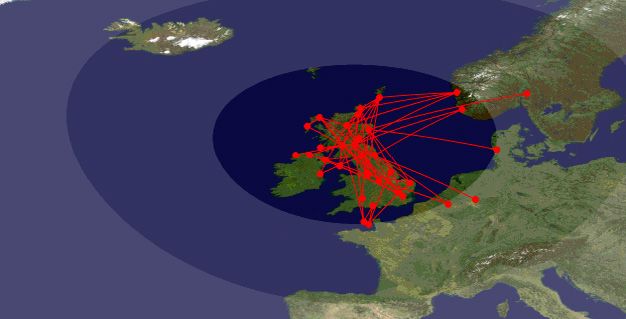
Aerospace Technology Institute – FlyZero - Market Forecasts & Exploitation Strategy                                    FZO-CST-REP-0043

Our conservative forecast scenario takes account of incomplete post-pandemic traffic recovery
due to shifts in passenger behaviour and increased surface mode competition. It is about 10%
lower than the baseline at 20.7 trillion RPKs in 2050. The conservative scenario lags the baseline
growth trajectory by about five years – the growth in demand still occurs, but in a later year.

Like all forms of mass transport, air travel is currently dependent on fossil fuels that emit greenhouse
gases. The aviation industry has made year-on-year investments in cleaner, more efficient aircraft
and driven operational efficiencies that have reduced per-passenger fuel consumption and carbon
emissions by 56% since 1990 [1]. Despite these efficiency improvements, strong traffic growth over
the past 30 years means that aviation’s CO2 emissions have doubled in absolute terms to 920 Mt in
2019 [2], and are equivalent to 2.5% of total global CO2 emissions [3].

If air travel is to continue to grow in a sustainable way, aviation must find innovative ways to truly
decarbonise and reduce its impacts on the environment. Without the development of zero carbon
emissions aircraft, aviation’s annual atmospheric CO2 emissions are projected to grow to 1,540 Mt
(+67%) by 2050, and to 1,850 Mt (+100%) by 2070 (see section 2.3).

Enabling the continued growth of aviation is a matter of global equity – around 75% of air passenger
growth over the next 30 years will be to, from or within developing countries [4]. Aviation supports
the economic development of poorer countries by enabling inward investment, promoting travel
and tourism [5] and facilitating migration and remittance incomes [6].

                                                              EUROPE                  RUSSIA & CENTRAL ASIA
                                                              GDP 1.2%                     GDP 2.2%
                                                              RPK 2.6%                      RPK 3.8%               NORTH EAST ASIA
                 NORTH AMERICA                                                                                        GDP 0.5%
                    GDP 1.9%                                                                                          RPK 2.1%
                    RPK 2.5%                                                            SOUTH ASIA
                                                                                                         CHINA
                                                                                         GDP 4.8.%
                                                                                         RPK 5.1%       GDP 3.3%
                                                                        MIDDLE EAST                     RPK 3.7%
                                                                         GDP 2.0%
                                                                         RPK 3.9%
                                                              AFRICA                                          SOUTH EAST ASIA
                                                             GDP 2.9%                                            GDP 3.5%
                                                             RPK 3.8%                                            RPK 4.2%

                                     LATAM
                                    GDP 1.6%
                                    RPK 3.2%
      WORLD                                                                                                            OCEANA
      GDP 2.3%                                                                                                         GDP 2.1%
      RPK 3.2%                                                                                                         RPK 3.0%

Figure 2 – FlyZero Global Forecast Summary: Average annual growth rates (Source © FlyZero analysis; baseline demand)

                                                                                                                                      5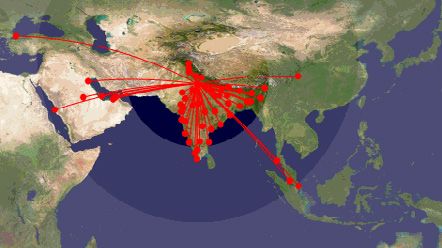
Aerospace Technology Institute – FlyZero - Market Forecasts & Exploitation Strategy                             FZO-CST-REP-0043

Fleet Forecasts
The FlyZero Global Fleet Forecast model translates projections of passenger demand into future
fleet requirements by market segment. The market segments are defined based on a combination
of aircraft size and sector distance, as shown in the table below:

 Category                               Description                                    Typical Examples
                                                                                          Cessna Caravan, Beach 1900,
 Subregional                                         9 - 19 seat turboprops
                                                                                        DeHavilland Twin Otter, Dornier 228

 Regional                                20 - 120 seat turboprops or regional jets            ATR, Dash 8, CRJ, E170/190

                                         120 - 220 seat narrowbody aircraft, up to
 Narrowbody                                                                                       A220, A320, B737
                                                 2,400 nmi sector distance
                                            Narrowbody aircraft over 2,400 nmi
                                                        sector;
 Midsize                                                                                      A321XLR, B757, B767, A330
                                        200-300 seat widebody aircraft, less than
                                               5,250 nmi sector distance
                                          Over 300 seats or over 5,250 nmi sector
 Widebody                                                                                         A350, B787, B777
                                                         distance

Table 1 – Aircraft Market Segments.

As aviation recovers from the current downturn, growing passenger demand will drive the need
for more aircraft globally. The in-service fleet is expected to more than double from its 2019 pre-
pandemic level of 29,900 aircraft to 69,090 aircraft by 2050, an average growth rate of 2.7% per year.
The demand for new aircraft to fund fleet growth and replace retiring aircraft averages about 2,600
aircraft per year during the 2030s, rising to 3,000 aircraft per year in the 2040s.

Fleet Forecast                                                            Delivery Forecast

Figure 3 – FlyZero Global Fleet Forecasts (Source © FlyZero analysis; baseline demand scenario. * Freighter deliveries
include conversions of passenger aircraft.)

                                                                                                                               6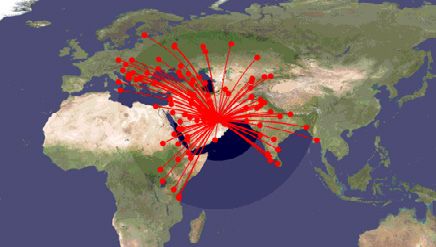
Aerospace Technology Institute – FlyZero - Market Forecasts & Exploitation Strategy                                    FZO-CST-REP-0043

Market Opportunity
FlyZero’s objective is to identify ways to decarbonise aviation through the development of true
zero carbon emissions (ZE) aircraft by the early 2030s. The FlyZero aircraft concepts are intended to
demonstrate the technical feasibility and commercial viability of ZE aircraft in each market segment.

Each FlyZero concept represents an archetype of a class of aircraft, with scope to stretch or shrink
around this concept design point, in the same way that the A320 can be considered representative
of the narrowbody class of aircraft.

The figures below summarise the overall aircraft market opportunity between 2030 – 2050 by
segment. The narrowbody segment is the most commercially important aircraft market, and a ZE
narrowbody aircraft would deliver the greatest atmospheric CO2 emissions abatement. However,
the commercial importance of this segment means that introducing novel ZE hydrogen technology
into the narrowbody market first is a high risk strategy for both aircraft manufacturers and airlines.

The FlyZero market strategy seeks to mitigate these risks by introducing a ZE aircraft first into either
the regional or midsize markets, as a pathway to develop and prove ZE technologies before the
development of a ZE narrowbody aircraft. These are the Midsize First or Regional First strategies.

                                                                   $10 - 15bn     $100 - 140bn
                                                                       0.5%         3.5%                         0%         4%

                9%      8%
                                10%                        $800 - 900bn                                      23%
         11%                                                 23%
                                                                             TOTAL                                  CO2
                                                                            MARKET
                DELIVERIES                                                                                       EMISSIONS
                (2030-2050)                                                  VALUE
                                                                          (2030-2050)
                                                                                                                   (2050)
                    56,000                                                               $1,800 - 2000bn
                                                                                                                 1,540 Mt        52%
                                                                           $3.6tn
                                                        $700 - 800bn                        53%            21%
                                                          20%
                    62%

   KEY

         REGIONAL
                              SUBREGIONAL
         NARROWBODY
                              MIDSIZE
         WIDEBODY

Figure 4 – Market Opportunities – 2030 to 2050 (Source © FlyZero analysis; baseline demand scenario ‒ Values in constant
2022 prices)

                                                                                                                                       7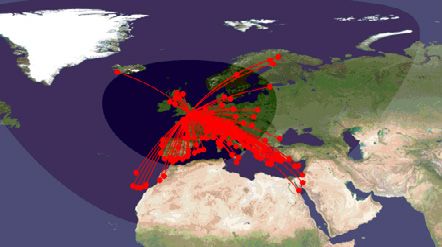
Aerospace Technology Institute – FlyZero - Market Forecasts & Exploitation Strategy                            FZO-CST-REP-0043

The commercial positioning of the FlyZero concepts can be summarised as:

    FlyZero Regional (FZR) – fast turboprop-equivalent hydrogen fuel cell aircraft, competitive with
    both conventional turboprop and regional jet aircraft.

    FlyZero Narrowbody (FZN) – targeted at the heart of the narrowbody aircraft market, matching
    the A320neo for passenger capacity and range with a full payload.

    FlyZero Midsize (FZM) – midsize aircraft offering zero carbon emission intercontinental flight
    with one stop global connectivity.

                                                                         800nmi
                                                                                       400nmi

 FZR-1 Regional

                                                                                                1000nmi

                                                                                      2400nmi

 FZN-1 Narrowbody

                                                                                                    4000nmi

                                                                                                     5250nmi

 FZM-1 Midsize

Figure 5 – FlyZero Concepts, maps generated by the Great Circle Mapper (www.gcmap.com) (copyright © Karl L. Swartz).)

                                                                                                                              8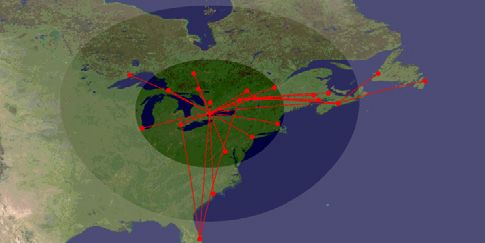
Aerospace Technology Institute – FlyZero - Market Forecasts & Exploitation Strategy                    FZO-CST-REP-0043

Concept Competitiveness
The commercial success and market penetration of future ZE aircraft is driven by their cost
competitiveness, measured against conventional kerosene or sustainable aviation fuel (SAF)
burning aircraft types.

The FZN and FZM concepts, with hydrogen combustion turbofan propulsion, are over 30%
more energy efficient than existing conventional aircraft. The light weight of the hydrogen fuel
contributes to the FZN and FZM concepts also having an energy advantage over newly designed
conventional aircraft – the FZN is 2% better than a new narrowbody aircraft (NNA) and the FZM is
5% better than a new midsize aircraft (NMA). The hydrogen advantage is greater for the longer
range FZM concept, where the weight benefit of hydrogen on block fuel energy is greater.

The FZR regional aircraft, with hydrogen fuel cell and electric motor / propeller propulsion, uses 7%
more energy than an ATR-72 reference aircraft. This extra energy is partly due to the FZR’s higher
performance – faster cruise speed and longer range. Compared with a new regional aircraft (NRA),
with comparable speed and range, the FZR is very slightly less energy efficient (+1%) due to the
FZR’s fuel cell mass and higher aircraft weight.

All ZE aircraft concepts have a direct operating cost (DOC) advantage over the conventional aircraft.
The DOC advantage arises from lower fuel costs – a combination of greater energy efficiency and
the expected lower cost of hydrogen per unit energy (when compared with taxed kerosene or SAF
blends) from the mid-2030s. However, the ZE aircraft are expected to have slightly higher aircraft
ownership and maintenance cost components.

Energy per ASK                                                            DOC per RPK

Figure 6 – FlyZero Concept Cost Competitiveness (Source © FlyZero analysis ‒ Reference aircraft are: ATR-72 (Regional),
A320neo (Narrowbody), B767-200 (Midsize); Baseline aircraft are hypothetical clean-sheet new aircraft designs
representing 2030s technology: NRA (new regional aircraft), NNA (new narrowbody aircraft), NMA (new midsize aircraft);
DOC per RPK comparisons are based on 2050 projected fuel costs.)

                                                                                                                      9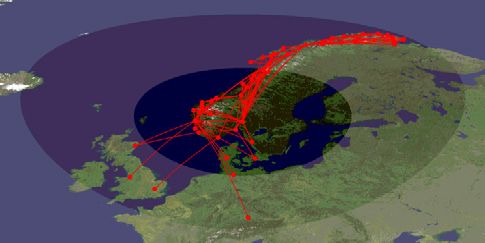
Aerospace Technology Institute – FlyZero - Market Forecasts & Exploitation Strategy      FZO-CST-REP-0043

Market Penetration Scenarios
The FlyZero market model examines four scenarios following the Midsize First or Regional First
strategies, with High Ambition or Unaccelerated entry into service dates. These scenarios are
described below.

Midsize First Strategy

Midsize First – High Ambition (Accelerated) scenario achieves the most rapid transition towards
ZE aircraft in service and abatement of CO2 emissions – with ZE aircraft making up 50% of the
global fleet and abating 45% of atmospheric CO2 emissions by 2050.

The Midsize First strategy minimises the early-years infrastructure challenges, as a relatively small
number of larger hub airports require hydrogen refuelling capability to provide a “minimum viable”
airline network for intercontinental flights.

The FlyZero commercial analysis indicates that a ZE midsize aircraft will enjoy a significant operating
cost advantage by the early 2030s. This cost advantage underpins the projected rate of ZE aircraft
uptake by airlines.

Another advantage of the Midsize First strategy is that the FZM aircraft has similar hydrogen
combustion turbofan technology to the FZN narrowbody concept, so the midsize aircraft more
effectively de-risks a ZE narrowbody aircraft development.

Regional First Strategy

Regional First – High Ambition (Accelerated) scenario achieves the second most rapid transition
towards ZE aircraft in service and abatement of CO2 emissions – with ZE aircraft making up 45% of
the global fleet and abating 31% of atmospheric CO2 emissions by 2050.

The Regional First scenarios are more complex in terms of early-years infrastructure challenges, as
many small regional airports will require hydrogen refuelling capability in order to provide airlines
with a minimum viable route network.

Another disadvantage of the Regional First strategy is that a ZE regional aircraft based on fuel
cell technology does not de-risk the development of hydrogen combustion turbofan aircraft
technology, which is necessary for the development of larger ZE narrowbody and midsize aircraft.
Regional aircraft only represent 4% of atmospheric CO2 emissions in 2050, so decarbonising the
narrowbody and longer-haul markets is necessary to achieve true zero carbon emission aviation.

The FlyZero commercial analysis (section 4) indicates that the FZR fuel cell aircraft has more
marginal operating cost benefits compared with conventional kerosene / SAF competitor aircraft
than the narrowbody and midsize designs. The relatively heavy fuel cell aircraft is not more energy
efficient than comparable conventional aircraft, so it is reliant on hydrogen fuel costs dropping
below kerosene / SAF prices (on a per unit energy basis) to have a competitive advantage. This
relative cost competitiveness means that government support and incentives may be required to
encourage airlines to switch to ZE regional aircraft in the early years, perhaps through government
subsidies provided on “public service obligation” routes.

                                                                                                        10
Aerospace Technology Institute – FlyZero - Market Forecasts & Exploitation Strategy FZO-CST-REP-0043
Comparisons between the different scenarios are provided in the table and figures below.
Midsize First Regional First
Number of ZE aircraft 29,200 Number of ZE aircraft 26,300
High Ambition
Value $2 trillion Value $1.5 trillion
(Accelerated)
CO2 Abated 45% CO2 Abated 31%
Number of ZE aircraft 16,600 Number of ZE aircraft 4,600
Unaccelerated Value $1.1 trillion Value $240 billion
CO2 Abated 24% CO2 Abated 5%
Table 2 – Market Penetration Scenario Comparison – 2050 (Source © FlyZero analysis ‒ Number of aircraft and values is
cumulative to 2050; CO2 abated is percent of the projected 2050 annual atmospheric emissions abated by ZE aircraftuse).
ZE Aircraft Share – % of aircraft in service Hydrogen Energy Share
SAF / Kerosene Demand (Mt) Annual CO2 Emissions Abated (Mt)
Figure 7 – Market Penetration Scenario Comparisons.
11Aerospace Technology Institute – FlyZero - Market Forecasts & Exploitation Strategy FZO-CST-REP-0043
01.
MARKET FORECASTS
01.1
DEMAND DRIVERS
Air travel connects the world and enables affordable mass transportation
between continents. It allows people to re-unite with friends and
families, experience new cultures, and do business globally.
The long-term trend is increasing passenger demand as incomes grow and air travel becomes
more affordable. As more people enter the global middle class, air travel becomes a higher priority
expenditure – currently half of the world’s population is considered “middle class” and this is
expected to grow to 67% by 2030 [7].
At the same time, the cost of air travel is decreasing due to airlines’ investment in new, more
efficient aircraft, the growth of low cost carriers (LCCs), and operational improvements such as
greater aircraft utilisation, higher passenger load factors and more efficient air traffic management.
Average airfares have decreased by more than 50% in real terms since 2008 (see Section 1.4,
Figure 16b).
Like all forms of mass transport, air travel is currently dependent on fossil fuels that emit greenhouse
gases. The aviation industry has made year-on-year investments in cleaner, more efficient aircraft
and driven operational efficiencies that have reduced per-passenger fuel consumption and carbon
emissions by 56% since 1990 [1]. Despite these efficiency improvements, strong traffic growth over
the past 30 years means that aviation’s CO2 emissions have doubled in absolute terms to 920 Mt in
2019 [2], and are equivalent to 2.5% of total global CO2 emissions [3].
If air travel is to continue to grow in a sustainable way, aviation must find innovative ways to truly
decarbonise and reduce its impacts on the environment. Without the development of zero carbon
emissions aircraft, aviation’s annual atmospheric CO2 emissions are projected to grow to 1,540 Mt
(+67%) by 2050, and to 1,850 Mt (+100%) by 2070 (see Section 2.3).
Enabling the continued growth of aviation is a matter of global equity – around 75% of air passenger
growth over the next 30 years will be to, from or within developing countries [4]. Aviation supports
the economic development of poorer countries by enabling inward investment, promoting travel
and tourism [5] and facilitating migration and remittance incomes [6].
12Aerospace Technology Institute – FlyZero - Market Forecasts & Exploitation Strategy FZO-CST-REP-0043
Pandemic Recovery
The Covid-19 pandemic has had a profound impact on aviation since March 2020. It is the deepest
and most prolonged disruption to air travel in the post war era, but experience of previous crises
indicates that the need for air travel is resilient, and that passenger demand recovers.
This crisis may be different, however, and there are risks that dislocations caused by Covid-19
combined with growing concerns about climate change could have lasting effects, long after the
direct impacts of the pandemic have subsided:
Has the pandemic nudged societies into different ways of working, requiring less business travel?
Will the damage to the airline industry lead to loss of competition and more expensive air travel?
Will pandemic restrictions lead to long-term impediments to international air travel, curtailing
demand?
Will environmental concerns and “flight shaming” reduce passenger demand?
Will government climate change commitments lead to higher carbon pricing and policies to
dampen aviation growth?
This study is concerned with long-term trends in air travel from 2030 onwards. Short-term
uncertainty and different paths to recovery over the next five years or so are less important. Our
forecasts focus on the econometric fundamentals that drive growth in air travel demand and on
the downside factors that need to be considered.
5.0
GULF WAR / RECESSION
ASIAN FINANCIAL CRISIS
9/11
IRAQ WAR AND SARS
GLOBAL FINANCIAL CRISIS
4.5
4.0
COVID-19
3.5
PASSENGERS (BILLIONS)
3.0
2.5
-60%
2.0
1.5
1.0
0.5
0.0
1985 1990 1995 2000 2005 2010 2015 2020
Figure 8 – World Air Travel Passengers (Source © FlyZero analysis ‒ Data from World Bank)
13Aerospace Technology Institute – FlyZero - Market Forecasts & Exploitation Strategy FZO-CST-REP-0043
01.2
WORLD REGIONS
The FlyZero global market forecast examines air travel flows within and
between twelve geographical world regions, as illustrated below:
EUROPE RUSSIA & CENTRAL ASIA
NORTH EAST ASIA
NORTH AMERICA
CHINA
MIDDLE EAST SOUTH ASIA
CENTRAL AMERICA
AFRICA SOUTH EAST ASIA
SOUTH AMERICA
OCEANA
Figure 9 – World Market Regions.
The largest flows are intra-regional within North America, Europe, and China. The busiest
intercontinental flows (between regions) are Europe – North America, Europe – Middle East, and
Oceana – Southeast Asia, as shown in Figure 10 below.
Global traffic growth, measured in revenue passenger kilometres (RPKs), averaged 6.1% per annum
during the last decade (2009 -2019), almost twice the rate of growth in world gross domestic product
(GDP) at 3.1% per annum. The fastest growing regions were China (+10.7% pa), South Asia (+8.9%
pa), Russia & Central Asia (+8.8% pa), the Middle East (+8.8% pa), and Southeast Asia (8.5% pa).
14Aerospace Technology Institute – FlyZero - Market Forecasts & Exploitation Strategy FZO-CST-REP-0043
REST OF
WORLD
OCEANIA
SOUTH-EAST
ASIA NORTH AMERICA
NORTH-EAST
ASIA
CENTRAL
AMERICA
CHINA
SOUTH
AMERICA
SOUTH ASIA
RUSSIA &
CENTRAL ASIA
EUROPE
MIDDLE EAST
AFRICA
Figure 10 – Air Traffic Flows Between World Regions (source © FlyZero analysis; 2019 flow share by Revenue Passenger
Kilometres, MIDT data)
FlyZero has developed econometric forecasts for 41 market pairs (including the within-region
markets). These 41 market pairs represent 97% of global traffic – the remaining flows are
modelled in aggregate as a ‘Rest of the World’ market.
The econometric regression model has high correlation coefficients (R-squared values)
between the explanatory variable (GDP) and dependent variable (RPKs). Most of the markets,
accounting for 92% of total traffic, have very high correlation coefficients of at least 0.9, and all
market flows have an R-squared value over 0.8. This indicates that the market model provides
a sound basis for future projections.
15Aerospace Technology Institute – FlyZero - Market Forecasts & Exploitation Strategy FZO-CST-REP-0043
IA
AS
AL
A
SIA
SIA
RIC
A
ICA
TR
RIC
TA
TA
EN
ME
ST
ER
ME
SIA
AS
AS
EA
&C
A
AM
HE
HA
AL
HE
PE
NA
HA
LE
A
IA
TH
A
RIC
R
RO
DD
RT
EA
SS
UT
UT
IN
NT
UT
OR
RU
NO
AF
EU
OC
SO
CH
SO
MI
SO
CE
N
4.0
6.0
3.0
5.0
7.4
2.2
7.2
7.3
7.5
1.0
2.1
7.1
1.0 NORTH AMERICA 97% 99% 95% 98% 94% 98% 93% 97%
2.1 CENTRAL AMERICA 97% 97% 93%
2.2 SOUTH AMERICA 83% 92%
3.0 EUROPE 99% 82% 98% 89% 95% 94% 85% 93%
4.0 AFRICA 95% 99%
5.0 MIDDLE EAST 92% 90% 99% 98% 99% 97%
6.0 RUSSIA & CENTRAL ASIA 91%
7.1 SOUTH ASIA 95% 98%
7.2 CHINA 99% 95% 97% 94%
7.3 NORTH EAST ASIA 87% 97%
7.4 SOUTH EAST ASIA 98% 98%
7.5 OCEANA 96%
Figure 11 – Traffic Flow Regression Matrix (Source © FlyZero analysis; baseline demand scenario. Percentage values are
the market flow regression correlation coefficients (R-squared values)
16Aerospace Technology Institute – FlyZero - Market Forecasts & Exploitation Strategy FZO-CST-REP-0043
01.3
ECONOMICS AND DEMOGRAPHICS
01.3.1
COVID-19 RECESSION AND RECOVERY
The Covid-19 pandemic resulted in a sharp contraction of the world’s
economies in 2020 due to widespread lockdowns and travel restrictions
as governments attempted to control the spread of the virus.
Figure 12 shows global GDP forecasts and how they have evolved during the pandemic.
Initial expectations of the International Monetary Fund (IMF) in October 2020 were for a deep
recession with prolonged recovery [8], such that global growth still lagged 5% below pre-crisis
expectations by 2024.
More recently, the IMF has upgraded its medium-term economic outlook, and the latest GDP
forecasts produced by Oxford Economics (OE) expect almost full recovery to within 1% of pre-
pandemic expectations. By 2025, the global economy is expected to be 17% larger than in 2019.
The economic downturn has been softened and recovery bolstered by government policy
support and stimulus packages, at least in developed countries. These relatively optimistic
medium-term growth forecasts mask significant short-term uncertainty and downside
risks due to emerging Covid-19 variants, unequal vaccine distribution globally, supply chain
disruption, and inflationary pressures [8].
a) World GDP Recovery b) 2025 GDP - % above 2019 levels
Figure 12 – Post Covid-19 Economic Recovery.
Source © International Monetary Fund; Oxford Economics.
17Aerospace Technology Institute – FlyZero - Market Forecasts & Exploitation Strategy FZO-CST-REP-0043
01.3.2
LONG-TERM ECONOMIC GROWTH
Global GDP is expected to double in real terms by 2050, growing at
an average rate of 2.3% a year from 2019 to 2050. After an initial post-
pandemic recovery phase with bounce-back growth rates over 5%,
annual growth is expected to stabilise at 3.0% by 2024 and taper to
1.7% by 2050 [9].
A key driver of long-term economic growth forecasts is population change and trends in productivity
improvement. The world’s population is expected to stabilise at around 10 billion people by 2060,
up from 7.7 billion people today. Population growth is already largely stable in developed countries
[10].
China is experiencing the most rapid demographic change, as its population distribution ages
rapidly. Since 1970, China’s population of over 65-year-olds has tripled from less than 4% to 12%,
while the proportion of under 18s has decreased from 47% to just 21%, on par with developed
countries. This demographic shift in China corresponds to a marked slowing of economic growth
expectations – from an average of 8.4% per annum during 2000-2019 to a forecast 3.8% per annum
during the period 2019-2040.
The fastest growing region in the next 30 years (to 2050) is South Asia, driven by India’s economic
development. GDP is forecast to grow at 5.1% per annum and GDP-per-capita at 4.3% per annum.
Southeast Asia is also expected to grow strongly, with GDP growing at 3.5% per annum and GDP-
per-capita at 2.9% per annum.
In contrast to the global trend of flattening population growth, Africa’s population is forecast to
grow continuously – from 1.3 billion today to 3.3 billion people by 2070 (see Figure 13b below). Africa
would then make up one-third of the world’s population. High population growth is combined
with relatively weak economic growth of 2.9% per annum to 2050, so that GDP-per-capita grows
more slowly in Africa than in any other region at just 0.8% per annum. The global average growth
in GDP-per-capita is 1.5% per annum to 2050.
18Aerospace Technology Institute – FlyZero - Market Forecasts & Exploitation Strategy FZO-CST-REP-0043
a) GDP Annual Growth - World Average b) Population Forecast (billions)
Source © Oxford Economics; real percent change. Source © UN World Population (August 2019).
c) GDP by Region
GDP Shares
Source © Oxford Economics.
d) Population - % under 18 e) Population - % over 65
Source © World Bank.
Figure 13 – Economic and Demographic Statistics.
19Aerospace Technology Institute – FlyZero - Market Forecasts & Exploitation Strategy FZO-CST-REP-0043
Growth in personal income and the developing middle class is a key driver of air travel demand. As
more people enter the global middle class, travel becomes a higher priority expenditure: currently
half of the world’s population are considered “middle class” and this is expected to grow to 67% by
2030 [3].
Propensity to travel (annual trips per capita) increases in line with per capita income, as illustrated in
Figure 14 below. Figure 15 plots the historic trends in trips-per-capita over the past 10 years, and our
forecast to 2050, showing how traffic growth correlates with income.
Enabling continued aviation growth, in an environmentally sustainable way, is a matter of global
equity. Around 75% of air passenger growth over the next 30 years will be to, from or within
developing countries [5]. Aviation supports the development of poorer countries by enabling inward
investment, promoting travel and tourism [6] and facilitating migration and remittance incomes [7].
10
OCEANA
EUROPE
SOUTH EAST ASIA CHINA NORTH AMERICA
1
TRIPS PER CAPITA
NORTH EAST ASIA
SOUTH ASIA MIDDLE EAST
RUSSIA &
CENTRAL ASIA LATAM
0.1
AFRICA
0.01
$1,000 $10,000 $100,000
GDP PER CAPITA
Figure 14 – Propensity to Travel – 2019.
Source © FlyZero analysis; UN World Population (August 2019), MIDT data ‒ Bubble size is region population.
Log-log axis.
Figure 15 – Trips per Capita Trends (2009 – 2050).
Source © FlyZero analysis; UN World Population (August 2019), MIDT data, Oxford Economics GDP forecast
(November 2021). 20Aerospace Technology Institute – FlyZero - Market Forecasts & Exploitation Strategy FZO-CST-REP-0043
01.4
AIR TRAVEL COSTS AND EFFICIENCY
The aerospace and air transport industry has a strong track record of driving fuel efficiency and
cost savings. Since 1990, fuel efficiency and CO2 emissions per revenue passenger kilometre (RPK)
have reduced by 56%, an average improvement of 2.8% per annum [2].
These efficiency improvements are a result of a combination of:
Investment in new, more fuel efficient aircraft
More efficient engines, better aerodynamics, and use of lighter weight materials
Fleet evolution and optimisation
Shorthaul shift from small regional aircraft to larger narrowbody aircraft with better per-seat
efficiencies
Longhaul shift from four-engine aircraft to more efficient modern twinjets
Higher seat density
New slimline seats allowing reduced seat pitch with the same legroom
Market share shift to low cost carriers (LCCs) with higher seat densities
Seat densification by legacy airlines, particularly in shorthaul markets
Increased passenger load factors
Better airline inventory and yield management
Market share shift to high load factor LCCs
Air traffic management improvements
Airspace modernisation and improvements
More direct routings and performance-based navigation
Continuous descent approach and continuous climb operations
21Aerospace Technology Institute – FlyZero - Market Forecasts & Exploitation Strategy FZO-CST-REP-0043
The past 10 years has seen a step-change in aircraft efficiency. New
efficient twin-engine longhaul aircraft (B787 and A350) are replacing
less efficient four-engine and older twin-engine types. The shorthaul
sector has seen new geared turbofan aircraft enter service on the A220,
A320neo, B737 MAX, and Embraer E-Jet E2 family.
In 2019, about 13% of the global fleet was made up of these latest generation aircraft [10]. This
retirement / replacement cycle will be largely complete by 2040, after which further aircraft
efficiency improvements are reliant on the development of a further generation of new aircraft
technology. Efficiency improvements due to higher seat densities and load factors have a natural
upper bound, and air traffic management system efficiencies can be offset by additional airspace
congestion due to traffic growth. Therefore, the rate of efficiency improvements will slow in the
longer term.
Overall, the FlyZero forecasts assume continued efficiency improvements that reduce the CO2
intensity of conventional aircraft (measured in “grams CO2 per RPK”) by 1.5% per annum during the
period 2019-2050, tapering to 1% per annum in the long-term. The 1.5% is made up of approximately
1.0% due to aircraft efficiency improvements and fleet renewal, 0.4% due to operational efficiencies,
and 0.1% due to changes in aircraft mix (mainly changes from regional aircraft to larger types with
better per-seat efficiencies).
This 1.5% per annum efficiency factor is slightly higher than estimates by the Air Transport Action
Group (ATAG) [11] and is in line with the UK Department for Transport’s “Continuation of Current
Trends” scenario of 1.5% per annum to 2050 [12].
These efficiency improvements, combined with increased airline competition and the growth of
LCCs, have reduced the cost of air travel. Average airfares have decreased by more than 50% in real
terms since 2008 [4]. Decreasing real-terms airfares help to support growth in passenger demand.
Fuel prices are a key driver of airline costs, averaging 23.5% of airline costs in 2019 [13]. Aviation fuel
prices, linked to oil prices, are highly volatile – between 2008 and 2019 they varied from $300 to
$1280 per tonne, and briefly dropped to around $200 per tonne in April 2020 due to the Covid-19
pandemic [14].
22Aerospace Technology Institute – FlyZero - Market Forecasts & Exploitation Strategy FZO-CST-REP-0043
a) Aviation Efficiency Improvements b) Average Airfares
Source © ATAG, IATA Economics [1]. Source © FlyZero analysis, MIDT airfare data, IMF
inflation rates. Real prices in 2020 USD.
c) Aviation Fuel Price History
Source © US EIA [16]; nominal prices.
d) Airfare v Sector KM e) Yield versus Sector KM
Source © FlyZero analysis based on MIDT airfare data (2019 data).
Figure 16 – Aviation Efficiency, Airfares and Fuel Price.
23Aerospace Technology Institute – FlyZero - Market Forecasts & Exploitation Strategy FZO-CST-REP-0043
01.5
SHIFTS IN PASSENGER DEMAND
The underlying long-term trends driving growth in air travel demand
– economics, demographics, costs and efficiencies – are subject to
behaviour changes and demand shifts. This is particularly true as the
world recovers from the Covid-19 pandemic and climate change issues
become more important to consumers and the travelling public.
The FlyZero baseline forecast represents continuation of pre-pandemic trends, driven by
econometric fundamentals in the medium and long term (from 2024, after pandemic travel
restrictions are assumed to cease). The baseline forecast takes account of the pandemic induced
economic downturn, but not lasting behavioural changes.
As a sensitivity, we also consider a conservative forecast scenario that assesses the impact of
long-term behaviour shifts post Covid-19 and increased competition from surface modes of
transportation, particularly high speed rail (HSR).
01.5.1
JOURNEY PURPOSE AND RESILIENCE
Leisure Travel
Passengers may travel for business or for leisure. Leisure air travel represents about 80% of
passengers [15] and is a broad category encompassing many individual reasons for travel. Typically,
about half of leisure passengers are travelling for tourism and holidays, while the remainder are
visiting friends and relatives (VFR), migrant workers, students, medical tourists and other non-
business travellers [16].
This type of travel has few substitutes and limited competition from other modes of transport, so
it is expected to be quite resilient once the Covid-19 pandemic has subsided and travel restrictions
are lifted.
There may be some lasting impacts and changes in leisure passenger demand as the air travel sector
recovers from Covid-19, including passenger behaviour changes due to climate change concerns.
The FlyZero conservative scenario assumes a “95% recovery” – that leisure travel will recover to a
level 5% below the baseline forecast due to long-term scarring and behaviour change.
24Aerospace Technology Institute – FlyZero - Market Forecasts & Exploitation Strategy FZO-CST-REP-0043
Business Travel
The full recovery of business air travel post-pandemic is more uncertain due to a combination of:
A step-change in business’ use of remote meeting technology due to forced adoption of
working-from-home during the pandemic
Cost saving opportunities, where companies have found ways to do business with less travel
Environmental targets, where companies have made commitments to reduce their carbon
footprints
Offsetting these downside factors is the renewed value, post-pandemic, that people and businesses
place on face-to-face interaction and the competitive pressures on companies to keep traveling in
order to win and retain business.
There are many reasons for business travel, some of which are more easily substituted than
others. A UK Department for Transport survey in 2018 (see Figure 17 below) [19] found that the
most common reason for business air travel was to attend a meeting (58%), but that almost half of
these were internal company meetings. Internal meetings may be more substitutable by remote
meeting technology than external meetings with customers and suppliers.
Business travel is dominated by professional services (IT, financial services, scientific, technical and
education industries) and the manufacturing industry. Travel is also highly concentrated on some
high frequency travellers – 85% of business travellers fly multiple times per year, but 31% fly more
than monthly [19].
There is evidence that many companies do not plan to resume business travel at pre-pandemic
levels, taking advantage of the shift towards online meetings to reduce costs and greenhouse gas
emissions. Estimates of 20-30% less business air travel than pre-pandemic baselines have been
reported by several large corporations [20].
Overall, the FlyZero conservative scenario assumes a “75% recovery” – that business travel recovers
to a level 25% below the baseline forecast. Given that business travel represents about 20% of total
air passengers, this is a 5% overall traffic reduction compared with the baseline forecast. In revenue
terms for airlines, the impact of fewer business travellers is much higher and, if this shift were to
transpire, would require significant changes in airline business models.
25Aerospace Technology Institute – FlyZero - Market Forecasts & Exploitation Strategy FZO-CST-REP-0043
a) Reasons for Business Air Travel b) Business Air Travel – Share by Industry
COMMUTE NO ANSWER
4% 2%
INFORMATION & COMMS
MANUFACTURING
ATTEND EVENT FINANCIAL & INSURANCE
17%
PROF, SCIENTIFIC, TECHNICAL
REASON FOR HEALTH & SOCIAL WORK
BUSINESS ATTEND
MEETING
AIR TRAVEL EDUCATION
PROVIDE
SERVICE
58%
WHOLESALE & RETAIL TRADE
19%
TRANSPORTATION & STORAGE
CONSTRUCTION
0 4 8 12 16
% BUSINESS TRAVEL
% UK GDP
Figure 17 – Reasons for Business Travel – 2018.
Source © DFT Dynamic surveying for Aviation (2018).
01.5.2
SURFACE MODE COMPETITION
Air travel is one component of a mass public transportation system
that includes road, rail and sea modes of travel. The different travel
modes are largely complementary and are optimised for different travel
distances and route densities. Air travel is best suited to longer distances
or where geography (eg, water or mountains) makes surface journey
times prohibitively long.
For inter-city travel, the main competitor for air travel is high speed rail (HSR). HSR routes require
high density traffic flows, whereas aviation can link thinner routes more cost effectively.
Electrified rail services generally have lower per-passenger-kilometre CO2 emissions than aviation,
so greater use of rail modes is an important way to decarbonise the overall transportation system,
particularly in advance of zero carbon emissions aircraft becoming available.
26Aerospace Technology Institute – FlyZero - Market Forecasts & Exploitation Strategy FZO-CST-REP-0043
Impact of HSR on Air Travel Demand
FlyZero’s assessment of the impact of HSR on air travel demand is based on analysis of the rail
and air modes (see Figure 18 below) and a study undertaken by Mott MacDonald [21].
The analyses indicate:
North America – 3-8% of intra North American air traffic could move to HSR by 2050 with
planned rail developments, principally on trunk routes in the east and west coast regions.
The FlyZero conservative scenario assumes a mid value of 5.5%, or around 75 million annual
passengers by 2050.
Europe – up to 14% of passengers (over 200m passengers by 2050) could switch to rail modes
through the development of new lines, better connectivity between EU countries and streamlined
international rail ticketing.
Northeast Asia – Already around 50% of domestic travel uses HSR in this region. New HSR
routes under construction in Japan are expected to capture an additional 13 million domestic air
passengers per year by 2050.
China – China has rapidly expanded its HSR network in recent years. It has 68% of the world’s HSR
line-kilometres and 66% of lines under construction. Because domestic air and HSR travel have
developed in parallel over the past 20 years, this HSR development trend is already incorporated
into our baseline forecasts and further adjustments are not required.
Other Regions – There is little development or trend towards HSR in other world regions, so no
adjustments to the air travel demand forecasts are required.
Overall, increased use of rail could result in about 300 million fewer annual air passengers by 2050
than in our baseline forecast, around 200 million of which are in Europe. This represents about 6%
of intra-regional passenger volumes, but only 0.8% of global passenger-kilometres carried due to
the shorter sectors impacted by HSR competition (typically 300 - 800 km distance).
27Aerospace Technology Institute – FlyZero - Market Forecasts & Exploitation Strategy FZO-CST-REP-0043
a) Rail Passengers (pax-km, trillions) b) Rail Freight (tonne-km, trillions)
(RH scale)
c) Length of Lines (km, thousands) d) High Speed Rail – Length of line (km)
e) HSR Passengers (pax-km, billions) f) HSR vs Air – HSR % of Intra-region passengers
Figure 18 – Global Rail Statistics.
Source © UIC Rail Statistics [19] ‒ MIDT air passenger data, FlyZero analysis.
28Aerospace Technology Institute – FlyZero - Market Forecasts & Exploitation Strategy FZO-CST-REP-0043
01.6
DEMAND FORECAST SUMMARY
The FlyZero baseline forecast projects growth at an average of 3.2% per
annum to 2050, reaching 22.9 trillion RPKs.
Our conservative scenario, taking account of incomplete post-pandemic traffic recovery and
increased surface mode competition, is about 10% lower at 20.7 trillion RPKs. The conservative
scenario lags the baseline growth trajectory by about 5 years – the growth in demand still occurs,
but in a later year.
Figure 19 – Demand Forecast Sensitivities. Source © FlyZero analysis.
Average growth %
Market < Actual Forecast > 2019 2019 2050
2010 2015 2019 2025 2030 2040 2050 2060 2070 2040 2050 2070
1.0 North America 1,430 1,700 2,030 2,420 2,750 3,540 4,420 5,420 6,560 2.7% 2.5% 2.0%
2.1 Central America 140 190 250 310 380 530 690 870 1,070 3.6% 3.3% 2.2%
2.2 South America 210 300 340 410 520 710 890 1,080 1,290 3.6% 3.1% 1.9%
3.0 Europe 1,270 1,570 1,950 2,390 2,760 3,510 4,360 5,310 6,380 2.8% 2.6% 1.9%
4.0 Africa 170 180 230 290 370 530 720 930 1,180 4.1% 3.8% 2.5%
5.0 Middle East 250 400 510 680 870 1,260 1,660 2,100 2,620 4.4% 3.9% 2.3%
6.0 Russia & C Asia 110 170 220 280 350 500 700 920 1,200 4.0% 3.8% 2.7%
7.1 South Asia 140 200 290 400 560 930 1,350 1,850 2,520 5.8% 5.1% 3.2%
7.2 China 500 820 1,190 1,660 2,090 2,920 3,710 4,480 5,390 4.4% 3.7% 1.9%
7.3 NE Asia 230 300 370 440 500 600 700 790 900 2.4% 2.1% 1.3%
7.4 SE Asia 320 480 640 880 1,150 1,700 2,280 2,930 3,730 4.8% 4.2% 2.5%
7.5 Oceana 170 210 250 320 380 510 630 770 930 3.4% 3.0% 1.9%
8.0 Rest of World 160 200 280 360 440 610 780 980 1,220 3.7% 3.4% 2.2%
Baseline 5,090 6,720 8,540 10,830 13,120 17,860 22,880 28,440 34,990 3.6% 3.2% 2.1%
Conservative 5,090 6,720 8,540 9,470 11,900 16,160 20,660 25,680 31,600 3.1% 2.9% 2.1%
Table 3 – Market Forecast Summary – RPKs (billion). Source © FlyZero analysis; MIDT data.
29Aerospace Technology Institute – FlyZero - Market Forecasts & Exploitation Strategy FZO-CST-REP-0043
Forecast Benchmarking
The FZ Baseline forecast matches the latest Airbus [11] and Boeing [23] global market forecasts
closely in 2030, but our FlyZero forecast tapers more with market maturity in the longer term
(forecasting average growth to 2040 of 3.6% per annum, compared with 3.9% and 4.0% for
Airbus and Boeing respectively).
The FZ Conservative forecast tracks 9-10% lower than the Baseline forecast, and is comparable
to the latest forecast update from Oxford Economics / IATA of November 2021 [9].
Figure 20 – Forecast Comparisons.
Source © FlyZero analysis; Boeing CMO 2021, Airbus GMF 2021, Oxford Economics / IATA (Nov 2021).
EUROPE RUSSIA & CENTRAL ASIA
GDP 1.2% GDP 2.2%
RPK 2.6% RPK 3.8% NORTH EAST ASIA
NORTH AMERICA GDP 0.5%
GDP 1.9% RPK 2.1%
RPK 2.5% SOUTH ASIA
CHINA
GDP 4.8.%
RPK 5.1% GDP 3.3%
MIDDLE EAST RPK 3.7%
GDP 2.0%
RPK 3.9%
AFRICA SOUTH EAST ASIA
GDP 2.9% GDP 3.5%
RPK 3.8% RPK 4.2%
LATAM
GDP 1.6%
RPK 3.2%
WORLD OCEANA
GDP 2.3% GDP 2.1%
RPK 3.2% RPK 3.0%
Figure 21 – Global Forecast Summary – 2019 to 2050 average annual growth rates.
Source © Oxford Economics GDP forecast, FlyZero baseline forecast.
30Aerospace Technology Institute – FlyZero - Market Forecasts & Exploitation Strategy FZO-CST-REP-0043
02.
FLEET FORECASTS
02.1
MARKET SEGMENTS
The FlyZero Global Fleet Forecast model translates projections of
passenger demand into future fleet requirements by market segment.
The market segments are defined based on a combination of aircraft size and sector distance, as
shown in the table below. Figure 22 shows the general relationship between sector distance and
aircraft size, and how current aircraft types cluster into the different market segments.
Category Description Typical Examples
Cessna Caravan, Beach 1900,
Subregional 9 - 19 seats
DeHavilland Twin Otter, Dornier 228
Regional 20 - 120 seat turboprops or regional jets ATR, Dash 8, CRJ, E170/190
120 - 220 seat narrowbody aircraft, up to
Narrowbody A220, A320, B737
2,400 nmi sector distance
Narrowbody sectors over 2,400 nmi;
Midsize 200-300 seat widebody aircraft, less than A321XLR, B757, B767, A330
5,250 nmi sector distance
Over 300 seats or over 5,250 nmi sector
Widebody A350, B787, B777
distance
Table 4 – Aircraft Market Segments.
Subregional
The subregional aircraft segment is defined as aircraft with less than 20 seats. The subregional
fleet is now quite old, with an average age of 29 years, and its share of the market has been in
steady decline due to trends towards larger aircraft with better per-seat operating economics.
The development of electric aviation has the potential to reverse this trend, with new subregional
electric aircraft offering zero emissions flight with competitive operating economics on short
routes, up to about 200 nmi distance [24].
31Aerospace Technology Institute – FlyZero - Market Forecasts & Exploitation Strategy FZO-CST-REP-0043
The subregional segment is outside of the scope of the FlyZero project’s concept designs, but
changes in the subregional share of the market is considered in our fleet forecast, as it affects
demand for regional aircraft in the 20-120 seat range. Our assessment is that subregional electric
aircraft may capture an increased share of the combined subregional/regional market – subregional
aircraft could capture 25% of the market on routes up to 200 nmi range, or about 10% of the total
subregional / regional market.
The FlyZero Global Fleet Forecast is focussed on demand for inter-city and regional air travel.
Therefore, the potential development of short-range urban air mobility (UAM) aircraft concepts is
not considered.
600
WIDEBODY
500
A380
MIDSIZE B777
400
AVERAGE SEATS
A330 B747
300
A350 A340
B767 B787
200
B757
100
0
0 1000 2000 3000 4000
AVERAGE SECTOR (nmi)
300
NARROWBODY
250
AVERAGE SEATS
A320
200
B737
REGIONAL
150
RJ
100
TURBOPROP
50
0
0 200 400 600 800 1000
AVERAGE SECTOR (nmi)
Figure 22 – Aircraft Markets – relationship between aircraft size and sector distance.
Source © FlyZero analysis; SRS Analyzer schedule data (2019). Bubble size is proportional to share of available-seat-
kilometres (ASKs).
32Aerospace Technology Institute – FlyZero - Market Forecasts & Exploitation Strategy FZO-CST-REP-0043
Regional
The regional aircraft segment (20-120 seats) is highly fragmented between turboprop and regional
jet types. It has been in relative decline in recent years – the share of flights operated by regional
aircraft declined from 32% to 25% between 2004 and 2019. Regional aircraft make up 21% of the
current fleet, but only 10% of expected new aircraft deliveries to 2050. The regional segment is
exposed to competition and substitution from electric subregional aircraft at the lower end,
narrowbody aircraft at the upper end, and increased surface mode competition (eg, high speed
rail) in some markets. Regional aircraft are currently responsible for about 7% of aviation’s CO2
emissions, and this share is expected to fall to around 4% by 2050 due to dilution of the regional
aircraft market share.
Narrowbody
The shorthaul market is dominated by narrowbody aircraft with 120-220 seats, operating 93% of
shorthaul capacity (as a share of available-seat-kilometres). Narrowbody aircraft represent 60% of
the total passenger aircraft fleet and operated 64% of flights in 2019, an increase from 52% in 2004.
This increasing share of the narrowbody segment is expected to continue, driven by shorthaul
market growth trends and up-gauging of regional aircraft types. Narrowbody aircraft are expected
to make up 65% of passenger aircraft deliveries to 2050 and over 50% of the aircraft market by
value. Narrowbody aircraft are currently responsible for about 49% of aviation’s CO2 emissions, so
decarbonising the narrowbody segment is key to meeting aviation’s environmental objectives.
Midsize
There is a midsize aircraft segment between the shorthaul narrowbody and ultra-long range
widebody segments. Historically this segment was served by aircraft such as the A300/310, A330
and B757/B767, and most recently by the extended range A321XLR. Only the A330neo and A321XLR
are in current production as passenger aircraft.
FlyZero identified the opportunity to develop a midsize zero carbon emissions (ZE) aircraft concept
with an operational range of 5,250 nmi, capable of intercontinental operations and providing one
stop global connectivity.
The FlyZero Global Fleet Forecast defines the midsize market segment as:
Narrowbody sectors over 2,400 nmi distance (0.5% of narrowbody flights in 2019)
Widebody aircraft with 200-300 seats operating sectors less than 5,250 nmi distance (55% of
widebody flights in 2019)
In 2019, 5% of flights operated were in this midsize segment, and these were responsible for about
19% of aviation’s CO2 emissions.
33Aerospace Technology Institute – FlyZero - Market Forecasts & Exploitation Strategy FZO-CST-REP-0043
Widebody
The long range widebody aircraft segment includes the latest generation widebody twin-engine
aircraft (A350, B787, B777X) with ultra-long ranges of 7,300-8,700 nmi. These aircraft offer superior
operating economics and are replacing the remaining four-engine aircraft types (A340, A380,
B747), which have now ceased production.
Large aircraft operating long distances are high emitters of CO2 – widebody aircraft currently
operate 4% of flights but emit 25% of aviation’s total CO2.
The table and figure below summarise characteristics of the baseline passenger aircraft fleet. This
reflects the global fleet and scheduled use of aircraft in 2019, before the impacts of the Covid-19
pandemic. In addition to the 26,860 passenger aircraft, there was a fleet of 3,040 freighter aircraft,
giving a total fleet of 29,900 aircraft at the end of 2019.
2019 Fleet Flights ASK CO2 Ave Ave Ave Sectors Utilisation
Fleet (%) (%) (%) (%) Seats per Sector Block per (BH / day)
Class flights (nmi) time (h) day
Subregional 620 2.3% 3.3% 0.02% 0% 13 87 0.7 5.3 3.8
Regional 5,630 21% 24% 4% 7% 71 356 1.5 4.6 6.7
Turboprop 2,105 8% 9% 1% 63 196 1.1 4.6 5.3
Regional Jet 3,525 13% 15% 3% 76 411 1.7 4.5 7.6
Narrowbody 16,190 60% 64% 51% 49% 167 711 2.4 4.1 9.7
Midsize 2,490 9% 5% 19% 19% 258 2,297 5.8 2.0 11.5
Widebody 1,930 7% 4% 25% 25% 356 2,806 7.0 2.0 13.7
Total 26,860 100% 100% 100% 100% 150 750 2.4 3.9 9.4
Table 5 – Fleet Characteristics – 2019.
Source © Cirium Fleet Database (as at 31 Dec 2019), SRS Analyzer schedules (2019), FlyZero analysis. Based on
commercial passenger aircraft fleet (excluding freighters) as at 31 Dec 2019. Sectors per day and Utilisation averaged
over 365 days.
2
Figure 23 – Fleet Shares (2019). Source © Cirium Fleet Database, SRS Analyzer schedules (2019), ICCT (October 2020),
FlyZero analysis. % passenger fleet / operations. 34Aerospace Technology Institute – FlyZero - Market Forecasts & Exploitation Strategy FZO-CST-REP-0043
02.2
FUTURE FLEET FORECAST
The figures below summarise the FlyZero Global Fleet Forecast, aligned with the FlyZero baseline
passenger demand scenario:
a) Fleet Forecast b) Fleet Share Forecast
c) Delivery Forecast d) Delivery Shares
Figure 24 – FlyZero Global Fleet Forecast (source © FlyZero analysis).
* Freighter deliveries include conversions of passenger aircraft.
35Aerospace Technology Institute – FlyZero - Market Forecasts & Exploitation Strategy FZO-CST-REP-0043
02.3
BASELINE CO2 EMISSIONS FORECAST
Global aviation emitted 920 Mt of CO2 into the atmosphere in 2019 [2].
Without efficiency improvements, this would grow to 2,470 Mt by 2050.
Aircraft and operational efficiency improvements (described in Section 1.4 above) are expected to
reduce aviation’s carbon intensity (measured in “grams CO2 per RPK”) by 1.5% per annum, or by 38%
in aggregate by 2050.
With these efficiency improvements, the baseline forecast of aviation’s annual atmospheric CO2
emissions (“tail pipe” emissions) grows to 1,540 Mt by 2050 and 1,850 Mt by 2070 (+67% and +100%
respectively compared with 2019 emissions).
Section 5 of this report presents the FlyZero scenarios for the market penetration of zero carbon
emissions (ZE) aircraft technology and the potential abatement of these CO2 tailpipe emissions.
Figure 25 – Baseline Atmospheric CO2 Emissions – No zero carbon emission aircraft.
Source © FlyZero analysis.
36You can also read