Market and Trade Profile: Canada - Canada - January 2020 - Market and Trade Profile Canada - Visitbritain.org
←
→
Page content transcription
If your browser does not render page correctly, please read the page content below
Market and Trade Profile Canada

Market and
Trade Profile: Canada

Canada – January 2020
Market and Trade Profile Canada

Overview
•   Chapter 1: Inbound market statistics provides insights on key statistics about
    Canadian travellers and who they are. It takes a look at Britain and its competitive set
    as well as activities of Canadian visitors in the UK.

•   Chapter 2: Experiences and perceptions features details about what visitors from
    Canada are likely to do in the UK, how they felt during their visit to the UK, and
    whether they would recommend a stay there to their acquaintances. Perceptions of
    Britain held by Canadians in general are also highlighted.

•   Chapter 3: Understanding the market takes a close look at Canadian consumer
    trends, booking, planning and further travel behaviour of this source market.
    Perceptions of Britain held by Canadians are also highlighted.

•   Chapter 4: Access and travel trade shows how Canadians travel to the UK, how to
    best cater for their needs and wants during their stay and gives insights into the
    Canadian travel trade. Further ways of working with VisitBritain and other useful
    research resources are pointed out.

                                                                                                    2
Market and Trade Profile Canada

Contents (1)
Executive summary (page 6)

Chapter 1: Market statistics
 1.1 Key statistics (page 11)
 Tourism context, UK inbound overview, key figures on journey purpose, seasonality, duration of stay and
 accommodation trends, repeat visits, and visit types
 1.2 Getting around Britain (page 18)
 Where visitors stayed in the UK, places they visited, and internal modes of transport
 1.3 Visitor demographics (page 23)
 Demographic profile of Canadian visitors (age, gender)
 1.4 The UK and its competitors (page 26)
 How visits to the UK compare to main competitor destinations, and long-term trend and forecasts

Chapter 2: Experiences and perceptions
 2.1 Inbound activities (page 31)
 What activities Canadian visitors undertook in the UK
 2.2 Welcome and recommending Britain (page 37)
 How welcome departing visitors felt in Britain, and how likely they were to recommend a visit
 2.3 Perceptions of Britain (page 38)
 How people in this source market see Britain, and how it compares to other destinations

                                                                                                                       3
Market and Trade Profile Canada

Contents (2)
Chapter 3: Understanding the Market
3.1 Structural drivers (page 46)
Key demographic, social, economic indicators and exchange rates influencing the outbound travel market
3.2 Consumer trends (page 50)
General and travel-related trends in this source market
3.3 Booking and planning (page 52)
How Canadian travellers plan and book their trips to the UK, and their holidays in general
3.4 Reaching the consumer (page 55)
An overview of the media landscape in this source market, and main sources of influences for people planning a
holiday

Chapter 4: Access and Travel Trade
4.1 Access (page 62)
How visits to the UK were made, and an overview of the air connections between this source market and the UK
4.2 Travel trade (page 66)
What the travel trade in market looks like and useful tips to work with travel agents and other main players
4.3 Caring for the consumer (page 72)
Tips to understand Canadian travellers and best cater to their needs

Appendix:
Working with VisitBritain (page 75)
Useful resources (page 78)
Definitions, sources and information on this report (page 80)

                                                                                                                       4
Market and Trade Profile Canada

Executive summary

                                                      5
Market and Trade Profile Canada

1: Inbound market statistics

Chapter summary
Canada’s outbound travel market is forecast to increase in the
years to come. According to Oxford Economics, the market is                                         The UK was the
forecast to hit 40.3 million trips abroad trips abroad with at least
one overnight stay by 2020.
                                                                                                    3rd most visited
Ireland (43%), France (42%), and Germany (30%) are the holiday
                                                                                                       European
destinations that Canadian holidaymakers to Britain were most                                        destination by
likely to consider as alternative destinations.                                                      Canadians in
Canadians rank globally in 8th place for international tourism                                           2018.
expenditure with over US$33bn spend in 2018.
Canada was the 12th largest inbound source market for the UK for
volume and the 9th most valuable source market for visitor
spending in the UK in 2018.
88% of departing Canadian holidaymakers would be ‘extremely
likely’ to recommend Britain for a holiday or short break.

Source: International Passenger Survey by ONS, VisitBritain/IPSOS 2016, Oxford Economics, UNWTO,

                                                                                                                                     6
Market and Trade Profile Canada

2. Experiences and perceptions
Chapter summary
Top activities featuring in visits from Canada
to the UK include dining in restaurants,
shopping and going to a pub.
Culture and history are strong pulls to the                                                         Main reason why Canadian
UK. Canadians have a higher than average                                                           holidaymakers visited Britain:
propensity to visit museums and art                                                                Cultural attractions,
galleries, and over 4 in 10 visit historic
houses and castles.                                                                                  Ease of getting
Canadians are positive about Great Britain:                                                        around, safety and
the nation is ranked 2nd among 50 nations                                                                security
for its overall image based on six dimensions
(Tourism, Culture, People, Exports,
Governance, Immigration & Investment).
Canadians have a strong feeling of welcome
when they visit the UK. 97% of departing
Canadian holidaymakers are either ‘very’ or
‘extremely’ likely to recommend a visit to the
UK to friends and family.

Source: International Passenger Survey by ONS, Anholt Nation Brands Index, powered by Ipsos 2018

                                                                                                                                                7
Market and Trade Profile Canada
3.Understanding the market
Chapter summary
Canada’s population reached 37.5 million in 2019. Canada’s
Almost 6 in 10 overnight outbound trips from Canada were made for outbound
leisure purposes in 2018 and with over 20% of the population being travel market is
foreign-born, demand for travel to visit friends and family is also high. forecasted to
Canada's outbound travel market is forecasted to grow by 12% in the grow by 12% in
next five years. 2018-2023.
Almost 6 in 10 Canadian holiday visitors tend to start thinking about
their trip to Britain early, more than half a year in advance.
37% of Canadian travellers booked their trip to Britain three to six months
before arrival. Almost one fifth of travellers booked last-minute (within one
month before arrival).
More than half of Canadian travellers to Britain book travel and
accommodation together, with 71% doing so online.
Mobile is a growing segment making up one third of media time in
Canada with almost half saying they have purchased a product or
service online using their mobile device in 2018.
Source: Oxford Economcis, VisitBritain/IPSOS 2016, Insights West
8Market and Trade Profile Canada
4. Access and travel trade
Chapter summary
Annual seat capacity from Canada to the UK has grown 14% in
the past 5 years and reached 2.1 million seats in 2019. Seat
9 airports in Canada were connected to the UK via direct non-
stopping flights in 2019 with an average weekly capacity around capacity
40,000 seats. Airline capacity is very important as 93% of from Canada to the
Canadian visits to the UK were made by plane in 2018. UK has increased by
London Heathrow and London Gatwick welcomed 90% of 14% from
Canada’s direct flights to the UK in 2019. Manchester’s capacity 2014-2019
has increased 24% over the past 3 years and surpassed 100,000
seats in 2019.
The trade structure in Canada is closer to that in Britain than in
the USA.
Travel e-commerce has grown rapidly. It is increasingly evident
that both airlines and travel agents are placing more emphasis on
‘direct sell’ as well as vertically integrated players moving into the
OTA space.
Source: Apex 2019, non-stop flights only, VisitBritain/IPSOS 2016, base: visitors
9Market and Trade Profile Canada
Chapter 1:
Inbound market
statistics
10Market and Trade Profile Canada
Chapter 1.1: Key statistics
Key insights
850,000 Canadians visited the UK in 2018 (up 2% on 2017) which
makes Canada the UK’s 12th largest source market.
Holidays from
VFR and holiday visits continue to lead in terms of volume of
Canada to the
visits from the Canadian market, representing 81% of all visits. UK increased to
Holiday visits reached 339,000 in 2018, setting a new record. a record 339,000
In 2018, Canadians visiting the UK spent a record setting £676 in 2018.
million - up 12% on 2017 and including a record for VFR spend.
Spend per visit also increased to £795, a new record.
Canadian visitors spent an average of 9 nights per visit in the UK
in 2018, longer than the global average of 7 nights.
Canadians are more likely to stay outside of London than the
average visitor; 66% of Canadian nights were spent outside
London in 2018 compared to 58% of the global total.
Around half of all nights spent in the UK by Canadian visitors are
spent for free in the house of relatives or friends, followed by
31% which are spent in a hotel or guest house.
Source: International Passenger Survey by ONS
11Market and Trade Profile Canada
1.1 Key statistics: global context and 10 year trend
Global context Inbound travel to the UK overview
Measure 2018 Measure Visits Nights Spend
(000s) (000s) (£m)
10 year trend -1% -4% +29%
International tourism
33.5 2008 857 8,115 522
expenditure (US$bn)
2009 687 6,802 408
Global rank for international 2010 686 7,413 513
8
tourism expenditure 2011 740 7,061 512
2012 704 7,036 559
Number of outbound 2013 731 7,207 524
39.2
overnight visits (m)
2014 649 6,132 473
2015 708 6,838 506
Most visited destination USA
2016 828 8,219 634
Most visited European 2017 835 8,248 604
France 2018
destination 850 7,759 676
Share of UK total
2.2% 2.9% 3.0%
in 2018
Source: International Passenger Survey by ONS, UNWTO, Oxford Economics
12Market and Trade Profile Canada
1.1 Key statistics – volume and value
Inbound volume and value Nights per visit, spend
Measure 2018 Change Rank out of Averages by Nights Spend Spend
vs. 2017 UK top journey purpose per per per
markets in 2018 visit night visit
Visits (000s) 850 2% 12 Holiday 8 £113 £863
Nights (000s) 7,759 -6% 12 Business 5 £214 £1,011
Visiting friends/
Spend (£m) 676 12% 9 12 £56 £688
Relatives
The UK welcomed 406,000 visits from Canada in All visits 9 £87 £795
Jan-Jun 2019 (up 11% on Jan-Jun 2018).*
Source: International Passenger Survey by ONS, *2019 IPS data is provisional
13Market and Trade Profile Canada
1.1 Key statistics: journey purpose
Journey purpose 2018 Journey purpose trend (visits 000s)
41% 500
Share of visits
40% 40%
400 352
31%
300 339
22%
200 74
9% 9%
5% 100
1% 1% 77
0 8
2005
2006
2007
2008
2009
2010
2011
2012
2013
2014
2015
2016
2017
2018
Holiday Business VFR Study Misc.
Canada All markets Holiday Business VFR Study Misc.
41% of all visits to the UK from Canada were visits to VFR and holiday visits continue to lead in terms of
friends and/or relatives, and 40% were made for volume of visits from the Canadian market.
holiday purposes, in 2018. In 2018 the number of holiday visits from Canada to the
60% of holiday visits from Canada to the UK (excl. UK was up 9% compared to the previous year, to a
UK nationals) in 2015 were made by repeat visitors. record 339,000 holidays.
On average a Canadian holidaymaker came 2.8 The number of visits to friends and relatives in 2018 was
times to the UK in the past 10 years.* 29,000 visits short of the peak last seen in 2006, prior to
the global financial crisis.
Source: International Passenger Survey by ONS, *IPS 2015
14Market and Trade Profile Canada
1.1 Key statistics: seasonality
Seasonality 2018
36%
The summer quarter remains the most important period
Share of visits
28%
28% 27%
24%
for Canadians to visit the UK. In 2018, 36% of visits from
21% 21% Canada to the UK were made in the third quarter, followed
15% by 28% in the second quarter. Canadians visit the UK less
often in the low seasons compared to the average UK
visitor.
The volume in the second half of 2018 showed 6% growth
Jan-Mar Apr-Jun Jul-Sep Oct-Dec compared to 2017 whereas the volume in the first half
Canada All markets year was down 3% on the previous year.
Seasonality trend (visits 000s)
400
300 305
237
200
178
100 130
0
2005 2006 2007 2008 2009 2010 2011 2012 2013 2014 2015 2016 2017 2018
Jan - Mar Apr - Jun Jul - Sep Oct - Dec
Source: International Passenger Survey by ONS
15Market and Trade Profile Canada
1.1 Key statistics: length of stay and accommodation
Accommodation stayed in, 2018 Duration of stay trend (visits 000s)
(nights, % share) 300 276
250 249
1% 0%
2% 0% 200 206
3%
150
5% 110
100
6% 50
10
0
50%
Nil nights 1-3 nights 4-7 nights
33%
8-14 nights 15+ nights
Canadian visitors spent on average 9 nights per visit in the
UK in 2018, longer than the global average of 7 nights. This is
partly due to the large VFR component in Canadian visits to
Free guest with relatives or friends the UK, as these visits tend to be longer than average.
Hotel/guest house
Hostel/university/school The most common length of stay for Canadian travellers in
Bed & Breakfast the UK was 4-7 nights, followed by long trips of 8-14 nights
Rented house/flat and then short trips of 1-3 nights.
Own home
Other Around half of nights were spent for free in the house of
Paying guest family or friends house relatives or friends, followed by 33% which were spent in a
Source: International Passenger Survey by ONS hotel or a guest house, in 2018.
16Market and Trade Profile Canada
1.1 Key statistics: repeat visits and package tours
Proportion of overnight visitors to the UK who Proportion of visits that are bought as part of a
have been to the UK before* package or all-inclusive tour in 2018**
89% 88% 14%13%
77% 76%
60%
8%
7%
6% 6%
4% 3%
3%
1%
All All Canada - Canada - Canada - Business Holiday VFR Misc. All
markets Canada Holiday Business VFR journey
Canada purposes
76% of holiday visits from Canada to the UK were made by repeat visitors (excl. UK nationals). These repeat visitors
came on average between two and three times in the past ten years (2.8 times, a slightly above average visit
frequency compared to other markets) and spent £2,290 in the UK in total in the past ten years.
The highest proportion of repeat visitors were among those coming for business purposes (89%) or to visit friends or
relatives who live in the UK (88%).
International Passenger Survey by ONS. *repeat / first time visitors question asked in 2015 excluding British nationals; **See definition of a package holiday in appendix
17Market and Trade Profile Canada
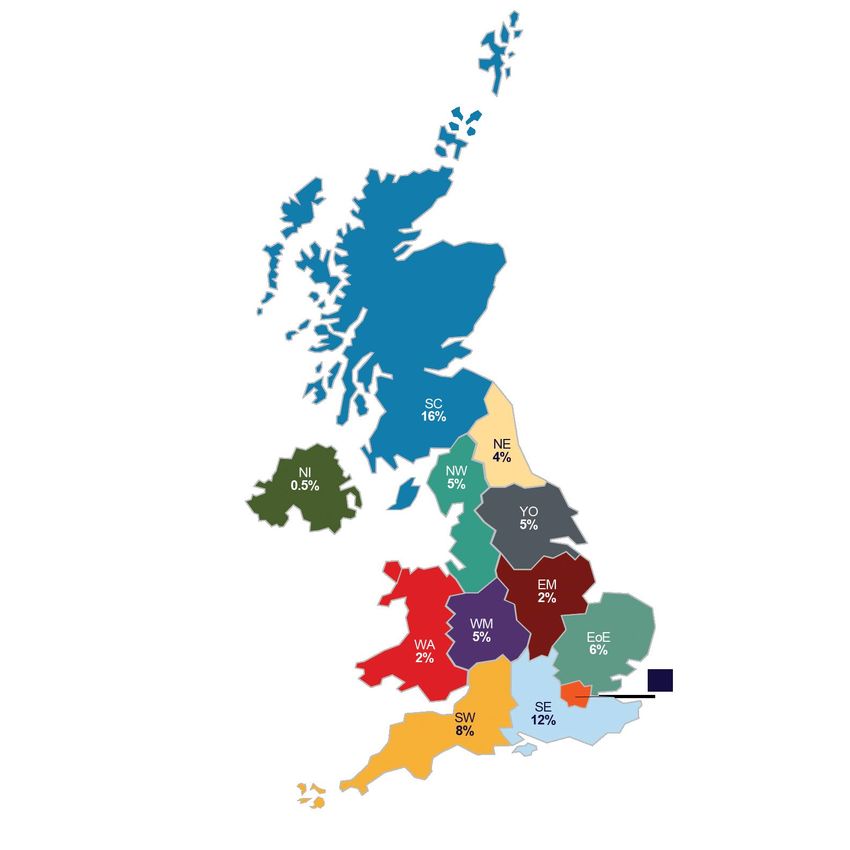
1.2 Getting around Britain Nights (% share)
Nights and visits to the UK in 2018
Region* Nights stayed Visits (000)
(000)
Total 7,759 850
Scotland (SC) 1,269 131
Wales (WA) 178 36
Northern Ireland (NI) 20 4
London (LDN) 2,613 474
North East (NE) 287 7
North West (NW) 388 55
Yorkshire (YO) 383 37
West Midlands (WM) 368 38
East Midlands (EM) 172 27
East of England (EoE) 483 62
South West (SW) 640 77
South East (SE) 930 162
Nil nights (Nil) n/a 10
Source: International Passenger Survey by ONS * The region is based on the location in which the visitor stayed overnight
18Market and Trade Profile Canada
1.2 Getting around Britain: regional spread and top towns and cities
Top towns and cities visited 2016-2018 When visiting the UK, 81% of nights by Canadians are
spent in England; London accounts for 34% of visitor
Town Overnight visits (000s) nights and the rest of England for 47% of visitor nights.
The South East is the most popular region to visit outside
London 459 of London, attracting 162,000 Canadian visits in 2018.
Edinburgh 80 Scotland is a relatively popular UK region among
Canadian travellers. 16% of nights were spent in
Glasgow 52
Scotland, compared to a global average of 9% of all
Manchester 25 international nights spent.
Inverness 17 Visitors from Canada have an above average propensity
to visit rural and coastal areas of Britain on their trip.
Canadian visitors tend to be comfortable with taking
Regional spread 2018 public transport, showing above-average use of these
47%46%
42% modes of transport. When in a town/city, 54% of
Share of nights
34% Canadian visitors use a bus, tube, tram or metro on their
visit and 36% a train.
16%
9%
2% 2% 0% 1%
Scotland Wales London Rest Of Northern
England Ireland
Canada All markets
Source: International Passenger Survey by ONS
19Market and Trade Profile Canada
1.2 Getting around Britain: visits to coast, countryside and villages
Propensity to visit coast, countryside and villages
VFR: Went to the coast or beaches 22%
13%
VFR: Went to countryside or villages 31%
17%
Business: Went to the coast or beaches 0%
2%
Business: Went to countryside or villages 5%
2%
Holiday: Went to the coast or beaches 24%
14%
Holiday: Went to countryside or villages 32%
18%
All journey purposes: Went to the coast or beaches 19%
10%
All journey purposes: Went to countryside or 27%
villages 13%
Canada All markets
Source: International Passenger Survey by ONS 2016
20Market and Trade Profile Canada
1.2 Getting around Britain: use of internal modes of transport
Propensity to use internal modes of transport
Car/vehicle you/group brought to 0%
the UK 1%
Hired self-drive car/vehicle 11%
5%
Private coach/minibus (for group 4%
only) 2%
Public bus/coach (outside town/city) 9%
5%
Uber 11%
9%
Taxi 33%
27%
Train (outside town/city) 36%
23%
Bus, Tube, Tram or Metro Train 54%
(within town/city) 48%
Domestic flight 3%
1%
Canada All markets
Source: International Passenger Survey by ONS 2018; most lorry drivers were not asked this question, and as a consequence, are not taken into account in the results for ‘car/vehicle you/group
brought to the UK
21Market and Trade Profile Canada
1.2 Getting around Britain: purchase of transport and package tours
Transport services purchased before or during trip (%)
Public transport is a favourable method
used to get around towns/cities amongst
Canadians. Compared to the market
52% average, they are more likely to use public
46% transport outside towns/cities.
Canadian visitors have a strong propensity
36% to take taxis, with 1 in 3 visitors taking a taxi
32% 32% 33% 32%
30%31% 30%
29% 31%
28%
during their visit.
27% 27%
26% 26%
24% 25% Compared to the market average,
18% 17%
Canadians are twice as likely to hire a car
15% and a private coach.
9% 9% Canadians are more likely to pre-book the
majority of transport services within the UK
with the exception of transport within
Pre During Pre During Pre During Pre During Pre During Pre During London.
Transport Train travel Airport Coach travel Car hire Flights within
within London transfer the UK Transportation from the airport was the most
commonly booked mode of transport in the
Canada All markets
UK with 1 in 3 visits from Canada having
booked before arrival to the UK.
International Passenger Survey by ONS, VisitBritain/IPSOS 2016, base: visitors
22Market and Trade Profile Canada
1.3 Visitor demographics
Visitor characteristics
Canadian visitors tend to be older than the average
39%
visitor to the UK: 34% of Canadian visitors were
aged 55+ in 2018, compared to the all market average of
20%. of Canadians travelled
The largest proportion of Canadian visitors who came to with their
the UK in 2015 reside in Ontario (48%), followed by spouse/partner in
British Columbia (19%). 2017
84% of visits from Canadian residents to the UK were
made by Canadian nationals, 8% by British nationals.
6 out of 10 Canadian holiday visitors (excl. UK nationals)
were making a repeat visit to Britain in 2015.
Canadians are more likely to travel to Britain with their
spouse/partner than the global average (39% vs 28%).
97% of departing Canadian holidaymakers in 2017 were
either ‘very’ or ‘extremely’ likely to recommend Britain for
a holiday or short-break.
Source: International Passenger Survey by ONS
23Market and Trade Profile Canada
1.3 Visitor demographics: gender and age groups
Gender ratio of visits (2018): Age group trend (visits in 000s)
2004 39 66 108 128 157 145 97
All markets 41% 57%
2005 22 78 124 134 156 175 106
2006 27 86 131 140 173 176 134
Canada 45% 54%
2007 29 75 152 158 180 159 98
Female Male 2008 27 118 126 132 181 170 102
2009 16 66 117 133 133 128 94
2010 11 66 110 122 147 140 89
Gender ratio of visits from Canada by 2011 54 121 122 172 160 95
journey purpose (2018): 2012 67 109 141 147 121 103
2013 63 119 116 170 135 117
Misc. 50% 50% 2014 77 115 95 133 133 86
Study 18% 82% 2015 73 103 130 153 141 92
VFR 48% 51% 2016 88 138 145 163 156 121
2017 73 160 156 184 127 116
Holiday 57% 42% 2018 67 159 132 166 170 119
Business 77% 23%
0 -15 16-24 25-34 35-44 45-54 55-64 65+ Not Known
Male Female
Source: International Passenger Survey by ONS
24Market and Trade Profile Canada
1.3 Visitor demographics: travel companions
Who have Canadian visitors to the UK travelled with?
43%
39%
36%
28%
15%
13%
12% 11%
9%
7%
5% 4%
2% 2%
Travelling on Spouse/partner Adult friend(s) Adult family Business Part of a tour Child(ren) - any
own member(s) colleague(s) group
Canada All markets
Source: International Passenger Survey by ONS, 2017, Who accompanied you on your visit to the UK, excluding UK residents you may have visited during your trip?
25Market and Trade Profile Canada
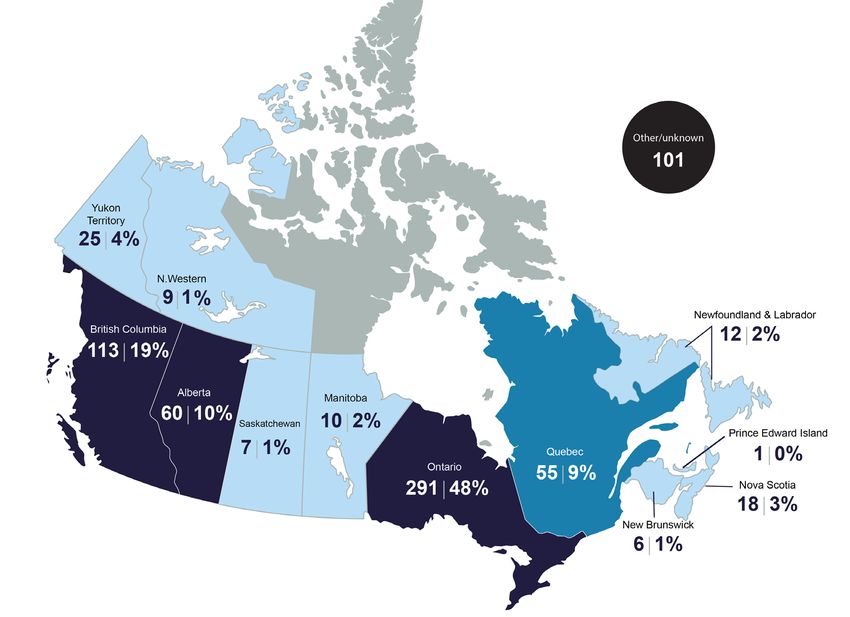
1.3 Visitor demographics: origin
Visits to the UK in 2015 (000s)
The largest proportion of
Canadian visitors who came to the Unknown:
101
UK reside in Ontario. This
province generated almost half all
inbound visits from Canada in
2015. Almost one fifth of the
Canadian visitors came from
British Columbia.
Connectivity reflects these largest
source regions.
Visits in 000s | % share of visits
High
Medium
Low
Source: International Passenger Survey by ONS, 2015
26Market and Trade Profile Canada
1.4 The UK and its competitors
Market size, share and growth potential
Britain was the 8th most visited international destination by
Canadian tourists in 2018, behind the USA, Mexico, Cuba,
France, Italy, Dominican Republic and China.
The visit forecast over the next decade (+45%) implies
ongoing YOY growth in the number of Canadian overnight
Britain
visits to Britain. ranks 8th
Of those who came to Britain for a holiday, 43% considered for Canadian outbound
Ireland, 42% France, 30% Germany, 27% Italy and 26% destinations by
Spain as an alternative holiday destination. overnight trips
Among the competitor set, Italy, Spain, India, China and
Ireland recorded growth in market share in terms of Canadian
outbound overnight trips in the past decade (2008-2018).
Markets that lost market share include the UK, France and
Germany.
Canadians have an above average propensity to visit the UK
as part of a multi-country trip.
Source: Oxford Economics (based on overnight trips), VisitBritain/IPSOS 2016
27Market and Trade Profile Canada
1.4 The UK and its competitors
UK’s market share of Canadian overnight visits Historic and potential visits to the UK (000s)
among competitor set
25% 1,400
France
20%
12% 1,200 1,144
Italy
19%
China 15% 1,000
16%
24%
United Kingdom 800
15%
4%
Spain
9% 600
6%
India
8%
400
7%
Germany
6%
200
3%
Ireland
4%
3% 0
Australia 1995 1998 2001 2004 2007 2010 2013 2016 2019 2022 2025 2028
3%
2008 2018
Source: Oxford Economics for competitor set based on overnight visits,
Historic and potential visits display total visits based on International Passenger Survey, Oxford Economics and VisitBritain data adaptations
28Market and Trade Profile Canada
1.4 The UK and its competitors
Propensity for Canada travellers to visit the UK as part of a multi-country trip
% visits which included at least a night in another country…
All markets 4% 4% 5%
Canada 12% 10% 4%
Before visiting the UK only After visiting the UK only Before and after visiting the UK
Source: International Passenger Survey by ONS, 2016
29Market and Trade Profile Canada
Chapter 2
Experiences and
perceptions
30Market and Trade Profile Canada
2.1 Inbound activities
Top 10 activities for Canadian visitors during
their visit to the UK
Dining in restaurants, shopping and going to
a pub are the most popular activities for 1. Dining in restaurants
Canadian visitors while in the UK, with 76%,
2. Going shopping
61% and 55% doing so.
Canadian visitors are much more likely than 3. Going to the pub
the average UK visitor to go to built heritage
sites and museums, and to visit castles or 4. Sightseeing famous monuments/ buildings
historic houses.
5. Socialising with locals
Four out of ten visits involve time in a park or
garden. Canadians are also twice as likely as 6. Visiting parks or gardens
the average UK customer to visit a National
Park. 7. Visiting castles or historic houses
Almost 1 in 2 Canadians enjoy socialising 8. Visiting museums or art galleries
with locals.
Around 16,000 visits per year feature time 9. Visiting religious buildings
watching football.
10.Going to countryside or villages
For more information on activities, please consult:
Source: International Passenger Survey by ONS, rankings based on 2007-2017 data,
https://www.visitbritain.org/activities-undertaken-britain
31Market and Trade Profile Canada
2.1 Inbound activities
Propensity to visit museums and galleries Propensity to visit built heritage sites
VFR: visited 27% VFR: visited religious buildings 30%
museums and art 18%
galleries 23% VFR: visited castles/historic 35%
houses 23%
Holiday: visited 55% 48%
Holiday: visited religious buildings
museums and art 35%
galleries 48% Holiday: visited castles/historic 62%
houses 48%
Business: visited 20% Business: visited religious 14%
museums and art buildings 4%
galleries 6% Business: visited castle/historic 14%
houses 6%
All journey
purposes: visited 36% All journey purposes: visited 34%
museums and art religious buildings 20%
28% All journey purposes: visited
galleries 41%
castles/historic houses 28%
Canada All markets Canada All markets
Source: International Passenger Survey by ONS 2016
32Market and Trade Profile Canada
2.1 Inbound activities
Propensity to attend the performing arts
Number who went to watch sport live during trip
(000s)
All journey purposes: attended a 4%
festival 3% 16
All journey purposes: went to the 13%
theatre/musical/opera/ballet 9%
VFR: attended a festival 2%
3%
VFR: went to the 10%
theatre/musical/opera/ballet 8%
Business: attended a festival 3%
1%
Business: went to the 9%
theatre/musical/opera/ballet 2%
Holiday: attended a festival 6% 3
4%
Holiday: went to the 18% 1 1 1
theatre/musical/opera/ballet 14%
Football Golf Rugby Cricket Horse racing
Canada All markets
Source: International Passenger Survey by ONS 2011 and 2016
33Market and Trade Profile Canada
2.1 Inbound activities
Propensity to go for a walk or cycle Propensity to visit a park or garden and a National
Park
19%
Holiday: Walking along the coast 11% 19%
VFR: Visiting a National Park
1% 6%
Holiday: Cycling 2%
37% 58%
Holiday: Walking in the countryside VFR: Visiting parks or gardens
26% 32%
4%
Business: Walking along the coast 1% 2%
Holiday: Visiting a National Park
1% 11%
Business: Cycling 0%
20%
Business: Walking in the countryside 10% Holiday: Visiting parks or gardens
5% 50%
21%
VFR: Walking along the coast 12%
11% Business: Visiting a National Park
1%
2%
VFR: Cycling 2%
40%
36% Business: Visiting parks or gardens
VFR: Walking in the countryside 28% 7%
All journey purposes: Walking along 15% All journey purposes: Visiting a 14%
the coast 8%
National Park 7%
1%
All journey purposes: Cycling 1% All journey purposes: Visiting parks 43%
All journey purposes: Walking in the 29% or gardens 32%
countryside 20%
Canada All markets
Canada All markets
Source: International Passenger Survey by ONS 2010 and 2016
34Market and Trade Profile Canada
2.1 Inbound activities
Propensity to go to a pub and socialise with locals Propensity to go dining in restaurants, or to go to bars
or night clubs
60% 11%
VFR: socialising with the locals 45%
VFR: went to bars or night clubs
14%
VFR: dining in restaurants 77%
60% 62%
VFR: went to pub 49% 60%
VFR: went to pub
49%
Holiday: socialising with the 43% Holiday: went to bars or night clubs 19%
15%
locals 32%
85%
Holiday: dining in restaurants
58% 70%
Holiday: went to pub 48% Holiday: went to pub 58%
48%
Business: socialising with the 32% Business: went to bars or night clubs
6%
13%
locals 15%
Business: dining in restaurants 78%
49%
45%
Business: went to pub 24% Business: went to pub
24%
45%
13%
All journey purposes: 47% All journey purposes: went to bars or night clubs
12%
socialising with the locals 32%
All journey purposes: dining in restaurants 76%
61%
All journey purposes: went to 55%
All journey purposes: went to pub 55%
pub 42% 42%
Canada All markets
Canada All markets
Source: International Passenger Survey by ONS, 2008 (dining in restaurants) and 2017 (all other activities)
35Market and Trade Profile Canada
2.1 Inbound activities
Propensity to go shopping during visits to the UK Propensity to purchase selected items
21% 43%
Business: went Clothes or shoes 41%
shopping 13%
37% Personal accessories e.g. jewellery 10%
Bags, purses etc 8%
9%
69% Cosmetics or toiletries e.g. perfume 10%
Holiday: went 12%
shopping 15%
74% Books or stationery 13%
Games, toys or gifts for children 9%
9%
Food or drink 21%
61% 24%
VFR: went shopping 5%
CDs, DVDs, computer games etc 5%
64%
Electrical or electronic items e.g.… 1%
3%
Items for your home e.g. furnishing 2%
54% 3%
All journey purposes:
Other holiday souvenir (not… 23%
went shopping 16%
61%
None of these 33%
38%
All markets Canada
Canada All markets
Source: International Passenger Survey by ONS, 2017 (shopping) and 2013 (purchase of selected items)
36Market and Trade Profile Canada
2.2 Welcome and recommending Britain
Feeling of ‘welcome’ in Britain Likelihood to recommend Britain
84%
82%
86%
82%
14% 15% 15%
12%
2% 2% 0.4% 2% 2%
0.3% 0.2% 0.4% 0% 0% 0% 0%
Very Welcome Neither Unwelcome Very Extremely Likely Neutral Unlikely Not likely at
Welcome Unwelcome likely all
Canada All market average Canada All market average
Source: International Passenger Survey by ONS,
37Market and Trade Profile Canada
2.3 Perceptions of Britain
Canadians rated Britain 2nd out of fifty nations for Tourism and 4th for
Culture and People. They ranked Britain highly for urban attractions
(3rd) and historic buildings (4th) but less so for scenic natural beauty
Britain is the
(21st).
The cultural product that Canadians most strongly associated with 2nd strongest
Britain is museums. nation brand
A trip to Britain would be expected to be ‘educational’, ‘fascinating’ among 50 nations
and/or ‘exciting’ by many Canadians.
The USA and Australia are the destinations that Canadians consider
the ‘best place’ for delivering the things they most want from a
holiday destination.
Canadians rate Great Britain highly for being a good place to visit
world famous sites and history/ historic sites.
Activities that appeal to potential visitors from Italy include driving
through the countryside of England, riding the scenic ‘Hogwarts
Express’, taking a canal boat tour through the waterways of England
and enjoying a traditional afternoon.
Source: Anholt Nation Brands Index, powered by Ipsos 2018, Arkenford 2013, VisitBritain/IPSOS 2016
38Market and Trade Profile Canada
2.3 Perceptions of Britain
UK’s ranking (out of 50 nations)
Measure Canadian All
respondents respondents
Overall Nation Brand 6 4
Culture (overall) 7 5
The country has a rich cultural heritage 10 7
The country is an interesting and exciting place for contemporary culture such as
6 3
music, films, art and literature
The country excels at sports 7 5
People (overall) 9 7
If I visited the country, the people would make me feel welcome 13 16
Tourism (overall) 7 4
Would like to visit the country if money was no object 9 6
The country is rich in natural beauty 21 26
The country is rich in historic buildings and monuments 5 5
The country has a vibrant city life and urban attractions 6 4
Source: Anholt Nation Brands Index, powered by Ipsos 2019
39Market and Trade Profile Canada
2.3 Perceptions of Britain
Cultural associations with the UK Adjectives describing a potential trip the UK
49% Educational 44%
Museums 35%
47%
41% Fascinating 33%
Music 32%
43%
42% Exciting 31%
Films 31%
39%
32% Relaxing 23%
Sports 21%
37%
28% Romantic 14%
Modern Design 17%
31%
23% None 21%
Pop videos 16%
27%
22% Spiritual 7%
Opera 9%
25%
Sculpture 24% Stressful 6%
23% 8%
None 23% Boring 6%
15% 6%
Street Carnival 12% Risky 5%
14% 5%
Circus 11% Depressing 3%
11% 5%
Canada All 20 markets
Canada All 20 markets
Source: Anholt Nation Brands Index, powered by Ipsos 2018
40Market and Trade Profile Canada
2.3 Perceptions of Britain
Holiday wants and % saying destination is best place for…
Importance Attribute (20 most important) GB FR IT AU US GE
6.17 Have fun and laughter 14% 11% 15% 31% 38% 11%
6.15 Offers good value for money 8% 10% 12% 13% 46% 9%
6.12 Enjoy the beauty of the landscape 27% 38% 54% 59% 29% 22%
6.00 The people are friendly and welcoming 24% 19% 28% 44% 25% 15%
5.99 Explore the place 31% 27% 37% 42% 24% 17%
5.96 Do something the children would really enjoy 24% 19% 26% 41% 62% 15%
5.88 See world famous sites and places 56% 60% 63% 26% 29% 39%
5.85 Experience things that are new to me 22% 34% 43% 56% 16% 32%
5.78 Enjoy local specialities (food and drink) 16% 53% 67% 20% 18% 34%
5.75 Soak up the atmosphere 24% 39% 49% 49% 16% 13%
5.75 Enjoy peace & quiet 9% 15% 19% 28% 18% 8%
5.72 It offers unique holiday experiences 32% 40% 48% 53% 33% 28%
5.68 Do what I want when I want spontaneously 13% 18% 16% 27% 47% 13%
5.66 Provides a wide range of holiday experiences 28% 33% 37% 41% 50% 24%
5.58 Broaden my mind/ Stimulate my thinking 30% 35% 42% 34% 20% 28%
5.57 Have dedicated time with my other half 32% 46% 47% 33% 37% 23%
5.55 Experience activities/places with a wow factor 25% 31% 42% 48% 23% 20%
5.55 Get some sun 5% 14% 26% 51% 39% 5%
5.54 Visit a place with a lot of history/historic sites 59% 58% 66% 15% 24% 41%
5.54 A good place to visit at any time of year 14% 20% 26% 38% 41% 13%
5.52 Enjoy high quality food and drink (gourmet food) 10% 64% 61% 11% 23% 15%
5.49 Chill/ slow down to a different pace of life 10% 14% 27% 24% 19% 5%
Source: VisitBritain/Arkenford 2013, base: international travellers from Canada
41Market and Trade Profile Canada
2.3 Perceptions of Britain
Holiday wants and % saying destination is best place for…
Importance Attribute (20 most important) GB FR IT AU US GE
5.46 Be physically healthier 19% 24% 26% 33% 23% 16%
5.35 Feel connected to nature 17% 14% 15% 58% 37% 11%
5.32 Easy to get around by public transport 34% 26% 20% 14% 38% 21%
5.11 Revisit places of nostalgic importance to me 28% 12% 20% 6% 31% 8%
5.09 Feel special or spoilt 12% 30% 45% 34% 26% 10%
5.06 Meet the locals 13% 18% 20% 43% 55% 8%
5.03 Get off the beaten track 16% 13% 13% 50% 25% 11%
4.96 Good shopping 20% 34% 31% 12% 65% 10%
4.85 Visit places important to my family's history 30% 14% 13% 8% 16% 10%
4.58 Meet and have fun with other tourists 8% 7% 33% 41% 36% 29%
Do something environmentally sustainable/
4.51 12% 18% 21% 38% 27% 16%
green
4.49 Experience adrenalin filled adventures 17% 16% 24% 34% 25% 20%
Go somewhere that provided lots of laid on
4.44 31% 31% 35% 28% 56% 23%
entertainment/nightlife
4.32 To participate in an active pastime or sport 26% 12% 18% 30% 53% 18%
4.13 Party 16% 29% 35% 30% 48% 20%
4.02 Fashionable destination 23% 56% 57% 26% 27% 14%
Do something useful like volunteering to help
3.98 8% 17% 20% 19% 31% 11%
on a project
3.95 Watch a sporting event 19% 17% 20% 18% 68% 17%
Source: VisitBritain/Arkenford 2013, base: international travellers from Canada
42Market and Trade Profile Canada
2.3 Perceptions of Britain
Motivations for choosing Britain as a holiday destination
41%
Cultural attractions 42%
26%
Wide variety of places to visit 25%
25%
Wanted to go somewhere new 23%
18%
Vibrant cities 22%
25%
Countryside/natural beauty 22%
23%
Easy to get around 22%
21%
Somewhere English-spoken 22%
24%
Visiting friends or relatives 22%
16%
Ease of getting to the country 21%
15%
A culture different from own 19%
22%
A mix of old and new 19%
15%
Contemporary culture 18%
24%
Try local food and drink 18%
14%
A good deal 18%
26%
Security / safety 17%
14%
Accommodation (variety & quality) 16%
14%
Easy to get plan/organise 16%
14%
Meeting locals 13%
17%
Wide range of holiday activities 13%
14%
The climate / weather 12%
11%
Cost of staying in the destination 12%
8%
Watching sport 10%
4%
Visit a film/TV location 9%
Easy to visit with children 7%
8% Canada All markets
Source: VisitBritain/IPSOS 2016, base: visitors (Market scores have been adjusted so that the sum of all
motivations for each market is equivalent to the global total, to enable meaningful comparisons)
43Market and Trade Profile Canada
2.3 Perceptions of Britain
Sought-after Britain activities
Drive through the countryside of England 58%
53%
A food tour of one of London's best foodie markets 57%
52%
Ride the scenic ‘Hogwarts Express' (Harry Potter train) through the Scottish… 54%
47%
Take a canal boat tour through the waterways of England 53%
53%
Enjoy a traditional afternoon tea 50%
50%
Stay the night in a fairy-tale castle 49%
47%
Visit Windsor Castle where Harry and Meghan got married 49%
40%
Spot wildlife in the Scottish Highlands 47%
42%
A wine tour in the vineyards of England 43%
36%
Shop for quirky gifts in a seaside town 42%
41%
Walk along Hadrian's wall in Northern England 42%
38%
Share stories over a pint with locals in a cosy rural pub 42%
38%
Explore Britain's history using a historic cities app to uncover the stories 41%
38%
Visit Madame Tussauds 40%
42%
Hunt for The Loch Ness Monster with a boat cruise on Loch Ness 40%
32%
Relax in Bath spa's rooftop pool 39%
36%
Go hiking on the South West coast 39%
41%
Take a street art tour in one of Britain's modern cities 39%
40%
Explore the Beatles Story in their home city of Liverpool 35%
32%
Visit locations from my favourite TV/film shows filmed on location in Britain 33% Canada All markets
34%
Source: Anholt Nation Brands Index, powered by Ipsos 2018; Rankings based on market-level scores that have been adjusted so that the sum of all activities for each market is equivalent to the all-market total,
to enable meaningful comparisons, including across markets. Top 20 activities shown; for full list please see report at https://www.visitbritain.org/understanding-international-visitors
44Market and Trade Profile Canada
Chapter 3:
Understanding
the market
45Market and Trade Profile Canada
3.1 Structural drivers: general market overview
Demographics & society
Canada’s population reached 37.5 million in 2019 and is expected to grow
gradually over the next decade. Immigrants, who primarily reside in the
largest urban areas of Canada, will drive this growth.
Canada has a
population of
Canada has an aging population with 18% aged 65 years or over compared
to 16% of those aged under 15 years. The aging population is set to 37.5 million
continue to grow with almost one in four seniors likely to be aged 85 or people
older by 2051.
Canada is a culturally diverse country. Over 20% of the total Canadian
population is foreign-born.
Canada’s economy experienced weak growth in 2018 influenced in part by
US-China tensions and lower oil prices from a global slowdown. Economic
growth is expected to remain below potential through 2020, then gradually
return to a sustainable long term trend of about 1.5%.
The weaker pound following the Brexit vote has made it more affordable for
Canadians to travel to Britain.
Source: Oxford Economics, CIA World Factbook 2019, Statistics Canada
46Market and Trade Profile Canada
3.1 Structural drivers: demographic and social indicators
Population dynamics The Canadian population reached 37.5 million in 2019
and is expected to grow in the next decade. Canada
recorded the strongest population growth of all G7
Measure 2019 countries in the period 2011-2016 (+6%)
estimate Canada has an aging population with the median age
expected to reach 45 by 2050. Canada’s median age is
Total population 37.482,210 slightly older than the USA’s. In 2019, 18% of the
population was aged 65 years or over compared to 16%
Overall growth rate vs 2018 +1.32% of those aged 15 or under. It is projected that by 2051,
one in four seniors will be aged 85+.
Net No. migrants per Over 20% of Canada’s population is foreign born (the
5.7
1,000 population in 2018 highest among the G8 countries). Historically immigrants
Average annual rate of population from European countries accounted for most of the
1.20%
change in 2015 - 2020 immigrant source countries but post-1970s its largest
source of immigrants have come from Asia and the
Indicator 2010 2020 2030 2050 Middle East.
Canada has a high level of urbanisation with 83% of its
population living in urban areas. Toronto and Montreal
Median age (in years) 36.9 41.1 43.0 45.5 are the largest cities, holding almost 8% and 5% of
Canada’s population. Ontario is Canada’s most populous
province.
Source: Oxford Economics, CIA World Factbook 2019, Statistics Canada
47Market and Trade Profile Canada
3.1 Structural drivers: economic indicators
Economic indicators
(% growth unless stated) Canada’s economy experienced weak growth in 2018
influenced in part by US-China tensions and lower oil
prices from a global slowdown. Economic growth is
Indicator 2018 2019 2020 2021 expected to remain below potential through 2020, then
gradually return to a sustainable long term trend of about
1.6%. Consumer spending is up but business confidence
Real GDP 2.0% 1.7% 1.4% 1.6% has been declining since April 2018.
The composition of Canada’s economy is made up of
Consumer spending 2.1% 1.6% 1.5% 1.9%
services (70%), industry (28%) and agriculture (2%).
Unemployment rate 5.8% 5.7% 5.8% 6.0% Many Canadians enjoy a high standard of living with
GDP per capita in purchasing power parity terms of over
47,000 US Dollars, forecasted to increase in the years to
Measure 2019 come. This is around 80% of the GDP per capita of the
USA.
GDP per capita PPP (US$) 47,386 According to Capgemini, Canada counted 362,000 High
Annual average GDP growth over Net Worth Individuals (HNWI) in 2018 (down 4% on
2.2 2017); these are defined as people with investible assets
past decade (%)
worth more than $1 million. Canada ranks 8th place
Annual GDP growth in 2019 (%) 1.7 among the countries with the highest number of HNWI’s.
Source: Oxford Economics, CIA World Factbook 2019, Trading Economics, Capgemni World Wealth Report 2019,
48Market and Trade Profile Canada
3.1 Structural drivers: exchange rate trends
Exchange rate trends (cost of GBP in CAD)
2.80
2.60
2.40
2.20
2.00
1.80
1.60
1.40
1.20
1.00
2001
2002
2003
2004
2005
2006
2007
2008
2009
2010
2011
2012
2013
2014
2015
2016
2017
2018
2019
Please visit our website to find the most up-to-date exchange rate trend based on monthly averages
Source: Bank of England
49Market and Trade Profile Canada
3.2 Consumer trends
• Canada’s outbound travel market grew 7% between 2013
and 2018, and is forecasted to grow by 12% in the next five
years.
• An important reason for the growing outbound travel Most Canadian
market is recent economic growth, boosting Canadian outbound trips are
consumer spending, as well as a strong dollar. from Ontario,
• A growing segment of Canada’s outbound travel market are
those aged 65 years and older. This group has a natural
British Columbia
interest in Europe’s history. and Quebec.
• The USA has always been the most popular outbound
destination for Canada, receiving 55% of Canadian
overnight trips abroad in 2018. Other American destinations
such as Mexico, Cuba and the Dominican Republic are
also popular. Within Europe; France, Italy and the United
Kingdom are favourite destinations for Canadian overnight
visitors.
Sources: Oxford Economics, Statistics Canada
50Market and Trade Profile Canada
3.2 Consumer trends: overall travel trends
Travel trends Destination of overnight visits abroad in 2018
• Almost 6 in 10 overnight outbound trips from Canada 3%
were made for leisure purposes in 2018.
• Those born between 1946 and 1965, the so called 10%
baby boomers, are gradually retiring. This age group
has a high desire to travel and moreover, often have
the financial resources to do so. Europe’s history, 16%
culture, gastronomy and scenic beauty are appealing
to these older travellers and their propensity to
research their ancestry is relatively high. 71%
• Canada is a culturally diverse country, with over 20%
of the total Canadian population being foreign-born.
This explains the relatively high demand for travel to
visit friends and relatives in their country of origin. Americas Europe
• Nearly three quarters of overnight trips outside Asia Pacific Africa & Middle East
Canada were spent in the Americas in 2018, mostly in
the USA. 16% of all overnight visits were spent in • 16% of overnight visits were spent in Europe in
Europe in 2018. 2018. This share has slowly grown over the past
few years.
Source: Statistics Canada, Conference Board of Canada, Oxford Economics, ETC
51Market and Trade Profile Canada
3.3 Booking and planning
• A large proportion of Canadian holiday visitors
tend to start thinking about their trip early, with
59% doing this as early as half a year or more in
advance.
59%
of Canadian visitors
• 37% of travellers booked in the three to six start thinking about
months window before the arrival to Britain. their trip to Britain
Almost one fifth of travellers booked last-minute 6+ months in
(within one month before arrival). advance
• More than half of Canadian travellers to Britain
book travel and accommodation together (52%),
mostly online (71%).
• Canadian visitors book holiday activities both
before and/or during their trip. Sporting tickets
and guided sightseeing tours are more likely to
be booked prior to the trip.
Source: VisitBritain/IPSOS 2016, base: visitors
52Market and Trade Profile Canada
3.3 Booking and planning: booking channels and ticket sales
How trips to Britain were booked: travel only How trips to Britain were booked: accommodation only
Booking method Canada All markets Booking method Canada All markets
Online 79% 85% Online 66% 70%
Face-to-face 9% 10% Face-to-face 6% 7%
By phone 11% 4% By phone 5% 3%
Don’t know 2% 1% Did not book/stayed with
23% 17%
friends/relatives
Don’t know 0% 2%
Most Canadians book their trip to Britain online,
especially when they book their transport. The
majority of online bookings are made via a How trips to Britain were booked: travel and
laptop/desktop; Canadians are less likely to use accommodation (holiday)
mobile devices to make bookings. Booking method Canada All markets
More than half of Canadian visitors to Britain book
their travel and accommodation together (52% of Online 71% 64%
visitors). About one in five bookings were made face Face-to-face 21% 27%
to face for these holiday packages.
By phone 7% 8%
Don’t know 1% 1%
Source: VisitBritain/IPSOS 2016, base: visitors (if not otherwise specified), online survey
53Market and Trade Profile Canada
3.3 Booking and planning: booking channels and ticket sales
Propensity to make a purchase before or during trip
42% 41%
34%
30% 31% 31% 31%
28% 28% 28% 28%
26%
23% 23% 24% 22% 22%
19%
15%
11%
Pre During Pre During Pre During Pre During Pre During
Theatre / Musical / Sporting event Guided sightseeing Guided sightseeing Tickets / passes for
Concert tickets tickets tours in London tours outside of other tourist
London attractions
Canada All markets
Many Canadian visitors book holiday activities before and/or during their trip.
Sporting tickets and guided sightseeing tours are more likely to be booked prior to the trip. Tickets or passes for other tourist
attractions are more likely to be booked during the trip. An equal share of tickets for theatre, musicals and concerts are being
booked prior or during the trip.
Source: VisitBritain/IPSOS 2016, base: visitors (if not otherwise specified), online survey
54Market and Trade Profile Canada
3.3 Booking and planning: lead-times
Decision lead-time for visiting Britain
Starting to think about trip Deciding on the destination
Lead time Canada All markets Lead time Canada All markets
6+ months 59% 45% 6+ months 42% 32%
3-6 months 29% 31% 3-6 months 37% 38%
1-2 months 6% 13% 1-2 months 14% 19%
Less than 1 month 5% 5% Less than 1 month 5% 7%
Don’t know 1% 3% Don’t know 2% 3%
Looking at options/prices Booking the trip
Lead time Canada All markets Lead time Canada All markets
6+ months 28% 21% 6+ months 18% 14%
3-6 months 39% 37% 3-6 months 37% 32%
1-2 months 23% 27% 1-2 months 24% 28%
Less than 1 month 8% 12% Less than 1 month 19% 21%
Don’t know 2% 4% Don’t know 2% 5%
Source: VisitBritain/IPSOS 2016, base: visitors
55Market and Trade Profile Canada
3.3 Booking and planning: lead-times
Decision lead-time for visiting Britain: commentary (tables on previous page)
Canadian travellers to Britain show a higher tendency to start thinking earlier about their trip to Britain than the global
average. 59% start thinking about their trip more than six months in advance compared to 49% across all markets.
42% of Canadian travellers made their decision to travel to Britain more than six months before the actual journey;
another 37% made their decision three to six months before departure.
Almost 4 in 10 Canadian visitors looked at options and prices between three and six months ahead of the trip and an
almost equal share booked their trip in that same time frame.
More than half of Canadians book their travel and accommodation together. 55% of Canadians that book such a
combined holiday make use of a travel agent / tour operator / travel comparison website. 23% book their combined
holiday directly with the transport company and another 22% book directly with the accommodation provider.
Source: VisitBritain/IPSOS 2016, base: visitors
56Market and Trade Profile Canada
3.4 Reaching the consumer
Friends and relatives play an important role for Canadian
travellers when choosing their destination. Other
influential sources for destination choice are price
comparison websites, websites providing travellers’
reviews and information from search engines.
Over three quarters of Canadians aged 18 years or over Mobile makes
own a smartphone and more than half own a tablet. up one third of
In 2018, time spent with digital media grew 2.6% in
Canada and surpassed that of traditional media for the
all media time
first time. Mobile makes up almost a third of all media for Canadians
time, exceeding 3 hours a day.
Almost half of Canadians say they purchased a product or
service online using their mobile device – up from just
12% in 201.
Facebook and YouTube are the most used social media
platforms in Canada, followed by Instagram and Twitter.
Source: VisitBritain/IPSOS 2016, Insights West, eMarketer, CIRA
57Market and Trade Profile Canada
3.4 Reaching the consumer
Broadcast media
• Canadians aged 18+ spent on average 27 hours per week watching TV.
• Online TV viewing has increased significantly with those aged 18+ watching 3.4 hours of Internet television per
week.
Newspapers
• Around 9 out of 10 adults read newspapers, in either print or digital format, at least once a week.
• 83% of newspaper readers are accessing at least some of their newspaper content online.
• Millennial readership peaks early in the morning and Boomer readership peaks early and late in the day
• Daily newspapers with the highest number of circulations in 2019 were The Globe and Mail, Toronto Star, La
Presse, Le Journal de Montréal, 24 Hours Toronto and Metro Toronto.
Radio
• Radio is an important media channel for Canadians - those aged 18+ listened to 15 hours of radio per week.
• This time is being spent on AM/FM radio (61%), owned music e.g. CDs or digital music files (16%), streaming
audio (9%), TV music channels (6%) or other audio sources (8%).
• Digital radio is a growing channel with 38% of 16-34s owning a digital radio.
Source: CTRC, Foresight Factory, Edison research – share of ear, News Media Canada, Agility PR
solutions, Insights West
58Market and Trade Profile Canada
3.4 Reaching the consumer
Magazines
• Chatelaine, Canadian Living, Style At Home, Zoomer, Coupe De Pouce, Canadian House & Home, Maclean’s
and Reader’s Digest (Canadian English Edition) are among the Canadian magazines with the highest
circulation.
Online media
• 88% of internet access of on desktops/laptops whilst 82% is spent on smartphones.
• The social networks with the highest weekly usage in Canada are Facebook (82%), YouTube (63%), Instagram
(39%), Twitter (29%) and Pinterest (20%).
• Messaging apps are growing in Canada – Facebook Messenger, Skype, iMessage and Whatsapp are the most
used.
Source: CTRC, Foresight Factory, Edison research – share of ear, News Media Canada, Agility PR
solutions, Insights West
59Market and Trade Profile Canada
3.4 Reaching the consumer: social media on holiday
Use of social media on holiday • Almost 7 out of 10 Canadian international
travellers used social media during their last
holiday abroad, on par with the all-market
To keep in touch with people at home 42% average.
44%
35%
• 42% of international travellers from Canada used
To post / upload photos of my holiday
39% social media during their holiday to keep in touch
Look for recommendations for places to eat or 22% with people at home. 35% of Canadian travellers
drink 30%
I have not used social media at all on this type of 32%
used social media to post or upload photos of
holiday 29% their holiday.
Share with others where you are / what you are 22%
doing while on holiday 29% • Facebook dominates the social media platforms
To let people know where I am at a given moment 21% in Canada in terms of daily usage, followed by
(e.g. checking in on Facebook) 25% YouTube, Instagram and Twitter.
To help you plan / decide where to go or what to 17%
see or what to do 23% • In general, 46% of Canadian international
Ask for advice on where to go or what to do 12% travellers tend to use the tablet/smartphone for
20%
Share my own advice or recommendations about
general internet use rather than a laptop/desktop.
12%
visiting where I am 19% This is lower than the global average (56%).
• In general, 39% enjoy writing reviews of places
they have been to on holiday on social media and
Canada All markets 58% place trust in social media reviews from
other tourists.
Source: VisitBritain/IPSOS 2016, base: all respondents: Have you used social media in any of the following ways whilst on your last holiday to Britain (visitors) /on your last holiday to a foreign
destination (considerers)?
60Market and Trade Profile Canada
3.4 Reaching the consumer: influences
Influences on destination choice
49%
Talking to friends / relatives / colleagues 40%
38%
Information from search engines [e.g. Google] 33%
39%
Looking at prices of holidays/flights on price comparison websites 31%
38%
Websites providing traveller reviews of destinations [e.g. TripAdvisor] 30%
31%
Talking to friends or family in your social network (e.g. via Facebook / Twitter) 26%
27%
An accommodation provider/ hotel website 26%
24%
A travel guidebook 25%
21%
Travel agent or tour operator website 25%
21%
Travel blogs / forums 22%
13%
Travel programme on TV 19%
21%
A special offer or price deal you saw advertised online 19%
15%
Travel agent or tour operator brochure 18%
15%
An official tourist organisation website or social media site for the country or destination 18%
18%
An official tourist brochure for the country / city / region 17%
14%
A travel feature / article in a magazine or newspaper 16%
14%
Direct advice from a travel agent/tour operator (face-to-face, over the phone) 16%
14%
Images or videos your friends or family have posted to social media 15%
15%
Images / information in online adverts 15%
14%
A special offer or price deal you saw advertised offline e.g. in a newspaper, magazine or on TV 15%
11%
Images or videos from a photo/video sharing social network site 14%
13%
Travel app 14%
9%
Images / information in adverts in a magazine or newspaper 12%
10%
Articles on an online encyclopaedia e.g. Wikipedia, Wikitravel 12%
9%
Images / information in TV adverts 11%
8%
Seeing social media posts from celebrities talking about their holiday destinations 9%
7%
Images / information on billboards / poster adverts 9%
6%
Travel programme on radio 6%
6%
Information in radio adverts 6%
Canada All markets
Source: VisitBritain/IPSOS 2016, base visitors & considerers. Which of the following sources influenced your choice of destination? (Market scores have been adjusted so that the sum of all influences
for each market is equivalent to the global total, to enable meaningful comparisons)
61You can also read