Mapping biodiversity hotspots of fish communities in subtropical streams through environmental - DORA 4RI
←
→
Page content transcription
If your browser does not render page correctly, please read the page content below

www.nature.com/scientificreports
OPEN Mapping biodiversity hotspots
of fish communities in subtropical
streams through environmental
DNA
Rosetta C. Blackman 1,2,3,9*, Maslin Osathanunkul 1,4,5,9, Jeanine Brantschen 1,2,
Cristina Di Muri 6, Lynsey R. Harper 6,7, Elvira Mächler 1,2,8, Bernd Hänfling 6 &
Florian Altermatt 1,2,3*
Large tropical and subtropical rivers are among the most biodiverse ecosystems worldwide, but also
suffer from high anthropogenic pressures. These rivers are hitherto subject to little or no routine
biomonitoring, which would be essential for identification of conservation areas of high importance.
Here, we use a single environmental DNA multi-site sampling campaign across the 200,000 km2 Chao
Phraya river basin, Thailand, to provide key information on fish diversity. We found a total of 108 fish
taxa and identified key biodiversity patterns within the river network. By using hierarchical clustering,
we grouped the fish communities of all sites across the catchment into distinct clusters. The clusters
not only accurately matched the topology of the river network, but also revealed distinct groups of
sites enabling informed conservation measures. Our study reveals novel opportunities of large-scale
monitoring via eDNA to identify relevant areas within whole river catchments for conservation and
habitat protection.
Tropical and subtropical regions are among the most biodiverse systems g lobally1,2. Freshwater rivers in these
regions are particular hotspots of biodiversity, with up to a third of global freshwater fish species found in the
Amazon, Congo and Mekong river basins alone, most of which are endemic to these areas3. These extraordinary
systems not only contribute strongly to global biodiversity, they also provide essential ecosystem services, such as
drinking water and are a key protein source for local human populations4. The biodiversity within these systems
is also essential to maintain their natural function and the services they provide5. However, tropical freshwater
ecosystems and the biodiversity therein are subject to substantial anthropogenic pressures, such as change in land
use, damming, direct exploitation of organisms, global climate change, pollution and the introduction of invasive
species5–8. For example, dam construction and the loss of free-flowing rivers is causing excess siltation, barriers to
fish migration and changes in hydrology, which is detrimental to the biodiversity and ecosystem services in these
rivers1,3,9,10. These rivers are also notably more vulnerable to the effects of global climate change, with increased
temperature and reduced flows likely to have significant effects on these systems in the immediate f uture2,10.
Conservation and management of tropical and subtropical freshwater systems depends on accurate, fast and
reproducible knowledge on the state of b iodiversity11. Often, however, even basic identification of biodiversity
patterns within these systems are limited, due to their large scale or lack of monetary resources available7. Con-
sequently, accurate baseline biodiversity information is generally non-existent or patchy in coverage, and little
1
Department of Aquatic Ecology, Eawag, Swiss Federal Institute of Aquatic Science and Technology,
Überlandstrasse 133, 8600 Dübendorf, Switzerland. 2Department of Evolutionary Biology and Environmental
Studies, University of Zürich, Winterthurerstr. 190, 8057 Zürich, Switzerland. 3Research Priority Programme
Global Change and Biodiversity (URPP GCB), University of Zurich, Winterthurerstr. 190, 8057 Zurich,
Switzerland. 4Department of Biology, Faculty of Science, Chiang Mai University, Chiang Mai 50200,
Thailand. 5Research Centre in Bioresources for Agriculture, Industry and Medicine, Chiang Mai University, Chiang
Mai, Thailand. 6Evolutionary and Environmental Genomics Group (EvoHull), School of Biological and Marine
Sciences, University of Hull, Hull HU6 7RX, UK. 7School of Biological and Environmental Sciences, Liverpool John
Moores University, Liverpool L3 3AF, UK. 8Department for Infectious Diseases and Pathobiology, Vetsuisse Faculty,
Centre for Fish and Wildlife Health, University of Bern, Länggassstrasse 122, 3012 Bern, Switzerland. 9These
authors contributed equally: Rosetta C. Blackman and Maslin Osathanunkul. *email: rosiecblackman@gmail.com;
florian.altermatt@eawag.ch
Scientific Reports | (2021) 11:10375 | https://doi.org/10.1038/s41598-021-89942-6 1
Vol.:(0123456789)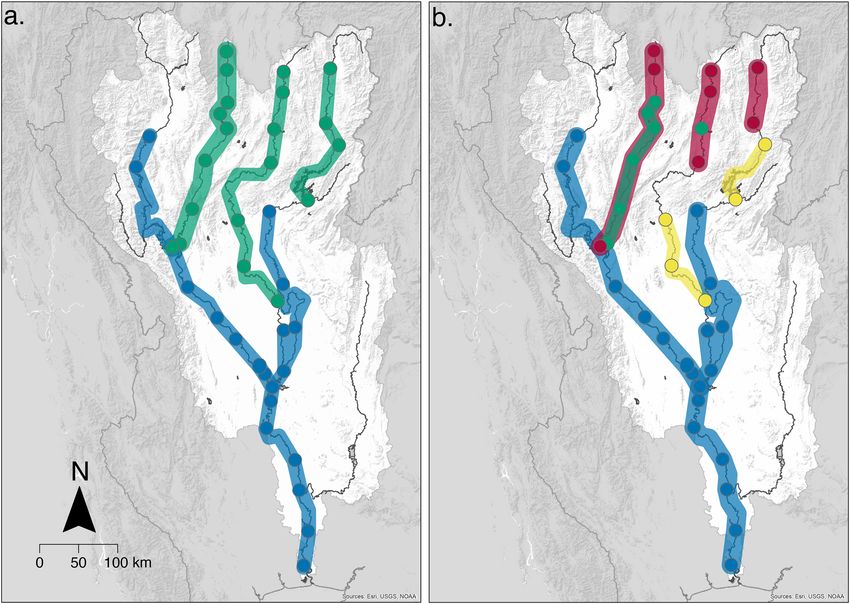
www.nature.com/scientificreports/
is known about the current distribution of species and the general status of biodiversity, even for charismatic
groups such as fish6. Without this information, we risk being unable to identify community changes, species
extinctions and, ultimately, biodiversity reduction at local, regional and global scales.
Identifying species distributions and patterns (specifically local and among-community diversity, i.e., α- and
β-diversity, respectively) is the first step towards successful conservation12. It allows biogeographical clusters
or regions to be established based on community data, and the designation of relevant conservation units.
First described by Wallace in 187613, this is a well-established and essential method in protecting key areas for
conservation. Although division of land- and sea-scapes due to their assemblage of taxonomic groups (family,
genus or species level data) is a common approach in ecological and evolutionary studies at global s cales14–16, it
also has direct application for regional and local c onservation16. By identifying distinct clusters in continuous
species distributions within a river catchment, it is possible to recommend priority areas for conservation at a
finer spatial scale.
With the advent of environmental DNA (eDNA) metabarcoding, studies have quickly demonstrated its huge
potential to monitor target taxa and communities on a landscape s cale17–19. The approach is based on the isolation
of DNA from water samples and subsequent High-Throughput-Sequencing of PCR amplified DNA barcodes.
The selection of suitable PCR primers allows the identification of species from specific taxonomic groups present
in an e cosystem20. This approach has been used to assess species richness of fish in different temperate aquatic
systems21–25, providing crucial information for fisheries and conservation management26. So far, however, this
has not yet been scaled to spatially very large, species-rich systems, and eDNA studies of fish within tropical
and subtropical riverine ecosystems have focused mainly on the detection of individual species, using a species-
specific approach (e.g.,12,27–29). Although eDNA metabarcoding has the potential for community-wide assessment,
attempts to gather the much-needed baseline biodiversity data from tropical and subtropical hotspots have so
far been l imited30–32. By being highly scalable, non-invasive to the taxa being detected, and allowing prediction
of diversity patterns across whole riverine s ystems33,34, it is offering an unprecedented opportunity to monitor
freshwater habitats on a landscape scale.
Here, we use eDNA metabarcoding to assess fish diversity patterns in a global biodiversity hotspot the Chao
Phraya catchment, Thailand. This catchment comprises four tributaries: Nan, Ping, Wang and Yom, which
combine to form the main Chao Phraya river (Fig. 1a and Supplementary Information Fig. S1). The catchment
covers over 200,000 km2. Only limited biodiversity surveys have focused on the middle and lower reaches of the
catchment, where a high number of threatened and endemic freshwater fish species have been recorded, therefore
it represents a major centre of species richness6. As with many rivers in Asia, the Chao Phraya is under increasing
anthropogenic pressures and remains poorly s urveyed6,35. We extracted DNA from 234 water samples collected
from 39 sites across the basin. We analysed the eDNA for fish communities using two primer pairs which amplify
different sections of the mitochondrial 12S region and are vertebrate-specific (Kelly primer pair)36,37, and fish
specific (MiFish primer pair)38 respectively. Amplicons were sequenced on the Illumina MiSeq platform, and
sequencing data were bioinformatically cleaned and assigned to 249 reference sequences of fish species (see
“Methods” section). Although the distribution of species without reference sequences cannot be evaluated with
this approach, our reference database comprises 54% of all fish species known or suspected to be present in the
Chao Phraya river basin and includes species from most families and ecological guilds. We thereby captured
an unprecedented and unbiased fingerprint of the freshwater fish diversity within the catchment and identified
possible areas of conservation importance, proving that acquisition of biodiversity data, even at large scales, shall
no longer be a limiting factor for the assessment and implementation of biodiversity-conservation measures in
tropical and subtropical lotic systems.
Results
After bioinformatic clean-up and removal of low frequency reads, across all samples a total of 5,825,212 and
4,927,576 reads were assigned to Fish Taxa (hereafter FT, see “Methods” section) found in the custom-built
reference database for Kelly and MiFish primers, respectively. On average 149,364 and 126,348 reads were
assigned to each of the 39 sites sampled for the Kelly and MiFish libraries, respectively. From the two libraries,
we successfully detected 108 distinct FT: 82 with the Kelly primer and 93 with the MiFish primer. Of the 108 FT
found in the combined dataset, 67 (62%) FT were found with both primer pairs, 15 (14%) were unique to the
Kelly dataset and 26 (24%) were unique to the MiFish dataset. The detection of FT unique to one primer dataset
was in some cases due to the lack of reference sequences for one of the two marker regions. The Kelly primer
detected only one FT not present in the MiFish reference database, and the MiFish primer detected six FT not
in the Kelly reference database (see Supplementary Information Table S2 and S3). Overall, there was a highly
significant correlation between read abundance generated by the two primer sets for each FT in the datasets
(R = 0.37, p = 0.002, see Supplementary Information Fig. S2). To examine α- (local) and β- (among-community)
diversity, we combined all six replicates taken at each site (two replicates from each site location at right bank,
centre and left bank, respectively (see Supplementary Information Fig. S3 for proportion of taxa found in each
replicate), and converted the data to presence/absence.
Local richness (α-diversity) ranged between 13–52 FT (Figs. 1a, 2a). Sites sampled (Fig. 1c–d for illustrations)
are representative of sites along the backbone of the total catchment covering 200,000 km2 in Northern Thailand,
and included streams varying in width from 8 to 250 m. We identified distinct α-diversity patterns, with local
richness in headwaters (Ping, Wang, Yom and Nan) being overall lower than in the downstream section of Chao
Phraya. This is corroborated by a highly significant decrease in local richness with increasing topological distance
from the river outlet at the Gulf of Thailand (Fig. 2b, GLM, z = 68.925, p < 0.001, AIC 303.48). Species richness
accumulation curves for all five rivers have a more steeply increasing slope initially and begin to plateau after
Scientific Reports | (2021) 11:10375 | https://doi.org/10.1038/s41598-021-89942-6 2
Vol:.(1234567890)
www.nature.com/scientificreports/
Figure 1. Local species richness of fish collected from eDNA samples in the Chao Phraya catchment and
representative site illustrations. (a) Local species richness (α-diversity) of freshwater fish in the Chao Phraya
catchment (outlined by the white background) located in Northern Thailand, (b) Channel photograph at a
headwater stream (site 9: River Wang), (c) Channel photograph at a mid-order stream (site 31: River Nan),
(d) Channel photograph at a lowland stream near Bangkok (at site 38: lower Chao Phraya river). Approximate
cross-section width at these sites is 9 m, 75 m, and 250 m, respectively. The base map data was sourced from
HydroSHEDS. 2015: WWF in partnership with USGS, CIAT, TNC, CESR: Esri, 2013 and mapped using ArcGIS.
Photographs provided by M. Osathanunkul.
about five to six sites sampled (Fig. 2c), with the local richness starting to plateau for the River Ping before the
other rivers (see Supplementary Information Fig. S4 for total species richness accumulation for the catchment).
To assess community change throughout the river network, we used Jaccard dissimilarity as a measure of
β-diversity (Fig. 3a). Jaccard dissimilarity can be further partitioned into taxon replacement (turnover, Fig. 3b)
and taxon loss (nestedness, Fig. 3c). These measurements allowed us to assess the variation in community assem-
blage across the c atchment39. A Mantel test of Jaccard community dissimilarity versus geographic distance along
the river network concluded both Jaccard’s dissimilarity and turnover significantly increased as a function of
increased river distance (Mantel statistic: 0.15, p < 0.05 and 0.23, p < 0.005, respectively), while Jaccard’s nestedness
or taxon loss did not statistically increase as a function of river distance (Mantel statistic: − 0.1479, p = 0.977).
Together with α-and β-diversity measures, the similarity of community assemblages within a catchment is
an important aspect in identifying key biodiversity patterns within an ecosystem. To consider the importance
of these biogeographical conservation units, we examined the read data generated by taking the maximum read
count for each FT detected at each site. Of the clustering methods we compared, hierarchical clustering had
the most support and generated two optimal number of clusters dependent on the cluster validation measure
(see Table 1 and Methods section for further details). Two clusters were supported by three validation methods:
Scientific Reports | (2021) 11:10375 | https://doi.org/10.1038/s41598-021-89942-6 3
Vol.:(0123456789)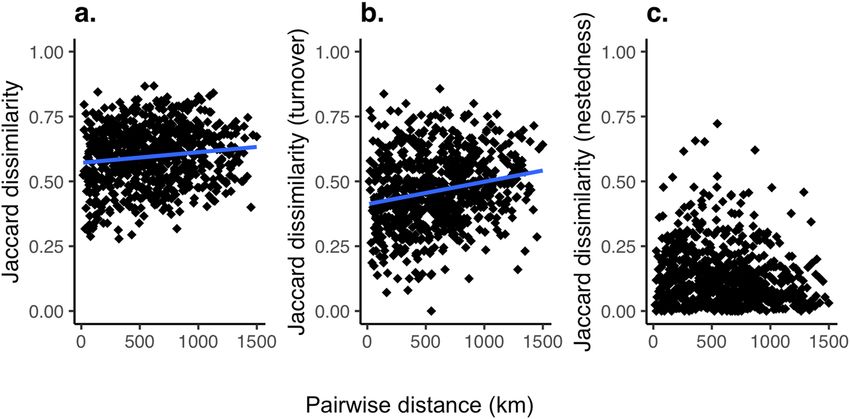
www.nature.com/scientificreports/

                                            Figure 2.  Patterns of local species richness: (a) frequency distribution of local species richness over the 39
                                            sampling sites in the Chao Phraya catchment, (b) Local Species Richness as a function of the river distance from
                                            the outlet (the black line is the GLM prediction), and (c) Local Species richness accumulation curves from each
                                            river (mean and standard deviation). Colours represent each rivers: Lower Chao Phraya (lilac), Nan (blue), Ping
                                            (red), Wang (yellow), and Yom (green). Figure produced using R studio, version 3.6.3 with the ggplot2 package.

                                            Connectivity, Dunn Index and Average Distance between means. Four clusters were supported by two validation
                                            methods: Silhouette coefficient and the Average proportion of non-overlap. To investigate the clusters further,
                                            dendrograms for each optimal cluster number (two and four) were plotted (see Fig. S5) and clusters were pro-
                                            jected on the Chao Phraya catchment (see Fig. 4a,b).
                                                When projecting the clusters across the river network based on two optimal clusters (the optimal cluster
                                            number with the greatest support by validation measures), there is a clear spatial separation of two major clusters
                                            across the catchment (Fig. 4a). The Wang, Yom and headwaters of the rivers Nan closely cluster, which can also
                                            be considered upland habitat (hereafter, referred to as the North East cluster). The River Ping, main Chao Phraya
                                            channel and lower part of the Nan are a second distinct cluster (hereafter, referred to as the South West cluster).

          Scientific Reports |   (2021) 11:10375 |               https://doi.org/10.1038/s41598-021-89942-6                                                  4

Vol:.(1234567890)
www.nature.com/scientificreports/
Figure 3. Pairwise β-diversity against river distance for all sites. β-diversity is calculated based on Jaccard
dissimilarity where 0 would indicate identical communities. The blue line indicates the significant correlation
using Mantel statistic: (a) Jaccard dissimilarity, Mantel statistic: 0.15, p < 0.05, (b) turnover, Mantel statistic 0.23,
p < 0.005 and (c) nestedness, not significant. Figure produced using R studio, version 3.6.3 with the ggplot2
package.
Type of measure Measure Optimal cluster method Optimal number of clusters
Internal Connectivity Hierarchical 2
Internal Dunn index Hierarchical 2
Internal Silhouette width Hierarchical 4
Stability APN Hierarchical 4
Stability AD PAM 10
Stability ADM Hierarchical 2
Stability FOM PAM 7
Table 1. Optimal cluster validation measures: internal and stability measures show the most support for
hierarchical clustering methods (5 out of the 7 measures tested), with support for 2 and 4 clusters (see Fig. S6).
When projecting four optimal clusters (also supported by the validation measures), we see the North East
cluster is divided further into three clusters. Subsequently, greater details of the underlying communities present
emerge, which is indicative of the distinct communities found at the highest points in the catchments within
the original North East cluster (Fig. 4b). The red cluster is formed predominantly of the high-altitude sites of
the Rivers Wang, Yom and Nan, while the yellow cluster is made of sites found in the low and middle reaches
of the Rivers Yom and Nan.
Overall, clear and distinct clusters emerge, but some spatial overlap of different clusters can be seen in the
projection of four clusters (Fig. 4b, red and green clusters), and is restricted to sites within Rivers Wang and Yom.
This spatial coherence strongly supports the adequacy of the data, as some overlap would naturally be expected
both due to eDNA transportation and the community turnover occurring along distinct zones of transitions,
which are expected to stretch over some distance. In contrast, the entire River Ping and Chao Phraya are consist-
ently considered as a single cluster in both projections (Fig. 4a,b) and this grouping can also be seen in a principal
component analysis of the environmental variables for these two rivers (Fig. S7a).
Discussion
Tropical and subtropical freshwater systems face unprecedented anthropogenic threats from increased habitat
modification, exploitation of fisheries, global climate change, pollution and invasive s pecies5–7. Our study focused
on such an ecosystem, the Chao Phraya catchment in Thailand, which is a global hotspot for fish diversity, includ-
ing many endemic and threatened s pecies6. Like most other rivers in tropical and subtropical South-East Asia,
current, accurate and spatially comprehensive biodiversity data to underpin evidence-based environmental poli-
cies is lacking11. Here, we used a novel approach which could easily be applied to other comparable ecosystems
across the globe to describe spatial biodiversity patterns and define conservation priorities. By conducting a single
eDNA survey of water samples collected from 39 sites, we identified 108 freshwater FT and distinct clusters of
species assemblages within the river network. Our data shows clear α-diversity accumulation towards the outlet
of the catchment, increased β-diversity as a function of river network distance and separation of sites into distinct
Scientific Reports | (2021) 11:10375 | https://doi.org/10.1038/s41598-021-89942-6 5
Vol.:(0123456789)www.nature.com/scientificreports/
Figure 4. Biogeographical conservation units. Maps illustrating the projections of the optimal clusters, plotted
across the Chao Phraya catchment to visualise the fish community in space. Clusters are joined with associated
cluster colour where sites are connected by downstream flow. Optimal cluster validation measures supported
both two (a) and four (b) clusters. The base map data was sourced from HydroSHEDS. 2015: WWF in
partnership with USGS, CIAT, TNC, CESR: Esri, 2013 and mapped using ArcGIS, coloured clusters were added
using Adobe Illustrator version 25.2.1.
biogeographically distinct clusters. These three key elements of biodiversity patterns in the Chao Phraya catch-
ment have strong implications for conservation. Specifically, they align with previous studies and provide the
necessary data showing that headwaters harbour a distinct community of fish s pecies40,41 and should be preserved
for their unique composition, while sites further downstream and in the lowlands support a higher richness and
should be considered for conservation of maximal number of s pecies42,43. While such data are generally available
for temperate regions (e.g.,42) and predicted by theoretical models (e.g.,44,45), adequate data supporting necessary
environmental decision making has hitherto been largely lacking for tropical and subtropical regions but can
now be achieved as shown here.
By assessing the α-and β-diversity at the level of functional taxonomic units, we are able to determine funda-
mental properties of the fish diversity at a catchment scale. Species richness is often seen as the most basic and
vital component of an ecosystem’s productivity and function46. In the Chao Phraya region, α-diversity ranged
from 13 to 52 FT across the catchment, with a significant increase in diversity towards the outlet. Likely, the total
numbers are an underestimation due to the lack of complete genetic reference databases, but by using eDNA we
have captured a sufficient subset of the diversity to obtain meaningful results, which are consistent with ecological
theory. Furthermore, we identify particular species-rich areas in the middle and lower parts of the catchment,
directly offering conservation t argets6 (Figs. 1a, 2a). Compared to other studies, our data demonstrate these pat-
terns on unprecedented and biogeographically relevant landscape scale, rather than at a local p erspective23,47. In
terms of key β-diversity patterns, Jaccard’s dissimilarity and turnover increase significantly with river distance, as
found in other large-scale studies on fish communities23,42,43, while nestedness or species loss was not significant.
This is indicative of the high fish diversity within the catchment and likely matches the varied habitats types in the
catchment39. The lack of nestedness also suggests that our data are not likely to be significantly affected by eDNA
transport between adjacent sites, which theoretically could result in inflated diversity estimates at downstream
sites. In lotic ecosystems, local eDNA signals provide a view of the community upstream of the sampling site18,34.
The exact spatial scale over which the signal is integrated depends on the environmental conditions, but most
previous studies in temperate regions have shown that the signal degenerates rapidly and detection can be up to
Scientific Reports | (2021) 11:10375 | https://doi.org/10.1038/s41598-021-89942-6 6
Vol:.(1234567890)www.nature.com/scientificreports/
10 km away from the source (summarised i n24). However, one study, based on filtration of 30 L of water found
transportation in large temperate rivers could occasionally be further than 100 km, but even in this case the
effect on the estimation local biodiversity patterns was low24. In our study, sample sites were on average 72 km
apart and we filtered a relatively small volume of water per site, with environmental conditions unfavourable for
DNA persistence (i.e., during the dry season). Hence eDNA transportation is unlikely to affect our conclusions.
Future studies should combine this information with models of eDNA transport (e.g.,34,48), in order to under-
stand the persistence and degradation of eDNA across temporal sampling and improve our knowledge of where
and when to sample, and further support this method for fish diversity assessment over large scale catchments.
By using biogeographical clustering, we identified transitions in fish community structure across the Chao
Phraya catchment, allowing us to identify areas for protection of relevant and important community assemblages.
The two-cluster solution separated the catchment into two geographically distinct regions in the North East and
South West, respectively (Fig. 4a). These clusters also differ in key ecosystem characteristics and is demonstrated
further by the PCA and grouping of river sites in Fig. S7a. The North East cluster comprises high to medium
altitude smaller river sites compared to the larger lowland rivers in the South West cluster. We would therefore
recommend that conservation practices within the Chao Phraya catchment ensure representative sites from each
of these two strongly supported optimal clusters are included in order to protect the two distinct communities.
riority49,50. The four-
Being able to separate the sites into clusters is fundamental to identify areas of conservation p
cluster solution indicates a fine-scale sub-structuring of the North East cluster, whereas the South-West cluster
remains a single cluster (Fig. 4b). This supports the idea that the fish communities in the lowland regions (River
Ping and main Chao Phraya) are more homogenous compared to the upland tributaries, which might require a
more nuanced conservation strategy. This projection separates the North East cluster into three further clusters,
of which two are geographically distinct from each other align with different eco-regions within the catchment,
the upper reaches (Fig. 4b—red cluster) and middle reaches (Fig. 4b—yellow cluster). Although such a zonation
is theoretically predicted by the river continuum concept and through the gradual change of co-varying envi-
ronmental characteristics46,51,52 (as seen in Fig. S7, which shows river site groups from environmental variables
recorded at each site), our data crucially provides the information for the further demarcation of these zones, a
prerequisite for identifying areas to focus conservation effort on within a large area. This is also important due
to marked vulnerability of upstream regions to global climate change, increase in temperature and the associated
reduced flow patterns and connectivity, compared to the lower reaches of the c atchment2,46. The four-cluster pro-
jection also identified a cluster (Fig. 4—green cluster) with no clear geographical distinction, largely overlapping
with two other clusters in the middle reaches of the rivers Wang and Yom (Fig. 4b). This indicates that additional
ecological variation exists within these regions beyond the gradual zonation along the river continuum. This
might not be captured adequately within the current sampling design and additional eDNA studies on a smaller
geographical scale are warranted to investigate this further. Transport of the eDNA might theoretically also
contribute to such an admixed community signal. However, given the spatial scale of our study and the absence
of significant nestedness in the β-diversity pattern, it seems unlikely to be the predominant factor. Therefore, we
can assume that the overlapping clusters may indicate transitional zones of species distribution within the two
rivers, which also strengthens the need to protect sites in both clusters (red and green) due to their differing fish
assemblages. Overall, the projected clusters (two and four) reveal distinct geographic areas of species assemblages
allowing protection of relevant and important community assemblages across an ecosystem.
By matching sequences from our data with known fish species in Thailand, we were able to establish distinct
communities of FT. These patterns could be detected through a surrogate approach, using an unbiased well-
defined subset of the total fish diversity. Incomplete species detection is common for fish sampling approaches
such as electro-fishing and gill-netting, but which species have been missed through such methods is diffi-
cult to predict. In contrast, we have clear predictions from our in-silico database analysis as to which species
we can detect with the eDNA metabarcoding approach. Additionally, numerous studies have shown that false
negatives rates are otherwise considerably lower for fish eDNA metabarcoding compared to all conventional
methods21,22,24,26. We are therefore confident that our results are meaningful in the context of determining spatial
biodiversity patterns. Nevertheless, increasing the comprehension of the database would provide new opportuni-
ties for more detailed ecological studies. For example, none of the databases provided reliable target sequences
of the widespread fish genus Schistura6, which a priori excluded taxa within this genus from being detected.
Complete databases would also allow detection of those species which were rare and endemic to the Chao Phraya
catchment and aid our identification of specific species driving clusters. As with other eDNA studies (e.g.,30,32),
specialist curated reference databases are key in highly diverse systems, but paradoxically are lacking due to the
limited understanding of these ecosystems. Our approach of identifying biodiversity hotspots using eDNA can
guide the targeted search for species, eventually benefiting the complementation of reference databases.
Of the taxa detected with the two markers, a number were only identified with one of the two 12S primer
pairs. Some of these differences were caused by an unequal coverage of the reference databases for both primers,
that is 20 of the 26 and 14 of the 15 FT were not detected with Kelly and MiFish, respectively, despite a reference
sequence being present in the respective reference database and the FT being detected with the other primer
pair. Possible, but not mutually exclusive, explanations for such imperfect detections include database errors,
primer bias and differential resolution at species level21,30,32. In our case, all sequences used to curate a custom
database were mined from public databases without the possibility of independent verification of the record. To
exclude potentially misidentified records, phylogenetic placement methods were included in the curation, but
these methods are not able to identify all errors, especially when the underlying phylogeny is incomplete. A single
incorrect record for one of the two databases could potentially result in a discordance of two species between the
two data sets. The highly diverse fish fauna investigated here contains many closely related species and given the
short marker fragments used in this study, it is likely that a number of species pairs cannot be resolved, result-
ing in sequence assignments to a higher taxonomic level, which in most cases would have resulted in a loss of
Scientific Reports | (2021) 11:10375 | https://doi.org/10.1038/s41598-021-89942-6 7
Vol.:(0123456789)www.nature.com/scientificreports/
the associated taxa. Although the limited coverage of our database precludes a meaningful in-silico analysis, our
results show that a significant proportion of sequences (24%) were assigned to the genus or family level lending
support to this hypothesis. Primer bias, that is the differential amplification of individual species largely due to
mismatches in the primer binding region, is often used as the default explanation for false negatives in metabar-
coding studies, especially when primers target a broad taxonomic scale, for example, e ukaryotes18,53. However,
this is less likely to be a major factor in markers with a more limited taxonomic scope, such as the vertebrate
and fish specific assays used here. In-silico and in-vitro analysis for these markers in other regional faunas have
also shown little evidence of significant amplification b ias21,54, although the possibility for such biases might
be increased in highly diverse fauna investigated here. All of these issues can be addressed in future studies by
improving the coverage of the reference database, using a larger number of markers and increased replication
in various stages of the experimental design.
Conclusion
In this study, we demonstrated that eDNA metabarcoding is a highly efficient way to generate data at the neces-
sary scale required to map and assess biodiversity across large catchments of highly diverse but understudied
tropical and subtropical freshwater systems. The data from this study were generated from water samples taken
in a single sampling campaign across seven weeks, an effort which can easily be upscaled to provide finer geo-
graphical resolution and to cover seasonal fish migration. With such a moderate effort, we generated data that
allowed us to identify key biodiversity patterns on a catchment scale and outline conservation priorities. This
has hitherto been mostly prohibited due to the lack/difficulty of access to appropriate data. Collecting such data
based on conventional methods and in a consistent way is simply too costly and time-consuming, hampering
conservation effort for many biodiversity hotspots of global importance. Environmental DNA based approaches
are a solution to this problem, and we believe that concerted efforts must now be made to harness this potential
and ultimately prevent further loss of biodiversity.
Methods
Sampling and extraction. This study was conducted in Thailand in November 2016 (during the dry sea-
son, i.e., base-line low-flow conditions). Water samples were collected at 39 sites (Fig. 1a and Supplementary
Information Fig. S1) along the main river network of the Ping, Wang, Yom, Nan and Chao Phraya rivers in
Thailand over the course of 7 weeks (mean river distance between sites 72.5 km ± 6 (SE), range 16–184 km). At
each site, water was sampled at three locations across the river width: left bank, centre and right bank (mean river
width 112 m ± 15 (SE), range 9–361 m). This was done by either accessing the river channel from a bridge or with
a small boat. At each of these three locations, two replicates were taken (i.e., in total six replicates were taken
per site, resulting in n = 234 water samples taken). Water was collected by submerging a sterilized plastic bucket
(rinsed with 10% chlorine bleach and deionised water after each sampling to avoid cross-contaminations) in the
river and then subsampling the water with a 60 mL syringe. Per replicate, 100 mL of water was filtered through
an enclosed 25 mm diameter, glass fibre filter membrane with 0.7 µm pore size (Whatman, GE Healthcare, UK)
to collect all DNA from the water, resulting in a total of 600 mL of filtered river water per sampling site. At the
start and end of each day, 300 mL d dH2O was filtered in the same manner to act as negative controls. At each
site, river width (m), average pH, average conductivity, total dissolved solids and altitude (m) were recorded, and
these environmental variables were analysed using a Principal Component Analysis (PCA) (See Supplementary
Information Fig. S7a). Filters were placed in individual 1.5 mL Eppendorf tubes and kept in a polystyrene box
containing dry ice before transferring to a − 20 °C freezer until extraction. All samples were extracted within
2 days of sampling in a dedicated clean laboratory, following the DNeasy Blood and Tissue Kit (Qiagen, Hilden,
Germany) with a minor modification (see46). Samples were eluted in 100 µL of TE buffer and subsequently pre-
served at − 20 °C. In addition, each sample (n = 234) was treated with the OneStep PCR Inhibitor Removal Kit
(Zymo Research) to remove potential PCR inhibitors bound to eDNA molecules that may be present in water
samples.
PCR, library preparation and sequencing. Samples were amplified using two 12S markers: a 106 bp
fragment (forward primer sequence: 5′-TACTGGGATTAGATACCCC-3′ and reverse primer sequence: 5′-CTA
GAACAGGCTCCTCTAG-336,37) hereafter known as the Kelly primer and the MiFish-U-F/R primer pair (for-
ward primer sequence: 5′-GTCGGTAAAACTCGTGCCAGC-3′ and reverse primer sequence: 5′-CATAGT
GGGGTATCTAATCCCAGTTTG-338) hereafter known as the MiFish primer pair, which targets a hypervari-
able region of the 12S rRNA gene which amplicon ranges from 163 to 185 bp. In brief, both libraries were pre-
pared using the Illumina MiSeq dual-barcoded two-step PCR amplicon sequencing protocol, where the DNA
was amplified using primers with an overhang in the first PCR, and in second reduced cycle PCR Nextera XT
Indexes were added in order for samples to be identified during bioinformatic processing. The first PCR reaction
contained 0.5 μM each primer, 0.4 mg/mL BSA, 12.5 μL Q5 High Fidelity 2X Master Mix (New England Biolabs),
and 2 μL template DNA for both libraries. PCR profiles were as follows: for the Kelly library—initial denatura-
tion 98 °C for 5 min followed by 35 cycles of 98 °C for 10 s, 58 °C for 20 s, and 72 °C for 30 s, and a final extension
step of 72 °C for 7 min. In case there were double bands for the amplicon observed, the elongation time was
decreased to 10 s. MiFish library—initial denaturation of 98 °C for 5 min, followed by 35 cycles of 98 °C for 10 s,
65 °C for 20 s, and 72 °C for 30 s, and a final extension step of 72 °C for 7 min. The first PCR was carried out in
triplicate and samples were pooled and cleaned using SPRI beads (Applied Biological Materials Inc.) prior to the
second PCR. Second PCRs were carried out using 15 μL of cleaned PCR product and the Nextera XT Index Kit
v2 (Illumina), following the subsequent PCR profile: initial denaturation 95 °C for 3 min followed by 10 cycles of
95 °C for 30 s, 58 °C for 30 s, and 72 °C for 30 s, and a final extension step of 72 °C for 5 min. Negative controls
Scientific Reports | (2021) 11:10375 | https://doi.org/10.1038/s41598-021-89942-6 8
Vol:.(1234567890)www.nature.com/scientificreports/
and positive controls (a synthetic DNA sequence, see Supplementary Information Table S1) were processed
in parallel with all samples. All PCR products were visualised using QiAxcel Advance System by using a High
Resolution Cartridge (Qiagen, Hilden, Germany) and cleaned once more using SPRI beads. Samples were then
quantified using the Spark 10 M Multimode Microplate Reader (Tecan Group Ltd.) using the Qubit dsDNA BR
assay (Thermo Fisher) and pooled equimolar. The libraries were loaded at 15 pM concentration, with 10% PhiX
control. A paired-end 300 cycle (2 × 150 nt) sequencing was performed on an Illumina MiSeq (MiSeq Reagent
Kit v3, 200 cycles) following the manufacturer’s run protocols (Illumina).
Reference database and bioinformatics. In order to ensure sequences were assigned correctly, we cre-
ated a reference database of fish known to occur in Northern Thailand. Firstly, we listed all freshwater fish
recorded in Thailand according to (1) OEPP Biodiversity Series Vol. 4 Fishes in Thailand55 and (2) the Checklist
of Freshwater Fishes of Thailand (www.siamensis.org). In total 408 species, including known invasive non-native
species were checked and searched against GenBank in order to create a reference library of 12S sequences
that could be used to assign our eDNA sequences too (see Supplementary Information Table S3). We found
sequences for a total of 220 species (54%), which then were used as our reference library (see Supplementary
Information Table S3). Importantly, and as commonly the case for such studies56, the incomplete database
restricts the number of species that can be detected by our approach. We note that the absence of species in the
genetic reference database is not random across the fish community. Large and charismatic species are more
commonly represented, while smaller, or highly diverse species groups (e.g., some genera, such as Schistura, are
underrepresented in the database or even lack completely). Processing of Illumina reads data and the taxonomic
assignment were performed using a custom bioinformatics pipeline incorporating open source software (meta-
BEAT, v.0.97.7-global) as described in Hänfling et al.21 with the addition of the reference database as described
above, using a threshold of 97% similarity for taxonomic assignment.
Data analysis. Taxonomy of fish within Thailand is still very heterogeneous, with many databases not being
very reliable, and no common agreement on taxonomic or faunistic databases existing (pers. comm. Maurice
Kottelat). We thus decided to restrict our data analysis to fish taxa (FT) derived from those reads assigned with-
out using taxonomic nomenclature. This approach may be ideal for tropical and subtropical catchments, which
have a high diversity of organisms but often low or infrequent monitoring activities and therefore inadequate
access to curated reference databases or the ability to make them.
The following thresholds were applied in order to minimise any potential contamination caused during
laboratory work: 0.1% of total reads were removed from each sample, in line with similar s tudies21,57. For greater
stringency, the greatest number of reads for each taxon found in the negative controls was also removed from
each sample. To examine α-and β-diversity patterns, we combined the two primer data sets (Kelly and MiFish)
and the biological replicates from the three sampling locations at each site (right bank, centre and left bank).
Data was then converted to presence/absence. We calculated local species richness (α-diversity) at each site
and used the glm() function with a Poisson distribution to analyse the effect of topological distance on species
richness. Topological distance was measured using the measurement tool available on GoogleMaps. To com-
pare β-diversity between sites, we used Jaccard dissimilarity partitioned into nestedness and turnover with the
R package “betapart”39. We constructed a matrix of pairwise distances between sites along the fluvial network
with the R package “igraph”58. To compare the similarity between β-diversity and river distance, we carried out
a Mantel test with the R package “vegan”59. To examine FT richness accumulation within each river, we plotted
species accumulation curves using the accumcomp() function in the R package “BiodiversityR”60.
To distinguish biogeographical units (unique and important sites or clusters of sites) within the catchment,
we used the read count as a proxy for taxa signal within the catchment. We combined the two datasets (Kelly and
MiFish) by taking the maximum count from each taxon of either dataset at each site. This enables us to reflect
the full community assemblage taking into consideration the primer bias of each primer set (i.e., species not
detected equally well by both primers). Firstly, we used Hopkin’s statistics, where 0 indicates uniform data and
1 highly clustered data to test if our data was suitable for clustering, we found our data was suitable for cluster-
ing (0.74). We compared clustering methods (hierarchical, k-means, Divisive ANAlysis (DIANA), Partitioning
Around Medoids (PAM) and Self-Organising Tree Algorithm (SOTA)) and optimal cluster number using R
package “clValid”61. For optimal cluster validation, we calculated Internal and Stability measures: Connectivity,
Dunn Index, Silhouette coefficient, Average proportion of non-overlap (APN), Average Distance (AD), Average
Distance between means (ADM) and Figure of Merit (FOM). Hierarchical clusters were generated using “ward.
D2” linkage function and Canberra distance. Dendrograms were produced and explored using the R packages
“stats”62 and “factoextra”63, and clusters were mapped on to the catchment using Adobe Illustrator. Base map
data was sourced from HydroSHEDS. 2015: WWF in partnership with USGS, CIAT, TNC, CESR: Esri, 2013 and
mapped using ArcGIS. All statistical analyses were performed using R studio, version 3.6.362.
Data availability
Sequencing data is deposited in the European Nucleotide Archive under the primary accession number
PRJEB34331 (Kelly data set) and PRJEB34332 (MiFish data set).
Received: 16 December 2020; Accepted: 5 May 2021
References
1. Latrubesse, E. M. et al. Damming the rivers of the Amazon basin. Nature 546, 363–369 (2017).
Scientific Reports | (2021) 11:10375 | https://doi.org/10.1038/s41598-021-89942-6 9
Vol.:(0123456789)www.nature.com/scientificreports/
2. Encalada, A. C. et al. A global perspective on tropical montane rivers. Science 365, 1124–1129 (2019).
3. Winemiller, K. O. et al. Development and environment. Balancing hydropower and biodiversity in the Amazon, Congo, and
Mekong. Science 351, 128–129 (2016).
4. McIntyre, P. B., Reidy Liermann, C. A. & Revenga, C. Linking freshwater fishery management to global food security and biodi-
versity conservation. Proc. Natl. Acad. Sci. U. S. A. 113, 12880–12885 (2016).
5. IPBES. Global assessment report on biodiversity and ecosystem services of the Intergovernmental Science-Policy Platform on
Biodiversity and Ecosystem Services (eds Brondizio, E. S., Settele, J., Díaz, S. & Ngo, H. T.) (Bonn, Germany, 2019).
6. Allen, D. J., Smith, K. G. & Darwall, W. R. T. The Status and Distribution of Freshwater Biodiversity in Indo-Burma (IUCN, 2012).
7. Barlow, J. et al. The future of hyperdiverse tropical ecosystems. Nature 559, 517–526 (2018).
8. Dudgeon, D. Multiple threats imperil freshwater biodiversity in the Anthropocene. Curr. Biol. 29, 960–967 (2019).
9. Ziv, G., Baran, E., Nam, S., Rodríguez-Iturbe, I. & Levin, S. A. Trading-off fish biodiversity, food security, and hydropower in the
Mekong River Basin. Proc. Natl. Acad. Sci. U. S. A. 109, 5609–5614 (2012).
10. Grill, G. et al. Mapping the world’s free-flowing rivers. Nature 569, 215–221 (2019).
11. Dudgeon, D. et al. Freshwater biodiversity: importance, threats, status and conservation challenges. Biol. Rev. Camb. Philos. Soc.
81, 163–182 (2006).
12. Itakura, H. et al. Environmental DNA analysis reveals the spatial distribution, abundance, and biomass of Japanese eels at the
river-basin scale. Aquat. Conserv. 29, 361–373 (2019).
13. Wallace, A. R. The Geographical Distribution of Animals: With a Study of the Relations of Living and Extinct Faunas as Elucidating
the Past Changes of the Earth’s Surface (Macmillan and Co, 1876).
14. Kreft, H. & Jetz, W. A framework for delineating biogeographical regions based on species distributions: Global quantitative
biogeographical regionalizations. J. Biogeogr. 37, 2029–2053 (2010).
15. Holt, B. G. et al. An update of Wallace’s zoogeographic regions of the world. Science 339, 74–78 (2013).
16. Costello, M. J. et al. Marine biogeographic realms and species endemicity. Nat. Commun. 8, 1057 (2017).
17. Leray, M. & Knowlton, N. DNA barcoding and metabarcoding of standardized samples reveal patterns of marine benthic diversity.
Proc. Natl. Acad. Sci. U. S. A. 112, 2076–2081 (2015).
18. Deiner, K., Fronhofer, E. A., Mächler, E., Walser, J.-C. & Altermatt, F. Environmental DNA reveals that rivers are conveyer belts
of biodiversity information. Nat. Commun. 7, 12544 (2016).
19. Bush, A. et al. DNA metabarcoding reveals metacommunity dynamics in a threatened boreal wetland wilderness. Proc. Natl. Acad.
Sci. U. S. A. 117, 8539–8545 (2020).
20. Pawlowski, J., Apothéloz-Perret-Gentil, L. & Altermatt, F. Environmental DNA: What’s behind the term? Clarifying the terminol-
ogy and recommendations for its future use in biomonitoring. Mol. Ecol. 29, 4258–4264 (2020).
21. Hänfling, B. et al. Environmental DNA metabarcoding of lake fish communities reflects long-term data from established survey
methods. Mol. Ecol. 25, 3101–3119 (2016).
22. Li, J. et al. Ground-truthing of a fish-based environmental DNA metabarcoding method for assessing the quality of lakes. J. Appl.
Ecol. 56, 1232–1244 (2019).
23. Li, J. et al. Limited dispersion and quick degradation of environmental DNA in fish ponds inferred by metabarcoding. Environ.
DNA 1, 238–250 (2019).
24. Pont, D. et al. Environmental DNA reveals quantitative patterns of fish biodiversity in large rivers despite its downstream trans-
portation. Sci. Rep. 8, 10361 (2018).
25. Olds, B. P. et al. Estimating species richness using environmental DNA. Ecol. Evol. 6, 4214–4226 (2016).
26. Jerde, C. L. Can we manage fisheries with the inherent uncertainty from eDNA? J. Fish Biol. 98(2), 341–353 (2019).
27. Bellemain, E. et al. Trails of river monsters: detecting critically endangered Mekong giant catfish Pangasianodon gigas using envi-
ronmental DNA. Glob. Ecol. Conserv. 7, 148–156 (2016).
28. Sakata, M. K., Maki, N., Sugiyama, H. & Minamoto, T. Identifying a breeding habitat of a critically endangered fish, Acheilognathus
typus, in a natural river in Japan. Naturwissenschaften 104, 100 (2017).
29. Mizumoto, H., Urabe, H., Kanbe, T., Fukushima, M. & Araki, H. Establishing an environmental DNA method to detect and estimate
the biomass of Sakhalin taimen, a critically endangered Asian salmonid. Limnology 19, 219–227 (2018).
30. Cilleros, K. et al. Unlocking biodiversity and conservation studies in high-diversity environments using environmental DNA
(eDNA): a test with Guianese freshwater fishes. Mol. Ecol. Resour. 19, 27–46 (2019).
31. Cantera, I. et al. Optimizing environmental DNA sampling effort for fish inventories in tropical streams and rivers. Sci. Rep. 9,
3085 (2019).
32. Doble, C. J. et al. Testing the performance of environmental DNA metabarcoding for surveying highly diverse tropical fish com-
munities: a case study from Lake Tanganyika. Environ. DNA 2, 24–41 (2020).
33. Altermatt, F. et al. Uncovering the complete biodiversity structure in spatial networks: the example of riverine systems. Oikos 129,
607–618 (2020).
34. Carraro, L., Mächler, E., Wüthrich, R. & Altermatt, F. Environmental DNA allows upscaling spatial patterns of biodiversity in
freshwater ecosystems. Nat. Commun. 11, 3585 (2020).
35. Zarfl, C. et al. Future large hydropower dams impact global freshwater megafauna. Sci. Rep. 9, 18531 (2019).
36. Kelly, R. P., Port, J. A., Yamahara, K. M. & Crowder, L. B. Using environmental DNA to census marine fishes in a large mesocosm.
PLoS ONE 9, e86175 (2014).
37. Riaz, T. et al. ecoPrimers: inference of new DNA barcode markers from whole genome sequence analysis. Nucleic Acids Res 39,
e145 (2011).
38. Miya, M. et al. MiFish, a set of universal PCR primers for metabarcoding environmental DNA from fishes: detection of more than
230 subtropical marine species. R. Soc. Open Sci. 2, 150088 (2015).
39. Baselga, A. & Orme, C. D. L. betapart : an R package for the study of beta diversity : betapart package. Methods Ecol. Evol. 3, 808–812
(2012).
40. Altermatt, F. Diversity in riverine metacommunities: a network perspective. Aquat. Ecol. 47, 365–377 (2013).
41. Tonkin, J. D. et al. The role of dispersal in river network metacommunities: patterns, processes, and pathways. Freshw. Biol. 63,
141–163 (2018).
42. Muneepeerakul, R. et al. Neutral metacommunity models predict fish diversity patterns in Mississippi-Missouri basin. Nature 453,
220–222 (2008).
43. Azaele, S., Muneepeerakul, R., Maritan, A., Rinaldo, A. & Rodriguez-Iturbe, I. Predicting spatial similarity of freshwater fish
biodiversity. Proc. Natl. Acad. Sci. U. S. A. 106, 7058–7062 (2009).
44. Carrara, F., Altermatt, F., Rodriguez-Iturbe, I. & Rinaldo, A. Dendritic connectivity controls biodiversity patterns in experimental
metacommunities. Proc. Natl. Acad. Sci. U. S. A. 109, 5761–5766 (2012).
45. Muneepeerakul, R., Bertuzzo, E., Rinaldo, A. & Rodriguez-Iturbe, I. Evolving biodiversity patterns in changing river networks. J.
Theor. Biol. 2019(462), 418–424 (2019).
46. Kang, B., Huang, X., Yan, Y., Yan, Y. & Lin, H. Continental-scale analysis of taxonomic and functional fish diversity in the Yangtze
river. Glob. Ecol. Conserv. 15, e00442 (2018).
47. Mächler, E. et al. Assessing different components of diversity across a river network using eDNA. Environ. DNA 1, 290–301 (2019).
Scientific Reports | (2021) 11:10375 | https://doi.org/10.1038/s41598-021-89942-6 10
Vol:.(1234567890)www.nature.com/scientificreports/
48. Carraro, L., Hartikainen, H., Jokela, J., Bertuzzo, E. & Rinaldo, A. Estimating species distribution and abundance in river networks
using environmental DNA. Proc. Natl. Acad. Sci. U. S. A. 115, 11724–11729 (2018).
49. Roux, D. J. et al. Designing protected areas to conserve riverine biodiversity: lessons from a hypothetical redesign of the Kruger
National Park. Biol. Conserv. 141, 100–117 (2008).
50. Troia, M. J. & McManamay, R. A. Biogeographic classification of streams using fish community– and trait–environment relation-
ships. Divers Distrib 26, 108–125 (2020).
51. Vannote, R. L., Minshall, G. W., Cummins, K. W., Sedell, J. R. & Cushing, C. E. The river continuum concept. Can. J. Fish Aquat.
Sci. 37, 130–137 (1980).
52. He, Y., Wang, J., Lek, S., Cao, W. & Lek-Ang, S. Structure of endemic fish assemblages in the upper Yangtze River Basin. River Res
Appl 27, 59–75 (2011).
53. Lawson Handley, L. et al. Temporal and spatial variation in distribution of fish environmental DNA in England’s largest lake.
Environ. DNA 1, 26–39 (2019).
54. Taberlet, P., Bonin, A., Zinger, L. & Coissac, E. Environmental DNA: For Biodiversity Research and Monitoring (Oxford University
Press, 2018).
55. Monkolprasit, S., Sontirat, S., Vimollohakarn, S. & Songsirikul, T. Checklist of Fishes in Thailand: OEPP Biodiversity Series Vol. 4
(Office of Environmental Policy and Planning, 1997).
56. Weigand, H. et al. DNA barcode reference libraries for the monitoring of aquatic biota in Europe: gap-analysis and recommenda-
tions for future work. Sci. Total Environ. 678, 499–524 (2019).
57. Blackman, R. et al. Detection of a new non-native freshwater species by DNA metabarcoding of environmental samples—first
record of Gammarus fossarum in the UK. Aquat. Invasions 12, 177–189 (2017).
58. Csárdi, G. & Nepusz, T. The igraph software package for complex network research. Inter Journal, Complex Systems 1695: 1–9
(2006). R package version 1.2.5. Available from https://c ran.r-p rojec t.o
rg/w
eb/p
ackag es/i graph/i ndex.h tml. Accessed 27 June 2020.
59. Oksanen, J. et al. vegan: Community Ecology Package 2.5-6. Available from https://C RAN.R-p rojec t.o
rg/p ackag e=v egan. Accessed
27 June 2020.
60. Kindt, R. & Coe, R. Tree diversity analysis. A manual and software for common statistical methods for ecological and biodiversity
studies. World Agroforestry Centre (ICRAF), Nairobi. ISBN 92-9059-179-X. Accessed 23 March 2021.
61. Brock, G., Pihur, V., Datta, S. & Datta, S. clValid: An R Package for Cluster Validation. J Stat Softw 25: 1–22 (2008). R package
version 0.6-9. Available from https://cran.r-project.org/web/packages/clValid/index.html. Accessed 27 June 2020.
62. R Studio Team. RStudio: Integrated Development for R. RStudio, Inc., Boston, MA. (2019).
63. Kassambara, A. & Mundt, F. factoextra: Extract and Visualize the Results of Multivariate Data Analyses. (2020) R package version
1.0.7. Available from: https://cran.r-project.org/web/packages/factoextra/index.html. Accessed 27 June 2020.
Acknowledgements
We thank the students in M.O. lab at Chiang Mai University for their assistance with sample collection, Maurice
Kottelat for discussions on fish diversity and taxonomy, Rosie Siber for sourcing the map data for the Chao
Phraya catchment and mapping the base maps used in this paper, and an anonymous reviewer for comments
on the manuscript. F.A is funded by the Swiss National Science Foundation Grants No 31003A_173074 and
PP00P3_179089, and the University of Zurich Research Priority Programme “URPP Global Change and Biodi-
versity”. M.O was partially supported by Chiang Mai University.
Author contributions
F.A. designed the research; M.O. secured the permits, planned and carried out the fieldwork; M.O., J.B., E.M.,
L.R.H., C.D.M. carried out the labwork; R.C.B., M.O., L.R.H., C.D.M and B.H. did the bioinformatic analysis,
R.C.B. and F.A. analysed biodiversity data with contributions from B.H.; R.C.B. and F.A. wrote the paper, and
all authors contributed to revising the text.
Competing interests
The authors declare no competing interests.
Additional information
Supplementary Information The online version contains supplementary material available at https://doi.org/
10.1038/s41598-021-89942-6.
Correspondence and requests for materials should be addressed to R.C.B. or F.A.
Reprints and permissions information is available at www.nature.com/reprints.
Publisher’s note Springer Nature remains neutral with regard to jurisdictional claims in published maps and
institutional affiliations.
Open Access This article is licensed under a Creative Commons Attribution 4.0 International
License, which permits use, sharing, adaptation, distribution and reproduction in any medium or
format, as long as you give appropriate credit to the original author(s) and the source, provide a link to the
Creative Commons licence, and indicate if changes were made. The images or other third party material in this
article are included in the article’s Creative Commons licence, unless indicated otherwise in a credit line to the
material. If material is not included in the article’s Creative Commons licence and your intended use is not
permitted by statutory regulation or exceeds the permitted use, you will need to obtain permission directly from
the copyright holder. To view a copy of this licence, visit http://creativecommons.org/licenses/by/4.0/.
© The Author(s) 2021
Scientific Reports | (2021) 11:10375 | https://doi.org/10.1038/s41598-021-89942-6 11
Vol.:(0123456789)You can also read