Cities - Advances In Cleaner Production
←
→
Page content transcription
If your browser does not render page correctly, please read the page content below
Cities 113 (2021) 103162
Contents lists available at ScienceDirect
Cities
journal homepage: www.elsevier.com/locate/cities
Assessing cities growth-degrowth pulsing by emergy and fractals: A
methodological proposal
Feni Agostinho a, *, Marcio Costa a, Luca Coscieme b, Cecília M.V.B. Almeida a,
Biagio F. Giannetti a
a
Post-graduation Program on Production Engineering, Paulista University, Brazil
b
School of Natural Sciences, Trinity College Dublin, Ireland
A R T I C L E I N F O A B S T R A C T
Keywords: As a powerful tool for assessing cities development, the emergy synthesis considers the energy quality concept,
Emergy which allows it to quantify all the effort provided by nature in providing resources, however, it usually demands
Energy hierarchy a huge amount of data and still lacks a complete and updated database for long-term studies. Cities seem to
GIS
develop according to fractals, building up parts that resemble the whole, which is also relevant in emergy theory
Satellite nighttime imagery
and observable through night-time lights from cities that are used to investigate how energy use distributes as
Urban metabolism
cities change. This work proposes an alternative method for estimating the fractal dimension and non-renewable
empower density (NRED) of cities from satellite night-time images and assess the relationship between them.
Nine cities in Brazil, selected through a cluster analysis, were considered as a case study. Results show a strong
positive correlation (0.94 for Pearson index) between fractals and NRED, which can be of help in estimating each
other for further studies. The method proposed is time and cost effective when compared to previously used
methods based on red/blue/green (RBG) satellite images, representing a potential alternative for assessing urban
expansion in spatiotemporal models and assessing cities limits to growth.
1. Introduction and countries, which results in the emergence of spatial networks of
hierarchical energy transformations (Braham et al., 2019).
There is an increasing global interest in understanding and assessing In general, in a given region, smaller centers of built-up areas support
cities shape and limits to growth, and their effects on environmental larger cities with materials and energy, and larger cities act as hubs for
sustainability and urban sprawl (Sutton et al., 2007; Zhang & Li, 2018). manufacturing and distributing goods. This hierarchy results in a
According to the United Nations Environment Program (UN, 2019a), convergence of energy, from primary energy transformations to con
cities generate over 80% of the GDP of many countries in Asia and the centration of energy in final goods and services (Giannetti et al., 2020;
Pacific and are engines of economic growth that have lifted millions out Odum, 2007). This energy-based network is visualized through night-
of poverty. Cities provide high-quality outcomes in terms of economic time lights, with cities as bright nodes connected through major roads
development, knowledge transfer, innovation, and social interaction. (Odum, 2007). Due to the high energy demand and environmental im
Cities provide access to recreational areas and public services (e.g. water pacts of cities (Fistola, 2011; Jacobi, 2013; Sevegnani et al., 2018),
and sanitation, health care, electricity, and emergency services), and night-time lights observations are being used to understand how urban
usually feature the central administrative, financial, legislative, and aggregates growth, are organized, distributed and connected (Ghosh
judiciary offices. On the other hand, although occupying 2% of the et al., 2009, 2010, 2013; Henderson et al., 2012; Mellander et al., 2015;
Earth’s surface, cities consume 60–80% of the global energy (Sodiq Hu & Yao, 2019; Coscieme et al., 2014a, 2014b; Sutton et al., 2007),
et al., 2019). In particular, cities demand a high density of energy and which are important aspects for informing public policies (Evans, 2019).
goods from their surrounding neighborhood (Odum, 1996; Odum & Since 2007, more than half of the world’s population has been living
Odum, 2006; Giannetti et al., 2020), and also import from other regions in urban areas, with a 70% increase expected by 2050 (UN, 2019a). The
* Corresponding author at: Universidade Paulista (UNIP), Programa de pós-graduação em Engenharia de Produção, Rua Dr. Bacelar 1212, 4◦ andar, CEP 040026-
002 São Paulo, Brazil.
E-mail address: feni@unip.br (F. Agostinho).
https://doi.org/10.1016/j.cities.2021.103162
Received 13 April 2020; Received in revised form 4 December 2020; Accepted 20 February 2021
Available online 3 March 2021
0264-2751/© 2021 Elsevier Ltd. All rights reserved.
F. Agostinho et al. Cities 113 (2021) 103162
11th goal of the United Nation’s 2030 Agenda for Sustainable Devel resources in a territory, allowing to investigate the fractal structure of
opment (SDG, 2019) emphasizes the need for sustainable cities and urban growth from a sustainability perspective.
communities by making cities and human settlements inclusive, safe, However, time-series emergy values of cities are scarcely available,
resilient and sustainable. To make a city more sustainable, the UN calling for the use of proxy measures and other methodological alter
(2019a) highlights the importance of investments in renewable energy, natives. In this vein, Coscieme et al. (2014a) used night-time lights
efficiency in water and electricity use, planning for more green areas, satellite observations to estimate and visualize emergy values of urban
and fast, reliable and affordable public transportation and waste and areas with intensive energy use and rural/wilderness areas. In this
recycling systems (see also Newman (2020) for a case on climate “thermodynamic geography”, emergy is used to characterize a territory
change). Although recognizing the importance of investing in social, “as a continuum of physical and morphological elements, infrastructures
economic, environmental and urban governance in cities (Evans, 2019; and urban settlements, rather than a combination of separated systems”
UN, 2019b), a focus on how cities contribute to approach (and exceed) (Pulselli, 2010). Following this approach, Neri et al. (2018) used night-
the Earth’s biophysical limits, in particular regarding energy on a larger time lights images to estimate the non-renewable component of
scale, should be considered in supporting public policies (Agostinho empower density for a list of 57 countries from 1995 to 2012. Some
et al., 2019; Sodiq et al., 2019; Wackernagel et al., 2017). authors (e.g. Agostinho et al., 2010; Lee & Brown, 2019; Mellino et al.,
The concentration of economic enterprises and people in cities ulti 2014) have proposed and used methods to calculate the renewable
mately depends on the availability of “cheap” fossil fuels, a condition component of empower density using georeferenced data of spatial
that will much likely not be maintained in the future, with fossil fuels distribution of solar radiation, geological heat flow, wind-kinetic energy
becoming less available and more expensive (Mohr et al., 2015; Ward and precipitation. Combined, these methods can be used to estimate
et al., 2012). According to Odum and Odum’s (2006) pulsing-paradigm empower density of cities in time series, including the non-renewable
cycle, the decreasing resource base of the world’s fossil fuel economy and renewable components.
will force society into a different stage where pursuing economic growth Considering the current restrictions for cities’ growth due to reduced
will have to reconcile with the general systems principles of energy, availability of biophysical resources, understanding cities development
matter and information (see also Bardi (2015) and Brown and Ulgiati patterns under the pulsing-curve becomes of paramount importance to
(2011)). propose more precise public policies. This city metabolism can be
Considering that large urban aggregates growth resembles the assessed under the emergy perspective, however, large databases con
development of self-organized structures (Schweitzer & Steinbrink, taining emergy flows for urban systems are rarely found in literature,
1998), the complexity of cities can be studied by considering, among mainly on small scales. That said, this paper aims to propose an
other characteristics, their fractal1 structure (or scaling exponent), as a approach that considers the use of night-time satellite images to estimate
means to understand how cities are spatially organized. This is sup non-renewable empower density (NRED) and the fractal dimension of
ported by Chen (2014), and other studies on the fractal dimension of cities. These estimates are used to investigate how the physical dimen
cities (e.g. Batty & Longley, 1994; Benguigui et al., 2000; Frankhauser, sion of urban growth relates with urban metabolism in terms of emergy.
1998; Marques, 2005; Xu & Min, 2013). Fractals can be investigated A case study for nine cities of the State of São Paulo, Brazil, selected
through different approaches, mainly involving measurements of area, through a cluster analysis, is presented in order to assess dynamics of
population, and GDP over time. However, none of these approaches urban expansion and metabolism in cities with different characteristics.
considers the biophysical limits of a city, as a consumer system of highly
concentrated energy. This hampers the ability of fractals to be used in 2. Methods
studies involving future scenarios of city development.
In order to investigate cities’ limits to growth beyond physical spatial 2.1. The pulsing-paradigm curve
restrictions from fractals, the use of emergy accounting (with an ‘m’;
Odum, 1996) which considers renewable (R) and non-renewable (N) Odum’s pulsing-paradigm for general systems self-organization
natural resources and resources provided by the economy (F) is pro (Odum, 1996) involves stages of slow production, growth and succes
posed. Emergy accounting is a tool based on the thermodynamics and sion followed by a pulse in consumption, a descent and a recession
systems theory which provides a number of sustainability indicators (Fig. 1). “Pulsing” refers to the slow building up, or stocking, of products
(Giannetti et al., 2010; Brown & Ulgiati, 2011). In particular, emergy is converging into centers of production, followed by a dispersal of prod
able to take into account the sustainability of the entire set of energy ucts towards multiple centers of fast consumption and a sharp descent in
flows in urban metabolism (Agostinho et al., 2018), including those the overall amount of products. Four main stages of the pulsing cycle can
flows without a market value, by summing up the equivalent solar en
ergy needed to produce each different form of energy through a series of
environmental and anthropic processes. According to Odum (1996), the
empower density (i.e. emergy per time per unit surface) can be used to
spatially represent the energy transformation hierarchy, indicating how
emergy is distributed in a territory (e.g. Braham et al., 2019). Chen and
Zhou (2008) indicate that energy and energy transformations determine
the spatial order and structure of cities self-organized networks, how
ever, the use of energy rather than emergy would provide incomplete Growth and Succession Descent
insights on the full range of resources demanded by urban metabolism,
as energy does not consider the whole life cycle of energy and material
Climax
forms. All these characteristics make emergy values a potential refer
ence for investigating how city’s growth affects the geography of Producers Consumers
1
The word “fractal” was coined by Mandelbrot in his fundamental essay from
the Latin fractus, meaning broken, to describe objects that were too irregular to Time
fit into a traditional geometrical setting. Many fractals have some degree of self-
similarity, i.e. they are build up of parts that resemble the whole in some way Fig. 1. The pulsing-paradigm curve and its growth, climax and descent stages.
(Falconer, 2003). Source: Odum (1996).
2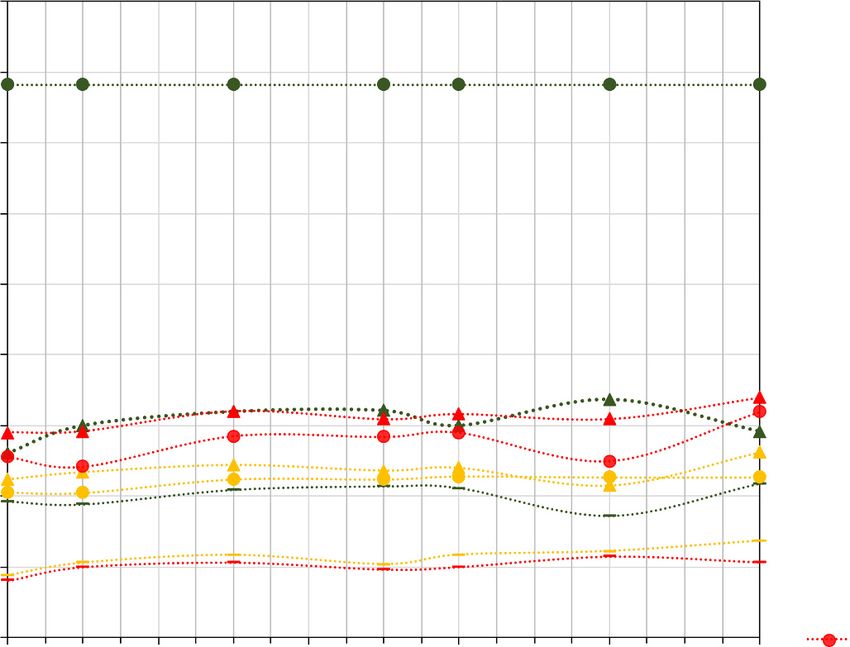
F. Agostinho et al. Cities 113 (2021) 103162
be identified: (1) Growth on abundant available resources, with a sharp 2.2.1. City boundary map
increase in the system’s population, structures and assets, based on low- In order to select a number of cities to be considered as a case study, a
efficiency and high competition; (2) Climax and transition, when the cluster analysis on the 645 cities of the State of São Paulo, Brazil was
system reaches the maximum size allowed by the available resources, performed. To identify the areas under study, a 2015 shapefile of city
becomes more efficient, develops collaborative competition patterns, boundaries available from the Brazilian Institute of Geography and
and stocks information; (3) Descent, with adaptations to resource scar Statistics (IBGE, 2019) was used, assessed in QGIS® 3.4.2. The State of
city, a decrease in population and assets, an increase in recycling pat São Paulo was chosen due to its economic importance and contribution
terns, and an efficient transmission of the information accumulated; (4) to Brazil’s gross domestic product. The State of São Paulo is character
Low-energy restoration, characterized by no-growth, consumption lower ized by a high concentration of energy, money, universities, research
than production, and increasing storage of resources to be used to feed centers, industries, population, and with high agrobusiness importance
the next cycle (Odum & Odum, 2006). for Brazil. Furthermore, São Paulo experienced substantial changes in
Modern societal development is based on fossil energy use and im urban dynamics during the last decades, thus representing an interesting
plies considering the Earth as a limitless source of resources with an case for the study of fractal structure of urban development. A hierar
infinite capacity for absorbing/diluting wastes generated by human chical cluster analysis considering the Euclidean distance was performed
activities. This wrong idea is inconsistent with the pulsing-paradigm of (i.e. the square root of the sum of the square differences among the
self-organization. Using peak oil production data, Bardi (2019) em measures considered) and selecting the Ward method as a parameter,
phasizes the importance of fossil fuel production for assets accumula which is one of the most appropriate methods for quantitative data.
tion. In this vein, we consider non-renewable emergy (energy derived Please refer to Murtagh (1983) for further details on the chosen cluster
from fossil fuels) as the main driver of pulsing-paradigm stages of variables.
growth and degrowth. Fossil energy has been driving growth during the We considered GDP per capita, percentage of total inhabitants living
last century, but its non-renewable nature implies that this energy in urban areas and inhabitants per square meter as similarity variables,
source will no longer be available to support growth, calling for alter which resulted in three clusters: G1 with 237 cities, G2 with 256 cities,
native energy sources and/or a redefinition of our systems organization and G3 with 152 cities (Fig. 3). These variables were chosen due to their
and dynamics away from business-as-usual. importance in representing the main characteristics of cities. A tendency
can be observed of G1 in having higher GDP per capita than other
clusters, followed by G3 and G2. Regarding the percentage of urban
2.2. Calculation procedures population, G3 includes cities with high concentration (from 90 to
100%) of people living in urban areas, closely followed by G1, while G2
Since different scientific approaches and data are used in this work, includes cities with lower concentration of people in urban areas (from
the methodological procedures are schematically represented by Fig. 2. 30 to 85%). Population density (in log scale) shows a similar behavior,
Two main stages and their procedures can be identified in the figure, with G3 presenting higher population density than G1 and G2. Ac
each one explained individually and in detail in the subsequent sections. cording to Fig. 3, G3 can be understood as a group of the ‘more
City boundary map
(vector)
(QGIS® software)
Night-time lights
DMSP-OLS imageries
(raster)
(QGIS® software)
Sum of lights (SOL) Boxcount
(QGIS® software) (Matlab® software)
SOL-nonrenewable
empower density
model (NRED)
NRED (sejN+F/ha yr) Fractal dimension
(Excel® software) (Matlab® software)
Pearson correlation
analysis
(Excel® software)
Input data Calculations
Fig. 2. Schematic representation of the methodological procedures used in this work. Legend: GIS = geographical information system; DMSP-OLS = Defense
meteorological satellite program - operational linescan system; SOL = sum of lights; sej = solar emjoule.
3
F. Agostinho et al. Cities 113 (2021) 103162
70000 100000 1.0
G3
G3 G2
0.9
60000 G1
G2
10000
0.8
Inhabitants per square meter (log scale)
G1
50000
GDP/capita (BRZ/person) 0.7
Urban population (%)
1000
40000 0.6
30000 0.5
100
0.4
20000
0.3
10
10000 G1
0.2
G2
G3
0 1 0.1
Fig. 3. Cluster results for the 645 sampled cities grouped according to three similarity variables. G, cluster.
urbanized’ cities that produce mainly industrialized goods and provide images are not sufficiently accurate at that scale. This returned a total
high quality services such as financial services, know-how development, sample of 212 (G1 with 84 cities, G2 with 72 cities and G3 with 56
and scientific research, among others. This results in high GPD genera cities), from which three cities from each cluster with the highest, lowest
tion but at the same time a strong resource dependency (energy, water,
food, etc.) from other regions. The opposite can be said for G2, char
acterized by ‘less urbanized’ cities where the economy seems to be based Table 1
on agricultural production and extraction of natural resources such as Cities of the State of São Paulo considered in this study.
minerals, wood, etc. At the same time, cities in G2 tend to have higher Cluster Human development index (HDI) within the cluster
biocapacity due to large areas of natural vegetation and cropland. Highest Median Lowest
Finally, G1 includes ‘moderately urbanized’ cities, an intermediate
G1 Assis Mirandópolis Itápolis
cluster between G3 and G2. G2 Presidente Bernardes Bananal Ribeirão Branco
Following Ge and Lin (2009), after running a cluster analysis, cities G3 Jundiaí Pompéia Jaboticabal
with an area smaller than 410 km2 were excluded, as DMSP-OLS satellite
Fig. 4. The nine cities of the State of São Paulo considered in this case study. Cities in green belong to cluster 1; cities in blue to cluster 2; cities in yellow to cluster 3.
(For interpretation of the references to color in this figure legend, the reader is referred to the web version of this article.)
4
F. Agostinho et al. Cities 113 (2021) 103162
and median value of human development index within the cluster were the larger economy ‘F’; U = R + N + F. Although characterized as re
selected, returning a total of 9 cities (Fig. 4 and Table 1). The HDI was sources imported from the larger economy, the ‘F’ resources are mostly
particularly considered when selecting representative cities from the dependent on fossil energy throughout their production chain, which
sample due to its ability to show the mutual relationship between people makes them non-renewable resources. Considering a business-as-usual
and the cities they live in. This case study can be replicated for a larger cities development model, ‘F’ has been shown in the emergy literature
sample of cities across the world. as the main driver sustaining cities, which renders it a good proxy to
assess cities development patterns and support discussions on cities’
2.2.2. Nighttime lights DMSP-OLS imageries pulsing paradigm. By using the SOL calculated for the cities under study,
The Earth Observation Group (EOG) of the National Centers for the SOL-NRED model can be used to derive the NRED (‘N’ + ‘F’, in sej/
Environmental Information at NOAA (https://ngdc.noaa.gov/eog/i ha year) of each city for the years 1992, 1994, 1998, 2002, 2004, 2008
ndex.html) provides annual cloud-free composite satellite images of and 2012.
night-time lights worldwide; images from 1992 onwards are available.
Night-time lights are mapped at a resolution of 900 m2 (30 × 30 m 2.2.6. Box-counting
pixels) on a digital-number scale with values ranging from 0 (totally Box-counting is a data gathering method which allows for investi
dark areas, e.g. in rural and wilderness settings) to 63 (maximum gating complex patterns by breaking images – among other information
brightness detectable by the sensor, e.g. in densely populated urban sources – into smaller and smaller pieces (usually in two dimensions).
areas). These images are used in a large number of studies on urban The image is analysed to understand whether or not some of its features
areas and energy use, as well as on a range of other aspects (Bennett & change with scale (Falconer, 2003). Several applications of box-
Smith, 2017; Elvidge et al., 2001, 2009; Jasinski, 2019; Li et al., 2018; counting are found in the scientific literature (e.g. Chatterjee et al.,
Sutton et al., 2012; Tuttle et al., 2013 and Xiao et al., 2018). From this 2019; Lovejoy et al., 1987; Wang et al., 2019). Box-counting consists of
dataset night-time lights data for the State of São Paulo for the years accommodating the image under study within a reticulate with squares
1992, 1994, 1998, 2002, 2004, 2008 and 2012 were extracted, since of size “s”, then the number of squares that intersect with the image are
1992 is the first year with available DMSP-OLS images and 2012 is the added up and represented by “N”. This process is repeated for multiple
latest one. Data were processed in QGIS® 3.4.2. iterations with reticulate of decreasing “s”, in order to provide statisti
cally significant results. The reclassified night-time satellite images for
2.2.3. Sum of lights (SOL) the nine cities for each year (giving a total of 63 images) were uploaded
The sum of lights (SOL) are obtained by the sum of the pixel values in MATLAB® R2020a and the following boxcount programing lines were
within an area, as an indicator of the total amount of night-lights emitted used: >boxcount(imagem), >>[N, s] = boxcount(imagem). A correla
from the cities under study. Before extracting the SOLs, the original tion matrix of “s” and “N” is obtained for each image, then used to
images derived from multiple satellites for the same year were calibrated calculate the fractal dimension of each city for each year.
following Elvidge et al. (2009) and Liu et al. (2012). For calibrating the
images, the F18/2012 image for the State of São Paulo was considered as 2.2.7. Cities’ fractal dimension
a reference, as it shows the highest values of SOL observed across the Fractals are complex geometrical structures characterized by self-
time-series. All “instable” pixels (i.e. lights observed only by one of similarity that cannot be measured by a simple topological dimension.
multiple satellites in a year from a specific pixel) were removed, and the The fractal dimension of a shape is a value that indicates how this shape
average value from different satellite observations of stable pixels was occupies the space in which it exists. The fractal dimension can assume
considered. According to Li et al. (2017), calibration is a necessary step fractional values, representing the degree of complexity of the shape.
to achieve a globally consistent series of night-time light values over the According to Addison (1997), the box-counting is a good method for
years, in order to track urban sprawl in rapidly-developing regions. measuring the fractal dimension, commonly used, as it is relatively easy
Values for each pixel are in accordance with the original image, ranging to apply when compared to other methods (e.g. Batty & Longley, 1994;
from 0 to 63. The values of pixels are summed up to calculate the SOL of Man et al., 2019). The “N-s” matrix obtained from the boxcounting al
each city for each studied year. Data were processed in QGIS® 3.4.2. lows investigating the relationship between the size of the squares in the
reticulate (“s”) with the number of squares that intercept the image
2.2.4. SOL – non-renewable empower density (NRED) model (“N”). From this, a linear logarithmic curve of the relationship between
The relationship between SOL and NRED (including both non- “1/s” and “N” can be derived, whose slope represents the fractal
renewable resources from nature ‘N’ and those imported from the dimension of the city under study. This procedure is repeated in this
larger economy ‘F’) was investigated by Coscieme et al. (2014a, 2014b). study for the different cities and years considered, calculating 63 fractals
More recently, Neri et al. (2018) developed a model that relates SOL dimensions. The following MATLAB® R2020a routine is used to obtain
with NRED, allowing for the reconstruction of continuous time series of the fractal dimension: >>>p=polyfit(log(s),log(N),1).
NRED at the national scale. This model is, however, not applicable at
city scale (Neri et al., 2018). In order to explore the relationship between 3. Results and discussion
SOL and NRED at the local scale, and considering the lack of emergy
data at city scale, emergy values calculated for the States of Brazil by 3.1. Temporal analysis of NRED and fractal dimension of cities
Demetrio (2011) were used instead. The SOL for the States of Brazil were
extracted following the method used for extracting SOL for cities, as Fig. 5 presents NRED from 1992 to 2012, estimated every two-four
previously described, and the correlation between SOL and NRED was years for the nine cities considered in this study. Under a general
explored. A significant positive correlation characterizes SOL and NRED view, some non-expected concave or convex trends for NRED can be
for the States of Brazil (sub-national scale), which is aligned to the observed, most prominently for Assis and Jaboticabal in 1998, and for
positive correlation between these variables obtained by Coscieme et al. Presidente Bernardes in 2008. Since all NRED values were estimated
(2014a) and Neri et al. (2018) when assessing national scales. Appendix through SOL, at first, significant changes would not occur for short time
A shows the numbers and procedures that resulted in the adjusted local periods between two-four consecutive years, since urban expansion
scale linear model sejN+F/ha = (2.36 E17 * SOL/ha) + 2.15 E15. usually occurs in larger time windows. Data and procedures were
carefully revised and, so far, the existing non-expected behavior due to
2.2.5. Non-renewable empower density (NRED) quality of satellite images used and/or due to the reduced area for the
The emergy investment ‘U’ in a city is the sum of renewable ‘R’ and evaluated cities could be explained (keeping in mind that images should
non-renewable ‘N’ emergy from nature with the emergy imported from have at least 512 pixels for an accurate box-counting procedure).
5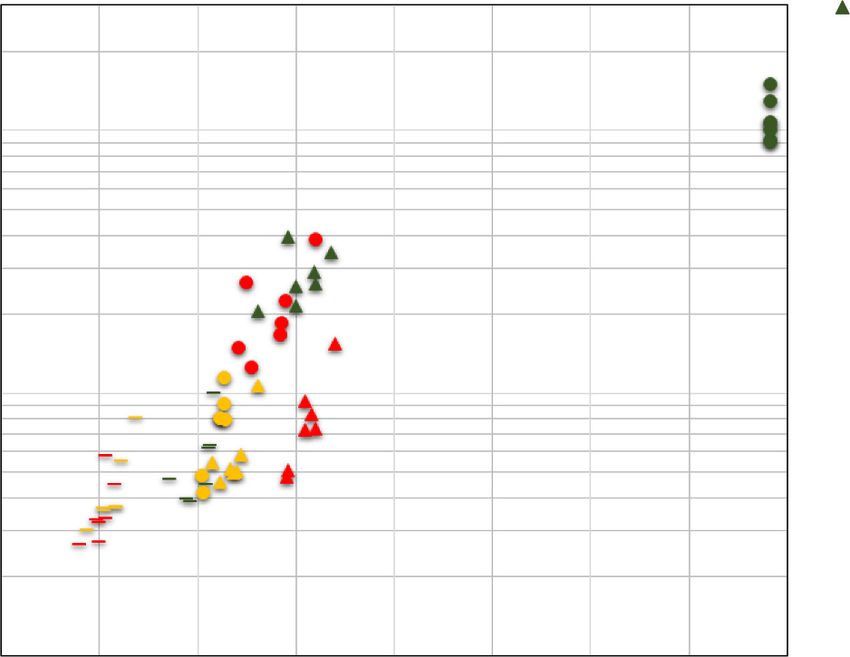
F. Agostinho et al. Cities 113 (2021) 103162
Assis, G1, highest
HDI
1.00E+17 Mirandopólis, G1,
median HDI
Nonrenewable empower density (sej/ha)
Itapólis, G1, lowest
HDI
Presidente
Bernardes, G2,
highest HDI
Bananal, G2, median
1.00E+16 HDI
Ribeirão Branco, G2,
lowest HDI
Jundiaí, G3, highest
HDI
Pompéia, G3,
median HDI
1.00E+15
Jaboticabal, G3,
1992 1996 2000 2004 2008 2012
lowest HDI
Year
Fig. 5. Non-renewable empower density time series (on a logarithmic scale) of the nine cities of the State of São Paulo considered in this study. HDI: human
development index. G: cluster.
Anyhow, the currently best data and satellite images were used and once PPC, with different growth rates: while Jundiaí increased its demand for
better data become available, these numbers can be revisited. non-renewable emergy by 64%, all other cities show an increase be
Fig. 5 indicates that the HDI rank has no influence on NRED dy tween 92% to 222% during 1992–2012. With the exception of Assis,
namics, as cities with median HDI show similar trends, while the highest Fig. 5 indicates that cities belonging to the G3 cluster have the highest
difference among NRED characterize cities with the highest HDI. Simi NRED throughout the time series, which is indicative of ‘more urban
larly, specific NRED trends do not emerge for specific clusters, with the ized’ cities depending on high quality external resources. Clusters G1
exception of cluster G2. This indicates that the variables used in the and G2 are at a later stage of growth, as compared to G3, so it is expected
cluster analysis, as well as the HDI, do not have any particular effect on that their growth rate will slow down once they reach performances
consumption trends of non-renewable resources per unit area. It is worth similar to those of the cities in G3.
noting that the variables considered for the cluster analysis reflect data There is no clear evidence of a relationship among clusters and/or
for 2018–2020, so cluster results refer to the current characteristics of HDI with the fractal dimension of the cities investigated (Fig. 6).
cities, and not to cities characteristics earlier in the time series. None of Although recognizing that reducing the complex dynamics into a single
the cities investigated seems to have entered a stage of degrowth in the value of fractal dimension could lead to oversimplification and over
pulsing-paradigm curve (PPC; Fig. 1). These findings are in line with generalization (Chen & Zhou, 2008), some considerations can be drawn
Agostinho et al. (2018), who used total emergy of cities to study their from Fig. 6. From 1992 to 2012, fractal’s growth rate ranged from 0 to
growth. The city of Jundiaí shows the highest emergy demand for the 1.9%. These rates indicate that while cities experienced a fast increase in
entire period. All of the cities investigated are at the growth stage of the non-renewable emergy demand (Fig. 5), they did not experience any
2.00 Assis, G1, highest
HDI
1.95
Mirandópolis, G1,
median HDI
1.90
Itapólis, G1, lowest
HDI
Fractal (dimensionless)
1.85
Presidente
1.80 Bernardes, G2,
highest HDI
Bananal, G2, median
1.75 HDI
Ribeirão Branco, G2,
1.70 lowest HDI
Jundiaí, G3, highest
1.65
HDI
1.60 Pompéia, G3, median
HDI
1.55 Jaboticabal, G3,
1992 1996 2000 2004 2008 2012 lowest HDI
Year
Fig. 6. Fractal dimension time series of the nine cities of the State of São Paulo considered in this study. Raw data are presented in Supplementary material B. HDI:
human development index. G: cluster.
6F. Agostinho et al. Cities 113 (2021) 103162
significant change in their rate of physical expansion. This indicates that organizing systems conforming to certain natural laws, just like many
the speed of urban expansion differs from the speed of increasing energy physical systems. However, differently from Chen and Huang (2019),
demand in terms of NRED. In particular, the city of Jundaí maintains its who identified PPC-like behaviors represented by Boltzmann equation,
fractal dimension of 1.94 from 1992 to 2012, indicating no urban logistic function, and quadratic logistic function, our results from Figs. 5
expansion. A constant fractal dimension indicates that a city (i) has and 6 did not show the expected growth-degrowth PPC stages for the
achieved its maximum physical expansion (i.e., there is no extra avail studied cities.
able area to be urbanized), or (ii) there is still potential for urban
expansion but this option is not considered in terms of territorial plan 3.2. Relationship between NRED and fractal dimension
ning. It is worth highlighting that both cases are relevant due to the long-
term temporal analysis (20 years) performed in this study, as the same The relationship between NRED and the fractal dimension of the
analysis performed over a shorter period could have missed the rela cities under study is assessed to understand to what extent the metabolic
tively slow process of urban expansion. (i.e. quantity, quality and distribution of energy use) and the spatial
The fractal dimension of cities over time will hardly show similar dynamics of cities resemble, or not, one another. From Fig. 7, an increase
behavior when compared to that presented by the pulsing-paradigm in both NRED and the fractal dimension over time can be observed, with
curve (PPC) of Fig. 1, mainly for the degrowth stage, since a reduction the former increasing at a faster rate than the latter. While the fractal
of the fractal dimension implies a reduction of the urbanized area, which dimension represents urban expansion by filling a two-dimensional
is observed in relatively few cases, such as when, for example, urban space, the NRED represents the density of systems demand for
build-up is replaced by green areas as urban parks, or even due to urban emergy. Increasing urbanization, including a more vast urbanized space,
decay. Urban decay or shrinking cities has no single cause, usually it is a will likely lead to an increase in NRED, while this is not necessarily true
result from combinations of socio-economic conditions. As discussed by the other way around. In fact, as both variables emergy and fractals were
Reese et al. (2017) and Audirac (2018), external drivers of decay include derived from two-dimensional night-time satellite observations, one of
overreliance on industries coupled with long term structural downturns the missing elements is the vertical component of urban growth. Further
in these industries, poorly skilled labor available, increasing amount of studies are presenting how it is possible to assess vertical growth of cities
jobs available in the suburbs, suburbanization process, policies sup over time relying on radar, lidar and scatterometer remote sensing data
porting the development of suburbs rather than inner cities, national (e.g. Mahtta et al., 2019). Although recognizing that all these charac
policies promoting housing development in suburbs and exurbs. Other teristics could result in a non-correlation between NRDE and fractal
drivers include tight rent control, the poverty of the local inhabitants, dimension, Fig. 7 shows that for the nine cities considered over 20 years,
the construction of freeway roads and rail road lines that bypass the a positive linear correlation exists (Pearson’s correlation coefficient of
inner cities, real estate neighborhood redlining, immigration re 0.94). The existing correlation is an important finding of this work
strictions, or even just heat cost. Fractal retraction aiming for more because it can be useful in estimating NREDs from fractals, providing
positive purposes rather than urban decay can happen, however, it de such important and scarce data to further emergy synthesis.
mands a strong socio-political and economic effort, since urban areas are The G3 cluster includes ‘more urbanized’ cities that can be consid
highly valued and priced (i.e. dollars per square-meter), and hardly ever ered in an advanced stage of urbanization whose characteristics are
would a green area be developed on an already constructed area. This higher GDP and urban population density but at the expense of higher
implies that a constant fractal dimension can be indicative of a climax or dependence on external resources to support growth and absorb waste.
a degrowth stage on the PPC (Fig. 1). As the HDI of Jundiai is the highest Regarding ‘less urbanized’ cities, the G2 cluster includes agricultural
within its cluster, and its fractal dimension has remained constant since and extrativism-based economic systems that, although generating
1992, the hypothesis that Jundiai reached its limits to growth could be lower GDP, live within their own biocapacity. All of the cities studied
established. show the same development pattern for growth based on territorial
According to Chen (2009), both natural and human dominated sys expansion and increasing NRED, however, at the same time, it seems
tems have similar patterns for space-filling properties, which is sup they have different development stages (Fig. 7).
ported by the statement of Chen and Zhou (2008) that cities are self- Another important aspect brought by Fig. 7 is related to temporal
Assis, G1, highest HDI
Pearson correlation of 0.94
Mirandópolis, G1,
median HDI
Nonrenewable empower density (sej/ha yr)
1.0E+17
Itapólis, G1, lowest
HDI
Presidente Bernardes,
G2, highest HDI
Bananal, G2, median
1.0E+16 HDI
Ribeirão Branco, G2,
lowest HDI
Jundiaí, G3, highest
HDI
Pompéia, G3, median
1.0E+15 HDI
1.55 1.65 1.75 1.85 1.95
Jaboticabal, G3,
Fractal (dimensionless) lowest HDI
Fig. 7. Scatterplot of nonrenewable empower density (logarithmic scale) and fractal dimensions for the years 1992, 1994, 1998, 2002, 2004, 2008 and 2012 for the
nine cities of the State of São Paulo considered in this study. HDI: human development index. G: cluster.
7F. Agostinho et al. Cities 113 (2021) 103162
pattern, resulting in the ‘attractor’ role. Jundiai city has a constant Table 2
fractal for all the period and it seems that its performance acts as a Pearson correlation coefficient of fractal dimension and nonrenewable empower
potential attractor for all other cities. In other words, it seems that all density for different groups of cities.
cities are pursuing the performance obtained by Jundiaí city, similarly to Groups based on clusters
a gravitational force pulling bodies. In this sense, it is hypothesized that Cluster G1 G2 G3
Jundiai’s performance could be understood as a target for all other cities
Cities Assis, Presidente Bernardes, Jundiaí, Pompéia
that are currently in a different stage of their own development process
Mirandópolis and Bananal and Ribeirão and Jaboticabal
and probably, sooner or later, they will reach the same position or stage Itápolis Branco
shown by Jundiai city. Also observed from Fig. 7 is that HDI appears to Pearson’s 0.51 0.60 0.97
have no influence on cities’ performance, since they are randomly rep coefficient
resented; similar results were obtained by Costa (2014) when assessing
the relationship between fractals and HDI for eight Brazilian capitals. Groups based on HDI levels
Pearson’s correlation coefficients for the different clusters and the HDI level Highest HDI Median HDI Lowest HDI
different HDI ranks across the clusters are presented in Table 2. Results
Cities Assis, Presidente Mirandópolis, Itápolis, Ribeirão
show that G3 and the group with highest HDI (within clusters) are
Bernardes and Bananal and Branco and
characterized by a strong positive correlation between NRED and the Jundiaí Pompéia Jaboticabal
fractal dimension (0.97 and 0.96, respectively), while weak positive Pearson’s 0.96 0.56 0.54
correlation coefficients were obtained for the other four groups. This coefficient
means that urban expansion is reflected by an increase in NRED for those
‘more urbanized’ cities and for cites with high development (HDI)
urban expansion studies when large amounts of data are necessary. We
within each cluster.
observed that NRDE-fractal correlation is higher in cities with the
The results provide insights on the dynamics of NRED and the fractal
highest human development index (Assis, Presidente Bernardes and
dimension that are informative for understanding quantitative aspects of
Jundiaí; Pearson of 0.96) and in those belonging to cluster 3 (Jundiaí,
cities growth and degrowth. Our approach constitutes a useful tool for
Pompéia and Jaboticabal; Pearson of 0, 97), suggesting that the higher
assessing progresses in understanding the limits to growth for cities, that
the ‘urbanization’ and ‘social development’ level of the city, the higher
could be complemented by including further indicators on sustainability
the NRDE-fractal correlation.
aspects such as job quality, happiness, community interaction, equal
As tools for observing and investigating pulsing-paradigm behaviors,
access to essential services, among others, as recognized important by
fractal dimension and NRED indicate that the cities considered in this
Ulgiati and Zucaro (2019) and Jackson (2019). In addition, the renew
study are all at the growing stage, showing no signs that any limit to
able component of empower should also be included in future similar
growth has been considered in territorial planning, with the exception of
analysis. Further developments of this study will include considering a
one city, Jundiaí, which did not experience any urban expansion over
larger number of cities through a broader period.
the period considered while its demand for non-renewable emergy kept
After presenting and discussing the obtained results under a critical
growing. In this vein, our approach gives important insights into the
scientific viewpoint, one can suggest, as takeaway for practice, the use of
coupling degree of urban area expansion and emergy demand.
the proposed method in estimating NREDs from fractals. Besides saving
time and money, due to easier satellite imagery processing compared to
traditional fractals calculation procedure, the proposed approach will CRediT authorship contribution statement
overcome the lack of data on emergy flows for cities scale, and support
further additional research focused on understanding the limits to Feni Agostinho: Conceptualization, Methodology, Writing (original
growth for cities through an emergy accounting perspective. The higher draft preparation, reviewing and editing). Márcio Costa: Software, Data
the availability and accuracy of data is, the more efficient public policies curation. Luca Coscieme: Writing (reviewing and editing). Cecília M.V.
towards a sustainable future for cities will be. B. Almeida: Writing (review). Biagio F. Giannetti: Conceptualization.
4. Conclusions
Declaration of competing interest
In this study, a novel methodological approach for estimating the
fractal dimension of cities over time from night-time lights observations None.
was developed and applied. The method is effective and relies on a
smaller amount of data, and consequently faster processing time, as Acknowledgements
compared to other methods based on land-cover images. Night-time
satellite DMSP-OLS and, more recently, VIIRS images are available The authors are grateful for the financial support received from Vice-
free-of-charge, and do not require an image classification process. These Reitoria de Pós-Graduação da Universidade Paulista (UNIP). MC is
data can thus be directly used to perform a boxcounting analysis to grateful to the scholarship provided by Coordenação de Aperfeiçoa
compute fractal dimension of territorial systems evolving over time. mento de Pessoal de Nível Superior - Brasil (CAPES - Finance Code 001).
In considering non-renewable empower density (NRED) trends over FA is grateful to the financial support provided by CNPq Brazil (452378/
nine cities in the State of São Paulo, results highlighted that NRED has a 2019-2; 302592/2019-9). LC is funded by an IRC/Marie Skłodowska-
strong positive linear correlation with the extent and shape of urban Curie CAROLINE Postdoctoral Fellowship (IRC-CLNE/2017/567). The
expansion as represented by the fractal dimension (Pearson’s coefficient work of José Hugo de Oliveira for the English language review is
of 0.94). This finding is important for developing future emergy and/or acknowledged.
8F. Agostinho et al. Cities 113 (2021) 103162
Appendix A. Adapted model relating sum of lights (SOL) with non-renewable empower density (NRED)
Table A
Obtaining the SOL-NRED model.
Brazilian states Area (ha) SOLa SOL/ha Real NREDb (sejN+F/ Estimated NREDc Difference between NREDsd Corrected NREDe
(2007) ha) (sejN+F/ha) (sejN+F/ha) (sejN+F/ha)
Amazonas 1.56E+08 8.20E+04 5.26E- 3.59E+14 2.11E+15 − 1.75E+15 3.29E+15
04
Acre 1.64E+07 2.86E+04 1.74E- 3.05E+14 2.35E+15 − 2.04E+15 3.53E+15
03
Rondônia 2.38E+07 7.51E+04 3.16E- 7.99E+14 2.63E+15 − 1.83E+15 3.82E+15
03
Roraima 2.24E+07 2.20E+05 9.81E- 8.92E+13 3.96E+15 − 3.87E+15 5.15E+15
03
Amapá 1.42E+07 2.26E+04 1.59E- 2.11E+14 2.32E+15 − 2.11E+15 3.50E+15
03
Pará 1.25E+08 2.21E+05 1.77E- 1.26E+15 2.35E+15 − 1.09E+15 3.54E+15
03
Tocantins 2.78E+07 6.78E+04 2.44E- 9.00E+14 2.49E+15 − 1.59E+15 3.67E+15
03
Mato Grosso 9.03E+07 1.65E+05 1.83E- 3.27E+15 2.37E+15 9.00E+14 3.55E+15
03
Mato Grosso do Sul 3.57E+07 1.24E+05 3.48E- 4.14E+15 2.70E+15 1.45E+15 3.88E+15
03
Goiás 3.40E+07 2.93E+05 8.60E- 4.85E+15 3.72E+15 1.13E+15 4.90E+15
03
Distrito Federal 5.76E+05 1.15E+05 2.00E- 4.51E+16 4.21E+16 3.05E+15 4.33E+16
01
Rio Grande do Sul 2.82E+07 5.19E+05 1.84E- 9.34E+15 5.69E+15 3.65E+15 6.87E+15
02
Santa Catarina 9.57E+06 3.80E+05 3.97E- 1.30E+16 9.94E+15 3.01E+15 1.11E+16
02
Paraná 1.99E+07 5.35E+05 2.68E- 2.17E+16 7.37E+15 1.43E+16 8.55E+15
02
Minas Gerais 5.87E+07 8.85E+05 1.51E- 1.35E+16 5.02E+15 8.43E+15 6.20E+15
02
Rio de Janeiro 4.38E+06 5.45E+05 1.24E- 3.41E+16 2.69E+16 7.16E+15 2.81E+16
01
Espirito Santo 4.61E+06 Outlier Outlier Outlier Outlier Outlier Outlier
São Paulo 2.48E+07 1.79E+06 7.21E- 2.96E+16 1.64E+16 1.31E+16 1.76E+16
02
Maranhão 3.30E+07 1.44E+05 4.38E- 5.61E+15 2.88E+15 2.74E+15 4.06E+15
03
Piauí 2.52E+07 9.06E+04 3.60E- 1.59E+15 2.72E+15 − 1.13E+15 3.90E+15
03
Ceará 1.49E+07 2.85E+05 1.91E- 5.51E+15 5.82E+15 − 3.17E+14 7.01E+15
02
Rio Grande do Norte 5.28E+06 1.36E+05 2.58E- 3.60E+15 7.16E+15 − 3.56E+15 8.35E+15
02
Paraíba 5.65E+06 1.88E+05 3.34E- 4.96E+15 8.67E+15 − 3.71E+15 9.85E+15
02
Pernambuco 9.81E+06 2.74E+05 2.80E- 6.83E+15 7.59E+15 − 7.61E+14 8.78E+15
02
Alagoas 2.78E+06 1.21E+05 4.33E- 7.90E+15 1.07E+16 − 2.75E+15 1.18E+16
02
Sergipe 2.19E+06 9.62E+04 4.39E- 9.12E+15 1.08E+16 − 1.65E+15 1.20E+16
02
Bahia 5.65E+07 4.92E+05 8.72E- 3.72E+15 3.74E+15 − 2.48E+13 4.93E+15
03
Average value for deviations¼ 1.18Eþ15
a
Sum of lights (SOL) obtained through QGIS® 3.4.2 software as explained in the main text.
b
Obtained from the study of Demetrio (2011) and calculated on the emergy baseline of 15.83E24 sej/year (Odum et al., 2000).
c
Estimated through the model presented in Fig. A.
d
(Real NRED, column #5) − (Estimated NRED, column #6).
e
Corrected NRED = (Estimated NRED of column #6) + (Average values for deviations).
9F. Agostinho et al. Cities 113 (2021) 103162
6.0E+16
5.0E+16
y = 2.36E+17x + 2.15E+15
"Real" empowwer (sejN+F/ha)
R² = 8.43E-01
4.0E+16
3.0E+16
2.0E+16
1.0E+16
0.0E+00
0.0E+00 5.0E-02 1.0E-01 1.5E-01 2.0E-01 2.5E-01
SOL/ha
Fig. A. Correlation graph between sum of lights (SOL/ha) and “Real” non-renewable emergy density (sejN+F/ha). Emergy baseline of 15.83E24 sej/year (Odum et al.,
2000). Raw data presented in Table A.
The final model (annual basis and referred to an emergy baseline of 15.83E24 sej/year) is obtained by adding the average of deviations of Table A
in the model of Fig. A:
Adjusted non − renewable emergy in sejF+N /ha = (2.36 E17*(SOL/ha) ) + 2.15 E15
Appendix B. Supplementary data
Supplementary data to this article can be found online at https://doi.org/10.1016/j.cities.2021.103162.
References Coscieme, L., Pulselli, F. M., Bastianoni, S., Elvidge, C. D., Anderson, S., & Sutton, P. C.
(2014a). A thermodynamic geography: night-time satellite imagery as a proxy
measure of emergy. Ambio, 43, 969–979.
Addison, P. S. (1997). Fractals and chaos (1st ed.). Institute of Physics Publishing (272
Coscieme, L., Mancini, S., Sutton, P. C., & Marchettini, N. (2014b). Using night-time
pp.).
satellite imagery to visualize emergy density in territorial systems. The Sustainable
Agostinho, F., Ambrósio, L. A., & Ortega, E. (2010). Assessment of a large watershed in
City IX 1, 343-349. WIT Transactions on Ecology and The Environment, 191. https://
Brazil using emergy evaluation and geographical information system. Ecological
doi.org/10.2495/SC140291.
Modelling, 221, 1209–1220.
Costa, P. C. D. (2014). Análise fractal de formas urbanas: estudo sobre a dimensão fractal e o
Agostinho, F., Sevegnani, F., Almeida, C. M. V. B., & Giannetti, B. F. (2018). Exploring
Índice de Desenvolvimento Humano Municipal (IDHM). São Paulo, Brazil: Presbiteriana
the potentialities of emergy accounting in studying the limits to growth of urban
Mackenzie University. Available at http://tede.mackenzie.br/jspui/handle/tede/
systems. Ecological Indicators, 94, 4–12.
1438. (Accessed 23 February 2020) (Dissertation).
Agostinho, F., Richard Silva, T., Almeida, C. M. V. B., Liu, G., & Giannetti, B. F. (2019).
Demetrio, J. F. C. (2011). Environmental sustainability assessment of Brazil using emergy
Sustainability assessment procedure for operations and production processes
accounting. Brazil: Paulista University. Available at http://www.advancesincleane
(SUAPRO). Science of the Total Environment, 685, 1006–1018.
rproduction.net/papers/dissertations/demetrio_fjc.pdf. (Accessed 8 June 2019)
Audirac, A. (2018). Shrinking cities: An unfit term for American urban policy? Cities, 75,
(PhD thesis).
12–19.
Elvidge, C. D., Imhoff, M. L., Baugh, K. E., Hobson, V. R., Nelson, I., Safran, J.,
Bardi, U. (2015). Limits to growth. International Encyclopedia of the Social & Behavioral
Dietz, J. B., & Tuttle, B. T. (2001). Night-time lights of the world: 1994–1995.
Sciences, 14, 138–143.
Photogrammetry & Remote Sensing, 56, 81–99.
Bardi, U. (2019). Peak oil, 20 years later: Failed prediction or usefull insight? Energy
Elvidge, C. D., Ziskin, D., Baugh, K. E., Tuttle, B. T., Ghosh, T., Pack, D. W., Erwin, E. H.,
Research & Social Scienece, 48, 257–261.
& Zhizhin, M. (2009). A 472 fifteen year record of global natural gas flaring derived
Batty, M., & Longley, P. A. (1994). Fractal cities: A geometry of form and function. Londom,
from satellite data. Energies, 2, 595–622.
UK: Academic Press.
Evans, J. (2019). Governing cities for sustainability: A research agenda and invitation.
Benguigui, L., Czamanski, D., Marinov, M., & Portugali, Y. (2000). When and where is a
Frontiers in Sustainable Cities, (June 2019)https://doi.org/10.3389/frsc.2019.00002.
city fractal? Environment and Planning B: planning and design, 27, 507–519.
Falconer, K., 2003. Fractal geometry: Mathematical foundations and applications. Third
Bennett, M. M., & Smith, L. C. (2017). Advances in using multitemporal night-time lights
edition, Wiley, (eBook, 386 pp.).
satellite imagery to detect, estimate, and monitor socioeconomic dynamics. Remote
Fistola, R. (2011). The unsustainable city. Urban entropy and social capital: The needing
Sensing of Environment, 192, 176–197.
of a new urban planning. Procedia Engineering, 21, 976–984.
Braham, W. W., Lee, J. M., Oskierko-Jeznacki, E., Silverman, B., & Khansari, N. (2019).
Frankhauser, P. (1998). The fractal approach - A new tool for the spatial analysis of
Spatial concentration of urban assets in the Philadelphia region: An emergy
urban agglomerations. In Population (pp. 205–240). Available at https://www.
synthesis. Ecological Modelling, 401, 52–68.
persee.fr/doc/pop_0032-4663_1998_hos_10_1_6828. (Accessed 26 February 2020).
Brown, M. T., & Ulgiati, S. (2011). Understanding the global economic crisis: A
Ge, M., & Lin, Q. (2009). Realizing the box-counting method for calculating fractal
biophysical perspective. Ecological Modelling, 223, 4–13.
dimension of urban form based on remote sensing image. Geo-spatial Information
Chatterjee, S., Dey, D., & Munshi, S. (2019). Integration of morphological preprocessing
Science, 12, 265–270.
and fractal based feature extraction with recursive feature elimination for skin lesion
Ghosh, T., Anderson, S., Powell, R. L., Sutton, P. C., & Elvidge, C. D. (2009). Estimation of
types. Computer Methods and Programs in Biomedicine, 178, 201–218.
Mexico’s informal economy and remittances using nighttime imagery. Remote
Chen, Y. (2009). Analogies between urban hierarchies and river networks: Fractals,
Sensing, 1, 418–444.
symmetry, and self-organized criticality. Chaos, Solitons and Fractals, 40, 1766–1778.
Ghosh, T., Anderson, S. J., Elvidge, C. D., & Sutton, P. C. (2013). Using nighttime satellite
Chen, Y. (2014). The spatial meaning of Pareto’s scaling exponent of city-size
imagery as a proxy measure of human well-being. Sustain. Sci. Pract. Policy, 5, 1–32.
distributions. Fractals, 22. https://doi.org/10.1142/S0218348X14500017.
https://doi.org/10.3390/su5124988.
Chen, Y., & Huang, L. (2019). Modeling growth curve of fractal dimensiono f urban form
Ghosh, T., Powell, L. R., Elvidge, D. C., Baugh, E. K., Sutton, C. P., & Anderson, S. (2010).
of Beijing. Physica A: Statistical Mechanics and its Applications, 523, 1038–1056.
Shedding light on the global distribution of economic activity. Open Geog. J., 3.
Chen, Y., & Zhou, Y. (2008). Scaling laws and indications of self-organized criticality in
Giannetti, B. F., Almeida, C. M. V. B., & Bonilla, S. H. (2010). Comparing emergy
urban systems. Chaos, Solutions & Fractals, 35, 85–98.
accounting with well-known sustainability metrics: the case of southern cone
common market. Mercosur. Energy Policy, 38, 3518–3526.
10F. Agostinho et al. Cities 113 (2021) 103162
Giannetti, B. F., Agostinho, F., Almeida, C. M. V. B., & Sevegnani, F. (2020). Conceptual Odum, H. T. (1996). Environmental accounting – Emergy and environmental decision making.
analysis on the way Brazilian cities work: a macroscope view. Frontiers Sustainable Inc: John Wiley & Sons (370 pp.).
Cities, 2, 1–12. https://doi.org/10.3389/frsc.2020.00013. Odum, H. T. (2007). Environment, power, and society for the twenty-first century. New York:
Henderson, J. V., Storeygard, A., & Weil, D. N. (2012). Measuring economic growth from Columbia University Press.
outer space. The American Economic Review, 102, 994–1028. https://doi.org/ Odum, H. T., Brown, M. T., & William, S. B. (2000). Handbook of emergy evaluation: A
10.1257/aer.102.2.994. compendium of data for emergy computation issued in a series of folios. In Folio
Hu, Y., & Yao, J. (2019). Illuminating economic growth. Available online at:. IMF https #1—Introduction and global budget. Gainesville, Florida: Center for Environmental
://www.imf.org/en/Publications/WP/Issues/2019/04/09/Illuminating-Economic Policy. University of Florida.
-Growth-46670. (Accessed 26 March 2020). Odum, H. T., & Odum, E. C. (2006). The prosperous way down. Energy, 31, 21–32.
IBGE. (2019). Brazilian Institute of Geography and Statistics. Available at https://mapas. Pulselli, R. M. (2010). Integrating emergy evaluation and geographic information
ibge.gov.br/bases-e-referenciais/bases-cartograficas/malhas-digitais.html. systems for monitoring resource use in the Abruzzo region (Italy). Journal of
(Accessed 23 May 2019). Environmental Management, 91, 2349–2357.
Jackson, T. (2019). The post-growth challenge: Secular stagnation, inequality and the Reese, L. A., Eckert, J., Sands, G., & Vojnovic, I. (2017). “It’s safe to come, we’ve got
limits to growth. Ecological Economics, 156, 236–246. lattes”: Development disparities in Detroit. Cities, 60, 367–377.
Jacobi, P. R. (2013). São Paulo, the unsustainable metropolis – How can we overcome this Schweitzer, F., & Steinbrink, J. (1998). Estimation of megacity growth – Simple rules
reality? (vol. 15, pp. 219–239) São Paulo: Cad. Metrop.. Available at https://revistas. versus computers phenomena. Applied Geography, 18, 69–81.
pucsp.br/metropole/article/view/15823. (Accessed 9 June 2019) (paper in SDG. (2019). The 2030 agenda for sustainable development. Sustainable development
Portuguese). goals. Available at. United Nations Environmental Program https://sustainabledeve
Jasinski, T. (2019). Modeling electricity consumption using nighttime light images and lopment.un.org/topics/sustainabledevelopmentgoals. (Accessed 25 August 2019).
artificial neural networks. Energy, 179, 831–842. Sevegnani, F., Giannetti, B. F., Almeida, C. M. V. B., Agostinho, F., & Brown, M. (2018).
Lee, D. J., & Brown, M. T. (2019). Renewable empower distribution of the world. Journal Accounting for internal stocks in assessing the sustainability of urban systems: The
of Environmental Accounting and Management, 7(1), 11–27. case of ABC Paulista. Ecological Indicators, 94, 70–81.
Li, X., Zhou, Y., Asrar, G. R., Imhoff, M., & Li, X. (2017). The surface urban heat island Sodiq, A., Baloch, A. A. B., Khan, S. A., Sezer, N., Mahmoud, S., Jama, M., & Abdelaal, A.
response to urban expansion: A panel analysis for the conterminous United States. (2019). Towards modern sustainable cities: Review of sustainability principles and
Science of the Total Environment, 605-606, 426–435. trends. Journal of Cleaner Production, 227, 972–1001.
Li, X., Zhou, Y., Zhu, Z., Liang, L., Yu, B., & Cao, W. (2018). Mapping annual urban Sutton, P. C., Anderson, S. J., Tuttle, B. T., & Morse, L. (2012). The real wealth of nations:
dynamics (1985–2015) using time series of Landsat data. Remote Sensing of Mapping and monetizing the human ecological footprint. Ecological Indicators, 16,
Environment, 216, 674–683. 11–22.
Liu, Z., He, C., Zhang, Q., Huang, Q., & Yang, Y. (2012). Extracting the dynamics of urban Sutton, P. C., Elvidge, C. D., & Ghosh, T. (2007). Estimation of Gross Domestic Product at
expansion in China using DMSP-OLS nighttime light data from 1992 to 2008. sub-national scales using nighttime satellite imagery. International Journal of
Landscape and Urban Planning, 106, 62–72. Ecological Economics & Statistics (IJEES), 8, 5–21.
Lovejoy, S., Schertzer, D., & Tsonis, A. A. (1987). The functional box-counting and Tuttle, B. T., Anderson, S. J., Sutton, P. C., Elvidge, C. D., & Baugh, K. (2013). It used to
multiple elliptical dimensions in rain. Science, 234, 1036–1038. be dark here: Geolocation calibration of the Defense Meteorological Satellite
Mahtta, R., Mahendra, A., & Seto, K. C. (2019). Building up or spreading out? Typologies Program Operational Linescan System. Photogrammetric Engineering and Remote
of urban growth across 478 cities of 1 million+. Environmenrtal Research Letters, 14, Sensing, 79, 287–297.
124077. Ulgiati, S., Zucaro, A., 2019. Challenges in urban metabolism: Sustainability and well-
Man, W., Nie, Q., Li, Z., Li, H., & Wu, X. (2019). Using fractals and multifractals to being in cities. Frontiers in Sustainable Cities 1:1, doi:103389/frsc.2019.00001.
characterize the spatiotemporal pattern of impervious surfaces in a coastal city: UN. (2019a). United Nations Environment Program. Available at https://www.unenvir
Xiamen, China. Physica A: Statistical Mechanics and its Applications, 520, 44–53. onment.org/regions/asia-and-pacific/regional-initiatives/supporting-resource-
Marques, M. L. (2005). Metodologias para estimativa da dimensão fractal do crescimento efficiency/sustainable-cities. (Accessed 25 August 2019).
de aglomerados urbanos: uma contribuição ao estudo da expansão urbana da região UN. (2019b). United Nations Environment Program. Chapter III: Towards sustainable
metropolitana de São Paulo entre 1905 e 2001. Available at https://repositorio. cities. Available at https://www.un.org/en/development/desa/policy/wess/wess_
unesp.br/handle/11449/100072?locale-attribute=en. (Accessed 27 February 2020) current/wess2013/Chapter3.pdf. (Accessed 27 August 2019).
(PhD dissertation, in portuguese). Wackernagel, M., Hanscom, L., & Lin, D. (2017). Making the sustainable development
Mellander, C., Lobo, J., Stolarick, K., & Matheson, Z. (2015). Night-time light data: A goals consistent with sustainability. Front. Energy Res., (11 July 2017)https://doi.
good proxy measure for economic activity? PLoS One, 10, Article e0139779. https:// org/10.3389/fenrg.2017.00018.
doi.org/10.1371/journal.pone.0139779. Wang, Y., Liu, S., & Wang, W. (2019). Fractal dimension analysis and control of Julia set
Mellino, S., Ripa, M., Zucaro, A., & Ulgiati, S. (2014). An emergy-GIS approach to the generated by fractional Lotka-Volterra. Communications in Nonlinear Science and
evaluation of renewable resource flows: A case study of Campania region, Italy. Numerical Simulation, 72, 417–431.
Ecological Modelling, 271, 103–112. Ward, J. D., Mohr, S. H., Myers, B. R., & Nel, W. P. (2012). High estimates of supply
Mohr, S. H., Wang, J., Ellem, G., Ward, J., & Giurco, D. (2015). Projection of world fossil constrained emissions scenarios for long-term climate risk assessment. Energy Policy,
fuels by country. Fuel, 141, 120–135. 51, 598–604.
Murtagh, F. (1983). A survey of recent advances in hierarchical clustering algorithms. Xiao, H., Ma, Z., Mi, Z., Kelsey, J., Zheng, J., Yin, W., & Yan, M. (2018). Spatio-temporal
The Computer Journal, 26, 354–359. simulation of energy consumption in China’s provinces based on satellite night-time
Neri, L., Coscieme, L., Giannetti, B. F., & Pulselli, F. M. (2018). Imputing missing data in light data. Applied Energy, 231, 1070–1078.
non-renewable time series from night-time lights observations. Ecological Indicators, Xu, X., & Min, X. (2013). Quantifying spatiotemporal patterns of urban expansion in
84, 106–118. China using remote sensing data. Cities, 35, 104–113.
Newman, P. (2020). Cool planning: How urban planning can mainstream responses to Zhang, X., & Li, H. (2018). Urban resilience and urban sustainability: What we know and
climate change. Cities, 103, 102651. what do not know? Cities, 72, 141–148.
11You can also read