Management's Discussion and Analysis - For the three and nine months ended June 30, 2021 and 2020
←
→
Page content transcription
If your browser does not render page correctly, please read the page content below

Management’s Discussion and Analysis
For the three and nine months ended June 30, 2021 and 2020
Management’s Discussion and Analysis       |   For the three and nine months ended June 30, 2021 and 2020

July 28, 2021

BASIS OF PRESENTATION
This Management’s Discussion and Analysis of the Financial Position and Results of Operations (MD&A) is the
responsibility of management and has been reviewed and approved by the Board of Directors. This MD&A has been
prepared in accordance with the requirements of the Canadian Securities Administrators. The Board of Directors is
ultimately responsible for reviewing and approving the MD&A. The Board of Directors carries out this responsibility mainly
through its Audit and Risk Management Committee, which is appointed by the Board of Directors and is comprised entirely
of independent and financially literate directors.

Throughout this document, CGI Inc. is referred to as “CGI", “we”, "us", “our” or “Company”. This MD&A provides information
management believes is relevant to an assessment and understanding of the consolidated results of operations and
financial condition of the Company. This document should be read in conjunction with the interim condensed consolidated
financial statements and the notes thereto for the three and nine months ended June 30, 2021 and 2020. CGI’s accounting
policies are in accordance with International Financial Reporting Standards (IFRS) as issued by the International
Accounting Standards Board (IASB). All dollar amounts are in Canadian dollars unless otherwise noted.

MATERIALITY OF DISCLOSURES
This MD&A includes information we believe is material to investors. We consider something to be material if it results in, or
would reasonably be expected to result in, a significant change in the market price or value of our shares, or if it is likely
that a reasonable investor would consider the information to be important in making an investment decision.

FORWARD-LOOKING STATEMENTS
This MD&A contains “forward-looking information” within the meaning of Canadian securities laws and “forward-looking
statements” within the meaning of the United States Private Securities Litigation Reform Act of 1995 and other applicable
United States safe harbours. All such forward-looking information and statements are made and disclosed in reliance upon
the safe harbour provisions of applicable Canadian and United States securities laws. Forward-looking information and
statements include all information and statements regarding CGI’s intentions, plans, expectations, beliefs, objectives, future
performance, and strategy, as well as any other information or statements that relate to future events or circumstances and
which do not directly and exclusively relate to historical facts. Forward-looking information and statements often but not
always use words such as “believe”, “estimate”, “expect”, “intend”, “anticipate”, “foresee”, “plan”, “predict”, “project”, “aim”,
“seek”, “strive”, “potential”, “continue”, “target”, “may”, “might”, “could”, “should”, and similar expressions and variations
thereof. These information and statements are based on our perception of historic trends, current conditions and expected
future developments, as well as other assumptions, both general and specific, that we believe are appropriate in the
circumstances. Such information and statements are, however, by their very nature, subject to inherent risks and
uncertainties, of which many are beyond the control of the Company, and which give rise to the possibility that actual
results could differ materially from our expectations expressed in, or implied by, such forward-looking information or
forward-looking statements. These risks and uncertainties include but are not restricted to: risks related to the market such
as the level of business activity of our clients, which is affected by economic and political conditions, external risks (such as
pandemics) and our ability to negotiate new contracts; risks related to our industry such as competition and our ability to
attract and retain qualified employees, to develop and expand our services, to penetrate new markets, and to protect our
intellectual property rights; risks related to our business such as risks associated with our growth strategy, including the
integration of new operations, financial and operational risks inherent in worldwide operations, foreign exchange risks,
income tax laws, our ability to negotiate favourable contractual terms, to deliver our services and to collect receivables, and
the reputational and financial risks attendant to cybersecurity breaches and other incidents; as well as other risks identified
or incorporated by reference in this MD&A and in other documents that we make public, including our filings with the
Canadian Securities Administrators (on SEDAR at www.sedar.com) and the U.S. Securities and Exchange Commission (on

© CGI Inc.                                                                                                                  Page    1
Management’s Discussion and Analysis     |   For the three and nine months ended June 30, 2021 and 2020

EDGAR at www.sec.gov). For a discussion of risks in response to the coronavirus (COVID-19) pandemic, see Pandemic
risks in section 8.1.1. of the present document. Unless otherwise stated, the forward-looking information and statements
contained in this MD&A are made as of the date hereof and CGI disclaims any intention or obligation to publicly update or
revise any forward-looking information or forward-looking statements, whether as a result of new information, future events
or otherwise, except as required by applicable law. While we believe that our assumptions on which these forward-looking
information and forward-looking statements are based were reasonable as at the date of this MD&A, readers are cautioned
not to place undue reliance on these forward-looking information or statements. Furthermore, readers are reminded that
forward-looking information and statements are presented for the sole purpose of assisting investors and others in
understanding our objectives, strategic priorities and business outlook as well as our anticipated operating environment.
Readers are cautioned that such information may not be appropriate for other purposes. Further information on the risks
that could cause our actual results to differ significantly from our current expectations may be found in section 8 - Risk
Environment, which is incorporated by reference in this cautionary statement. We also caution readers that the risks
described in the previously mentioned section and in other sections of this MD&A are not the only ones that could affect us.
Additional risks and uncertainties not currently known to us or that we currently deem to be immaterial could also have a
material adverse effect on our financial position, financial performance, cash flows, business or reputation.

© CGI Inc.                                                                                                             Page    2
Management’s Discussion and Analysis    |   For the three and nine months ended June 30, 2021 and 2020

NON-GAAP AND KEY PERFORMANCE MEASURES
The reader should note that the Company reports its financial results in accordance with IFRS. However, we use a
combination of financial measures, ratios, and non-GAAP measures to assess the Company’s performance. The non-
GAAP measures used in this MD&A do not have any standardized meaning prescribed by IFRS and are therefore unlikely
to be comparable to similar measures presented by other issuers. These measures should be considered as supplemental
in nature and not as a substitute for the related financial information prepared in accordance with IFRS.

The table below summarizes our non-GAAP measures and most relevant key performance measures:

Profitability      Adjusted EBIT (non-GAAP) – is a measure of earnings excluding acquisition-related and integration
                   costs, restructuring costs, net finance costs and income tax expense. Management believes this
                   measure is useful to investors as it best reflects the performance of the Company's activities and
                   allows for better comparability from period to period as well as to trend analysis. A reconciliation of the
                   adjusted EBIT to its closest IFRS measure can be found in section 3.7. of the present document.
                   Adjusted EBIT margin (non-GAAP) – is obtained by dividing our adjusted EBIT by our revenue.
                   Management believes this measure is useful to investors as it best reflects the performance of its
                   activities and allows for better comparability from period to period as well as to trend analysis. A
                   reconciliation of the adjusted EBIT to its closest IFRS measure can be found in section 3.7. of the
                   present document.
                   Net earnings – is a measure of earnings generated for shareholders.

                   Net earnings margin (non-GAAP) – is obtained by dividing our net earnings by our revenues.
                   Management believes a percentage of revenue measure is meaningful for better comparability from
                   period to period.
                   Diluted earnings per share (diluted EPS) – is a measure of earnings generated for shareholders on
                   a per share basis, assuming all dilutive elements are exercised.
                   Net earnings excluding specific items (non-GAAP) – is a measure of net earnings excluding
                   acquisition-related and integration costs, restructuring costs and tax adjustments. Management
                   believes this measure is useful to investors as it best reflects the Company's performance and allows
                   for better comparability from period to period. A reconciliation of the net earnings excluding specific
                   items to its closest IFRS measure can be found in section 3.8.3. of the present document.

                   Net earnings margin excluding specific items (non-GAAP) – is obtained by dividing our net
                   earnings excluding specific items by our revenues. Management believes this measure is useful to
                   investors as it best reflects the Company's performance and allows for better comparability from
                   period to period. A reconciliation of the net earnings excluding specific items to its closest IFRS
                   measure can be found in section 3.8.3. of the present document.
                   Diluted earnings per share excluding specific items (non-GAAP) – is defined as the net earnings
                   excluding specific items on a per share basis. Management believes that this measure is useful to
                   investors as it best reflects the Company's performance on a per share basis and allows for better
                   comparability from period to period. The diluted earnings per share reported in accordance with IFRS
                   can be found in section 3.8. of the present document while the basic and diluted earnings per share
                   excluding specific items can be found in section 3.8.3. of the present document.

                   Effective tax rate excluding specific items (non-GAAP) - is obtained by dividing income tax
                   expense, excluding tax deductions on acquisition-related and integration costs and restructuring costs
                   and tax adjustments, by earnings before income taxes excluding specific items. Management believes
                   that this measure allows for better comparability from period to period. A reconciliation of the effective
                   tax rate excluding specific items to its closest IFRS measure can be found in section 3.8.3. of the
                   present document.

© CGI Inc.                                                                                                                Page   3
Management’s Discussion and Analysis | For the three and nine months ended June 30, 2021 and 2020
Liquidity Cash provided by operating activities – is a measure of cash generated from managing our day-to-
day business operations. Management believes strong operating cash flow is indicative of financial
flexibility, allowing us to execute the Company's strategy.
Days sales outstanding (DSO) (non-GAAP) – is the average number of days needed to convert our
trade receivables and work in progress into cash. DSO is obtained by subtracting deferred revenue
from trade accounts receivable and work in progress; the result is divided by our most recent quarter’s
revenue over 90 days. Management tracks this metric closely to ensure timely collection and healthy
liquidity. Management believes this measure is useful to investors as it demonstrates the Company's
ability to timely convert its trade receivables and work in progress into cash.
Growth Constant currency growth (non-GAAP) – is a measure of revenue growth before foreign currency
translation impacts. This growth is calculated by translating current period results in local currency
using the conversion rates in the equivalent period from the prior year. Management believes that it is
helpful to adjust revenue to exclude the impact of currency fluctuations to facilitate period-to-period
comparisons of business performance and that this measure is useful to investors for the same
reason.
Backlog (non-GAAP) – includes new contract wins, extensions and renewals (bookings (non-GAAP)),
adjusted for the backlog consumed during the period as a result of client work performed, cancellation
and the impact of foreign currencies to our existing contracts. Backlog incorporates estimates from
management that are subject to change. Management tracks this measure as it is a key indicator of
our best estimate of contracted revenue to be realized in the future and believes that this measure is
useful to investors for the same reason.
Book-to-bill ratio (non-GAAP) – is a measure of the proportion of the value of our bookings to our
revenue in the period. This metric allows management to monitor the Company’s business
development efforts to ensure we grow our backlog and our business over time and management
believes that this measure is useful to investors for the same reason. Management's objective is to
maintain a target ratio greater than 100% over a trailing twelve-month period. Management believes
that monitoring the Company's bookings over a longer period is a more representative measure as the
services and contract type, size and timing of bookings could cause this measurement to fluctuate
significantly if taken for only a three-month period.
Capital Structure Net debt (non-GAAP) – is obtained by subtracting from our debt and lease liabilities, our cash and
cash equivalents, short-term investments, long-term investments and adjusting for fair value of foreign
currency derivative financial instruments related to debt. Management uses the net debt metric to
monitor the Company's financial leverage and believes that this metric is useful to investors as it
provides insight into its financial strength. A reconciliation of net debt to its closest IFRS measure can
be found in section 4.5. of the present document.
Net debt to capitalization ratio (non-GAAP) – is a measure of our level of financial leverage and is
obtained by dividing the net debt by the sum of shareholder's equity and net debt. Management uses
the net debt to capitalization ratio to monitor the proportion of debt versus capital used to finance the
Company's operations and to assess its financial strength. Management believes that this metric is
useful to investors for the same reasons.
Return on equity (ROE) (non-GAAP) – is a measure of the rate of return on the ownership interest of
our shareholders and is calculated as the proportion of net earnings for the last 12 months over the
last four quarters' average shareholder's equity. Management looks at ROE to measure its efficiency
at generating net earnings for the Company’s shareholders and how well the Company uses the
invested funds to generate net earnings growth and believes that this measure is useful to investors
for the same reasons.
© CGI Inc. Page 4Management’s Discussion and Analysis | For the three and nine months ended June 30, 2021 and 2020
Return on invested capital (ROIC) (non-GAAP) – is a measure of the Company’s efficiency at
allocating the capital under its control to profitable investments and is calculated as the proportion of
the net earnings excluding net finance costs after-tax for the last 12 months, over the last four
quarters' average invested capital, which is defined as the sum of shareholder's' equity and net debt.
Management examines this ratio to assess how well it is using its funds to generate returns and
believes that this measure is useful to investors for the same reason.
REPORTING SEGMENTS
The Company is managed through nine operating segments, namely: Western and Southern Europe (primarily France and
Portugal); United States (U.S.) Commercial and State Government; Canada; U.S. Federal; United Kingdom (U.K.) and
Australia; Central and Eastern Europe (primarily Germany and the Netherlands); Scandinavia; Finland, Poland and Baltics;
and Asia Pacific Global Delivery Centers of Excellence (mainly India and Philippines) (Asia Pacific). Please refer to
sections 3.4. and 3.6. of the present document and to note 8 of our interim condensed consolidated financial statements for
additional information on our segments.
© CGI Inc. Page 5Management’s Discussion and Analysis | For the three and nine months ended June 30, 2021 and 2020
MD&A OBJECTIVES AND CONTENTS
In this document, we:
• Provide a narrative explanation of the interim condensed consolidated financial statements through the eyes of
management;
• Provide the context within which the interim condensed consolidated financial statements should be analyzed,
by giving enhanced disclosure about the dynamics and trends of the Company’s business; and
• Provide information to assist the reader in ascertaining the likelihood that past performance may be indicative of
future performance.
In order to achieve these objectives, this MD&A is presented in the following main sections:
Section Contents Pages
1. Corporate 1.1. About CGI 8
Overview 1.2. Vision and Strategy 9
1.3. Competitive Environment 9
2. Quarterly 2.1. Selected Quarterly Information & Key Performance Measures 10
Overview 2.2. Stock Performance 11
2.3. COVID-19 12
2.4. Investments in Subsidiaries 13
3. Financial Review 3.1. Bookings and Book-to-Bill Ratio 14
3.2. Foreign Exchange 15
3.3. Revenue Distribution 16
3.4. Revenue by Segment 17
3.5. Operating Expenses 21
3.6. Adjusted EBIT by Segment 22
3.7. Earnings Before Income Taxes 25
3.8. Net Earnings and Earnings Per Share 26
4. Liquidity 4.1. Interim condensed consolidated Statements of Cash Flows 28
4.2. Capital Resources 31
4.3. Contractual Obligations 31
4.4. Financial Instruments and Hedging Transactions 31
4.5. Selected Measures of Capital Resources and Liquidity 32
4.6. Guarantees 33
4.7. Capability to Deliver Results 33
© CGI Inc. Page 6Management’s Discussion and Analysis | For the three and nine months ended June 30, 2021 and 2020
Section Contents Pages
5. Changes in
Accounting A summary of the accounting standard changes. 34
Policies
6. Critical
A discussion of the critical accounting estimates made in the preparation of the
Accounting 35
interim condensed consolidated financial statements.
Estimates
A discussion of the existence of appropriate information systems, procedures
7. Integrity of
and controls to ensure that information used internally and disclosed externally 38
Disclosure
is complete and reliable.
8. Risk Environment 8.1. Risks and Uncertainties 40
8.2. Legal Proceedings 50
© CGI Inc. Page 7Management’s Discussion and Analysis | For the three and nine months ended June 30, 2021 and 2020
1. Corporate Overview
1.1. ABOUT CGI
Founded in 1976 and headquartered in Montréal, Canada, CGI is among the largest information technology (IT) and
business consulting services firms in the world. The Company delivers a full range of services, including strategic IT and
business consulting and systems integration, managed IT and business process services, and intellectual property to help
clients accelerate digitization, achieve immediate cost savings, and drive revenue growth. CGI employs approximately
78,000 consultants and professionals worldwide, whom are called members as they are also owners through our Share
Purchase Plan.
End-to-end services and solutions
CGI delivers end-to-end services that cover the full spectrum of technology delivery; from digital strategy and architecture
to solution design, development, integration, implementation, and operations. Our portfolio encompasses:
i. Strategic IT and business consulting and systems integration: CGI helps clients define their digital strategy
and roadmap, and advance their IT modernization initiatives through an agile, iterative approach that facilitates
innovation, connection and optimization of mission-critical systems to deliver enterprise-wide changes.
ii. Managed IT and business process services: Our clients entrust us with full or partial responsibility for their IT
and business functions to help them become more agile and to build resilience into their technology supply
chains. In return, we deliver innovation, significant efficiency gains, and cost savings. Typical services in an end-
to-end engagement include: application development, integration and maintenance; technology infrastructure
management; and business process services, such as collections and payroll management. Managed IT and
business process services contracts are long-term in nature, with a typical duration greater than five years,
allowing our clients to reinvest savings, alongside CGI, in their digital transformation.
iii. Intellectual property (IP): Designed in collaboration with clients, our IP solutions act as business accelerators
for the industries we serve. These include business solutions, some of which are cross industry, encompassing
commercial software embedded within our end-to-end-services, and digital enablers such as methodologies and
frameworks to drive change across business and IT processes.
Deep industry expertise
CGI has long-standing and focused practices in all of its core industries, providing clients with a partner that is not only an
expert in IT, but also expert in their industries. This combination of business knowledge and digital technology expertise
allows us to help our clients navigate complex challenges and focus on how to create value. In the process, we evolve the
services and solutions we deliver within our targeted industries.
Our targeted industries include communications and media, banking, insurance, government, health & life sciences,
manufacturing, retail & consumer, transportation and logistics, energy and utilities and space. While these represent our
go-to-market industry targets, we group these industries into the following for reporting purposes: government;
manufacturing, retail & distribution (MRD); financial services; communications & utilities; and health.
As the move toward digitization continues across industries, CGI partners with clients to help guide them in becoming
customer and citizen-centric digital organizations.
Applied innovation
At CGI, innovation happens across many interconnected fronts. It starts in our everyday work on client projects, where
thousands of innovations are applied daily. Through benchmark in-person interviews we conduct each year, business and
technology executives share their priorities with us, informing our own innovation investments and driving our client
proximity teams' focus on local client priorities.
© CGI Inc. Page 8Management’s Discussion and Analysis | For the three and nine months ended June 30, 2021 and 2020 Since 1976, CGI has been a trusted partner in delivering innovative, client-inspired business services and solutions. We help develop, innovate and protect the technology that enables clients to achieve their digital transformation goals faster, with reduced risk and enduring results. We partner with clients to enable their business agility through a range of business and digital initiatives focused on human capital and culture practices, process automation, and data analytics. Technology is a key element of the value chains of organizations today. We help clients adopt and harmonize a number of technologies and services, such as cloud, automation, and managed services - to build agility, elasticity, security and resiliency into their technology supply chains. Digital engagement with customers and stakeholders has taken on new importance. We help clients evaluate their work culture, organizational models, and performance management, as well as adopt modern collaboration and resilient business continuity plans. Technology will continue to be at the heart of the future value chains that serve our clients’ consumers and stakeholders. Quality processes CGI's clients expect consistency of service wherever and whenever they engage us. We have an outstanding track record of on-time, within-budget delivery as a result of our commitment to excellence and our robust governance model - CGI's Management Foundation. CGI's Management Foundation provides a common business language, frameworks and practices for managing operations consistently across the globe, driving a focus on continuous improvement. We also invest in rigorous quality and service delivery standards (including ISO and Capability Maturity Model Integration (CMMI) certification programs), as well as a comprehensive Client Satisfaction Assessment Program, with signed client assessments, to ensure high satisfaction on an ongoing basis. 1.2. VISION AND STRATEGY Our strategy has always been based on long-term fundamentals. For further details, please refer to section 1.2 of CGI's MD&A for the years ended September 30, 2020 and 2019, which is available on CGI's website at www.cgi.com and which was filed with Canadian securities regulators on SEDAR at www.sedar.com and the U.S. Securities and Exchange Commission on EDGAR at www.sec.gov. 1.3. COMPETITIVE ENVIRONMENT There have been no significant changes to our competitive environment since the end of Fiscal 2020. For further details, please refer to section 1.3 of CGI's MD&A for the years ended September 30, 2020 and 2019 which is available on CGI's website at www.cgi.com and which was filed with Canadian securities regulators on SEDAR at www.sedar.com and the U.S. Securities and Exchange Commission on EDGAR at www.sec.gov. © CGI Inc. Page 9
Management’s Discussion and Analysis                |   For the three and nine months ended June 30, 2021 and 2020

2.         Quarterly Overview
2.1. SELECTED QUARTERLY INFORMATION & KEY PERFORMANCE MEASURES1
                                                          Jun. 30,   Mar. 31,     Dec. 31,    Sep. 30,     Jun. 30,    Mar. 31,     Dec. 31,     Sep. 30,
As at and for the three months ended                       2021       2021         2020        2020         2020        2020         2019         2019
In millions of CAD unless otherwise noted
Growth
Revenue                                                   3,021.4     3,078.5      3,019.4     2,925.6      3,052.7     3,131.1      3,054.7     2,959.2
Year-over-year revenue growth                              (1.0%)      (1.7%)      (1.2%)       (1.1%)      (2.2%)        2.0%        3.1%         5.7%
Constant currency year-over-year revenue                   3.5%        (1.7%)      (3.6%)       (4.5%)      (3.5%)        3.0%        4.8%         7.7%
growth
Backlog                                                   23,345       23,094      22,769       22,673      22,295       22,994      22,292       22,611
Bookings                                                   3,634       3,892       3,397        3,474        2,841       2,783        2,749        3,409
Book-to-bill ratio                                        120.3%      126.4%       112.5%      118.8%       93.1%        88.9%        90.0%      115.2%
Book-to-bill ratio trailing twelve months                 119.5%      112.6%       103.0%       97.4%       96.6%        97.0%       101.3%      104.4%
               1
Profitability
Adjusted EBIT2                                             476.8       486.3        495.7       457.6        448.0       483.2        474.1        457.5
  Adjusted EBIT margin                                     15.8%       15.8%       16.4%        15.6%       14.7%        15.4%        15.5%       15.5%
Net earnings                                               338.5       341.2        343.5       251.9        260.9       314.8        290.2        324.1
  Net earnings margin                                      11.2%       11.1%       11.4%         8.6%        8.5%        10.1%        9.5%        11.0%
Diluted EPS (in dollars)                                    1.36        1.34         1.32        0.96         1.00        1.18         1.06        1.19
Net earnings excluding specific items2                     339.0       341.9        347.2       318.4        308.4       338.4        334.9        329.5
  Net earnings margin excluding specific items             11.2%       11.1%       11.5%        10.9%       10.1%        10.8%        11.0%       11.1%
Diluted EPS excluding specific items (in dollars)2          1.36        1.35         1.33        1.22         1.18        1.26         1.23        1.21
           1
Liquidity
Cash provided by operating activities                      418.9       572.6        597.5       492.0        584.8       396.5        465.3        405.2
  As a % of revenue                                        13.9%       18.6%       19.8%        16.8%       19.2%        12.7%        15.2%       13.7%
Days sales outstanding                                       44          39           44          47           48          51           49          50
                       1
Capital structure
Net debt                                                  2,956.6     2,938.7      2,672.5     2,777.9      3,243.5     3,792.3      2,810.6     2,117.2
Net debt to capitalization ratio                           30.9%       30.9%       27.1%         27.7 %       31.8 %      35.9 %       28.4 %      23.5 %
Return on equity                                           18.4%       17.2%       16.6%         16.0 %       17.3 %      18.0 %       18.0 %      18.5 %
Return on invested capital                                 13.8%       12.8%       12.4%         12.1 %       13.0 %      13.9 %       14.4 %      15.1 %
                   1
Balance sheet
Cash and cash equivalents, and short-term                 1,267.1     1,339.8      1,675.1     1,709.5      1,371.1      314.0        223.2        223.7
investments
Total assets                                              14,599.3 14,719.9 15,271.0 15,550.4 15,343.3 14,597.2 13,863.6 12,621.7
                               3
Long-term financial liabilities                           3,453.0     3,508.1      3,598.1     4,030.6      4,363.5     3,889.1      2,766.3     2,236.0

  1
      As of and including the period ending December 31, 2019, figures include the impact of the adoption of IFRS 16, while previous quarters are not restated.
  2
      Please refer to sections 3.7. and 3.8.3. of each quarter's respective MD&A for the reconciliation of non-GAAP financial measures for the quarterly periods
      of 2019 and 2020. For Fiscal 2019 and 2020 year ending periods, please refer to sections 5.6. and 5.6.1. of each fiscal year's MD&A.
  3
      Long-term financial liabilities include the long-term portion of the debt, long-term lease liabilities and the long-term derivative financial instruments.

 © CGI Inc.                                                                                                                                                 Page   10
Management’s Discussion and Analysis | For the three and nine months ended June 30, 2021 and 2020
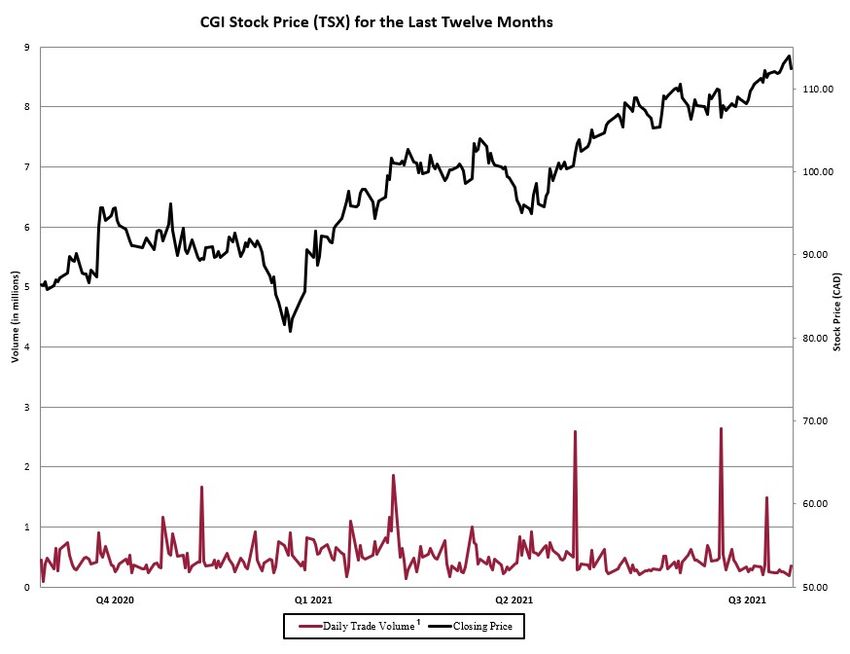
2.2. STOCK PERFORMANCE
2.2.1. Q3 F2021 Trading Summary
CGI’s shares are listed on the Toronto Stock Exchange (TSX) (stock quote – GIB.A) and the New York Stock Exchange
(NYSE) (stock quote – GIB) and are included in key indices such as the S&P/TSX 60 Index.
TSX (CAD) NYSE (USD)
Open: 105.49 Open: 83.92
High: 114.11 High: 92.10
Low: 104.63 Low: 83.29
Close: 112.39 Close: 90.60
1
CDN average daily trading volumes : 654,832 NYSE average daily trading volumes: 138,105
1
Includes the average daily volumes of both the TSX and alternative trading systems.
© CGI Inc. Page 11Management’s Discussion and Analysis | For the three and nine months ended June 30, 2021 and 2020 2.2.2. Normal Course Issuer Bid (NCIB) On January 26, 2021, the Company’s Board of Directors authorized and subsequently received regulatory approval from the TSX for the renewal of CGI's NCIB which allows for the purchase for cancellation of up to 19,184,831 Class A subordinate voting shares (Class A Shares) representing 10% of the Company’s public float as of the close of business on January 22, 2021. Class A Shares may be purchased for cancellation under the NCIB commencing on February 6, 2021 until no later than February 5, 2022, or on such earlier date when the Company has either acquired the maximum number of Class A Shares allowable under the NCIB or elects to terminate the bid. During the three months ended June 30, 2021, the Company purchased for cancellation 2,949,800 Class A Shares for $319.7 million at a weighted average price of $108.38. During the nine months ended June 30, 2021, the Company purchased for cancellation 15,310,465 Class A Shares for $1,502.8 million at a weighted average price of $98.16 under the previous and current NCIB. The purchased shares included 4,204,865 Class A Shares purchased for cancellation from Caisse de dépôt et de placement du Québec for cash consideration of $400.0 million. The purchase was made pursuant to an exemption order issued by the Autorité des marchés financiers and is considered within the annual aggregate limit that the Company is entitled to purchase under its current NCIB. As at June 30, 2021, the Company could purchase up to 10,127,266 Class A Shares for cancellation under the current NCIB. 2.2.3. Capital Stock and Options Outstanding The following table provides a summary of the Capital Stock and Options Outstanding as at July 23, 2021: Capital Stock and Options Outstanding As at July 23, 2021 Class A subordinate voting shares 218,996,492 Class B multiple voting shares 26,445,706 Options to purchase Class A subordinate voting shares 8,209,560 2.3. COVID-19 While we are unable to predict the extent to which the COVID-19 pandemic may adversely impact our operations and financial performance in future quarters, our executive crisis management team and our network of local crisis management teams continue to closely monitor the evolving COVID-19 pandemic, executing on our business continuity plan and working collaboratively with our clients. We have established key guidelines and procedures related to security and access controls, member health screening, member isolation and quarantine, and facility infrastructure, maintenance and cleaning, to ensure that our workplace practices are in line with local government recommendations and requirements, as well as compliant with the appropriate standards of safety, health, wellness and required workplace readiness certifications. We continue to monitor key suppliers to prevent service disruptions or significant impacts in the delivery of services or goods from our suppliers. To address issues associated with a significant number of our members working remotely, we bolstered perimeter defense with advanced cyber threat monitoring, data encryption, remote access technologies and timely system patching. Additionally, we are providing training and education so that members understand our “Securely working from home guidance”, and are taking precautionary measures to protect CGI and our client’s assets. During the first two quarters of Fiscal 2021, our revenues declined across our segments when compared to the prior year periods. We experienced reduced demand for our services during the COVID-19 pandemic due to the slowdown of activities in some of our markets, particularly in the MRD vertical market. © CGI Inc. Page 12
Management’s Discussion and Analysis      |   For the three and nine months ended June 30, 2021 and 2020

To mitigate the impacts of COVID-19 on our business, we have proactively implemented various cost reduction efforts to
adjust our costs based on our revenue level, such as implementing our restructuring plan and reducing travel related
expenses following government restrictions. Please refer to sections 3.4., 3.5.1., 3.6. and 3.7.2. for additional information.

The Company maintains a strong balance sheet and liquidity position (refer to section 4.2. of the present document for
further detail).

Our highest priority remains the health and safety of our members and providing service continuity for our clients. CGI’s
proximity-based business model and robust internal infrastructure limited the impact of confinement measures imposed in
several countries and allowed the majority of our members to work remotely, ensuring service continuity to our clients.

2.4. INVESTMENT IN SUBSIDIARIES
On December 31, 2020, the Company acquired the assets of Harris, Mackessy & Brennan, Inc.’s (HMB) Professional
Services Division, a division focused on high-end technology consulting and services for commercial and government
clients, headquartered in Columbus, Ohio. The acquisition added approximately 165 professionals to the Company.

On May 3, 2021, the Company acquired Sense Corp, a professional services firm focused on digital systems integration
and consulting for state and local government and commercial clients, headquartered in St. Louis, Missouri. The acquisition
added approximately 300 professionals to the Company.

The Company completed these acquisitions for a total purchase price of approximately $109.3 million.

© CGI Inc.                                                                                                               Page    13
Management’s Discussion and Analysis                 |   For the three and nine months ended June 30, 2021 and 2020

3.          Financial Review
3.1. BOOKINGS AND BOOK-TO-BILL RATIO
Bookings for the three months ended June 30, 2021 were $3.6 billion representing a book-to-bill ratio of 120.3%. The
breakdown of the new bookings signed during the quarter is as follows:

           Contract Type                          Service Type                            Segment                          Vertical Market

 A.     Extensions, renewals   69%    A.      Managed IT and           63 %    A.   Canada                  22%   A.    Government             34%
        and add-ons                           Business Process
                                              Services
 B.     New business           31%    B.      System integration and   37 %    B.   U.S. Commercial and     17%   B.    Financial services     25%
                                              consulting                            State Government
                                                                               C.   Western and Southern    16%   C.    MRD                    22%
                                                                                    Europe
                                                                               D.   U.S Federal             13%   D.    Communications &       13%
                                                                                                                        utilities
                                                                               E.   U.K. and Australia      12%   E.    Health                 6%
                                                                               F.   Central and Eastern     10%
                                                                                    Europe
                                                                               G    Scandinavia              5%
                                                                               H.   Finland, Poland and      5%
                                                                                    Baltics

Information regarding our bookings is a key indicator of the volume of our business over time. However, due to the timing
and transition period associated with managed IT and business process services contracts, the realization of revenue
related to these bookings may fluctuate from period to period. The values initially booked may change over time due to
their variable attributes, including demand-driven usage, modifications in the scope of work to be performed caused by
changes in client requirements as well as termination clauses at the option of the client. As such, information regarding our
bookings is not comparable to, nor should it be substituted for, an analysis of our revenue. Management however believes
that it is a key indicator of potential future revenue.

The following table provides a summary of the bookings and book-to-bill ratio by segment:

                                                           Bookings for the three         Bookings for the trailing        Book-to-bill ratio for the
 In thousands of CAD except for percentages                       months ended              twelve months ended             trailing twelve months
                                                                  June 30, 2021                     June 30, 2021             ended June 30, 2021
      Total CGI                                                          3,633,536                         14,396,326                        119.5 %
      Western and Southern Europe                                             593,473                       2,315,925                        120.6 %
      U.S. Commercial and State Government                                    618,996                       2,146,028                        116.3 %
      Canada                                                                  815,293                       2,379,464                        127.6 %
      U.S. Federal                                                            453,168                       1,880,527                        114.2 %
      U.K. and Australia                                                      452,512                       1,888,040                        121.1 %
      Central and Eastern Europe                                              351,309                       1,669,648                        126.1 %
      Scandinavia                                                             176,703                       1,064,934                         97.9 %
      Finland, Poland and Baltics                                             172,082                       1,051,759                        132.3 %

© CGI Inc.                                                                                                                                       Page   14
Management’s Discussion and Analysis | For the three and nine months ended June 30, 2021 and 2020
3.2. FOREIGN EXCHANGE
The Company operates globally and is exposed to changes in foreign currency rates. Accordingly, as prescribed by IFRS,
we value assets, liabilities and transactions that are measured in foreign currencies using various exchange rates. We
report all dollar amounts in Canadian dollars.
Closing foreign exchange rates
As at June 30, 2021 2020 Change
U.S. dollar 1.2405 1.3616 (8.9%)
Euro 1.4700 1.5306 (4.0%)
Indian rupee 0.0167 0.0180 (7.2%)
British pound 1.7129 1.6846 1.7%
Swedish krona 0.1449 0.1463 (1.0%)
Average foreign exchange rates
For the three months ended June 30, For the nine months ended June 30,
For the three months ended June 30, 2021 2020 Change 2021 2020 Change
U.S. dollar 1.2278 1.3853 (11.4%) 1.2658 1.3502 (6.3%)
Euro 1.4806 1.5261 (3.0%) 1.5200 1.4900 2.0%
Indian rupee 0.0166 0.0183 (9.3%) 0.0172 0.0185 (7.0%)
British pound 1.7170 1.7197 (0.2%) 1.7282 1.7130 0.9%
Swedish krona 0.1460 0.1433 1.9% 0.1494 0.1398 6.9%
© CGI Inc. Page 15Management’s Discussion and Analysis | For the three and nine months ended June 30, 2021 and 2020
3.3. REVENUE DISTRIBUTION
The following charts provide additional information regarding our revenue mix for the quarter:
Service Type Client Geography Vertical Market
A. Managed IT and Business Process Services 55 % A. U.S. 29 % A. Government 34 %
B. System integration and consulting 45 % B. Canada 16 % B. MRD 24 %
C. France 15 % C. Financial services 22 %
D. U.K. 12 % D. Communications & utilities 14 %
E. Sweden 7 % E. Health 6 %
F. Germany 6 %
G. Finland 6 %
H. Rest of the world 9 %
3.3.1. Client Concentration
IFRS guidance on segment disclosures defines a single customer as a group of entities that are known to the reporting
entity to be under common control. As a consequence, our work for the U.S. federal government including its various
agencies represented 12.5% of our revenue for the three months ended June 30, 2021 as compared to 14.1% for the three
months ended June 30, 2020.
For both the nine months ended June 30, 2021 and 2020, we generated 12.7% and 13.3%, respectively, of our revenue
from the U.S federal government including its various agencies.
© CGI Inc. Page 16Management’s Discussion and Analysis | For the three and nine months ended June 30, 2021 and 2020
3.4. REVENUE BY SEGMENT
Our segments are reported based on where the client's work is delivered from within our geographic delivery model.
The table below provides a summary of the year-over-year changes in our revenue, in total and by segment before
eliminations, separately showing the impacts of foreign currency exchange rate variations between Q3 2021 and Q3 2020.
The three and nine months ended June 30, 2021 revenue by segment was recorded reflecting the actual foreign exchange
rates for that period. The foreign exchange impact is the difference between the current period’s actual results and the
same period’s results converted with the prior year’s foreign exchange rates.
For the three months ended June 30, For the nine months ended June 30,
In thousands of CAD except for percentages
2021 2020 % 2021 2020 %
Total CGI revenue 3,021,354 3,052,667 (1.0 %) 9,119,335 9,238,555 (1.3%)
Variation prior to foreign currency impact 3.5% (0.6%)
Foreign currency impact (4.5%) (0.7%)
Variation over previous period (1.0%) (1.3%)
Western and Southern Europe
Revenue prior to foreign currency impact 514,993 456,408 12.8% 1,466,750 1,478,413 (0.8%)
Foreign currency impact (14,782) 27,369
Western and Southern Europe revenue 500,211 456,408 9.6% 1,494,119 1,478,413 1.1%
U.S. Commercial and State Government
Revenue prior to foreign currency impact 503,818 486,013 3.7% 1,402,446 1,402,096 —%
Foreign currency impact (56,068) (87,447)
U.S. Commercial and State Government 447,750 486,013 (7.9%) 1,314,999 1,402,096 (6.2%)
revenue
Canada
Revenue prior to foreign currency impact 443,653 418,083 6.1% 1,316,669 1,289,514 2.1%
Foreign currency impact 12 516
Canada revenue 443,665 418,083 6.1% 1,317,185 1,289,514 2.1%
U.S. Federal
Revenue prior to foreign currency impact 439,012 442,039 (0.7%) 1,279,855 1,280,868 (0.1%)
Foreign currency impact (49,910) (80,128)
U.S. Federal revenue 389,102 442,039 (12.0%) 1,199,727 1,280,868 (6.3%)
U.K. and Australia
Revenue prior to foreign currency impact 329,838 340,723 (3.2%) 991,927 1,010,996 (1.9%)
Foreign currency impact (108) 10,671
U.K. and Australia revenue 329,730 340,723 (3.2%) 1,002,598 1,010,996 (0.8%)
Central and Eastern Europe
Revenue prior to foreign currency impact 334,115 298,030 12.1% 962,214 905,356 6.3%
Foreign currency impact (8,597) 18,630
Central and Eastern Europe revenue 325,518 298,030 9.2% 980,844 905,356 8.3%
Scandinavia
Revenue prior to foreign currency impact 254,074 272,450 (6.7%) 762,452 869,931 (12.4%)
Foreign currency impact 5,535 45,503
Scandinavia revenue 259,609 272,450 (4.7%) 807,955 869,931 (7.1%)
© CGI Inc. Page 17Management’s Discussion and Analysis | For the three and nine months ended June 30, 2021 and 2020
For the three months ended June 30, For the nine months ended March 31,
In thousands of CAD except for percentages
2021 2020 % 2021 2020 %
Finland, Poland and Baltics
Revenue prior to foreign currency impact 194,006 198,221 (2.1%) 582,631 598,740 (2.7%)
Foreign currency impact (5,697) 11,892
Finland, Poland & Baltics revenue 188,309 198,221 (5.0%) 594,523 598,740 (0.7%)
Asia Pacific
Revenue prior to foreign currency impact 185,250 173,730 6.6% 530,359 503,361 5.4%
Foreign currency impact (15,127) (31,812)
Asia Pacific revenue 170,123 173,730 (2.1%) 498,547 503,361 (1.0%)
Eliminations (32,663) (33,030) (1.1%) (91,162) (100,720) (9.5%)
For the three months ended June 30, 2021, revenue was $3,021.4 million, a decrease of $31.3 million, or 1.0% over the
same period last year. On a constant currency basis, revenue increased by $107.0 million or 3.5%. The increase was
mainly due to growth within the Western and Southern Europe and Central and Eastern Europe segments, predominantly
within the MRD vertical market, as it recovers from last year's COVID-19 impact, as well as recent business acquisitions.
For the nine months ended June 30, 2021, revenue was $9,119.3 million, a decrease of $119.2 million, or 1.3% over the
same period last year. On a constant currency basis, revenue decreased by $54.6 million or 0.6%. The decrease was
mainly due to the slowdown of activities, primarily in the MRD vertical market, mostly as a result of COVID-19, and an
adjustment due to a reevaluation of cost to complete on a project. This was in part offset by growth within the government
vertical market and recent business acquisitions.
3.4.1. Western and Southern Europe
For the three months ended June 30, 2021, revenue in our Western and Southern Europe segment was $500.2 million, an
increase of $43.8 million or 9.6% over the same period last year. On a constant currency basis, revenue increased by
$58.6 million or 12.8%. The increase in revenue was mainly the result of growth across most vertical markets,
predominantly in MRD, and the impact of two additional billable days.
For the nine months ended June 30, 2021, revenue in our Western and Southern Europe segment was $1,494.1 million, an
increase of $15.7 million or 1.1% over the same period last year. On a constant currency basis, revenue decreased by
$11.7 million or 0.8%. The change in revenue was due to the slowdown of activities mainly within the MRD and
communications & utilities vertical markets, primarily as a result of COVID-19. This was partially offset by the prior year's
acquisition as well as growth within the government and financial services vertical markets.
On a client geographic basis, the top two Western and Southern Europe vertical markets were MRD and financial services,
generating combined revenues of approximately $308 million and $909 million for the three and nine months ended June
30, 2021, respectively.
3.4.2. U.S. Commercial and State Government
For the three months ended June 30, 2021, revenue in our U.S. Commercial and State Government segment was $447.8
million, a decrease of $38.3 million or 7.9% over the same period last year. On a constant currency basis, revenue
increased by $17.8 million or 3.7%. The increase was mainly due to recent acquisitions, as well as growth within the
communications and utilities vertical market. This was in part offset by lower IP related revenue in the state and local
government market.
For the nine months ended June 30, 2021, revenue in our U.S. Commercial and State Government segment was $1,315.0
million, a decrease of $87.1 million or 6.2% over the same period last year. On a constant currency basis, revenue
© CGI Inc. Page 18Management’s Discussion and Analysis | For the three and nine months ended June 30, 2021 and 2020 remained stable when compared to the same period last year. Revenues increased due to recent acquisitions, as well as higher work volumes within the financial services vertical market. This was offset by the state and local government market, primarily from an adjustment due to a reevaluation of cost to complete on a project taken in Q2 2021. On a client geographic basis, the top two U.S. Commercial and State Government vertical markets were financial services and government, generating combined revenues of approximately $275 million and $825 million for the three and nine months ended June 30, 2021, respectively. 3.4.3. Canada For the three months ended June 30, 2021, revenue in our Canada segment was $443.7 million, an increase of $25.6 million or 6.1% compared to the same period last year, and the same on a constant currency basis. The increase was mainly due to growth within the financial services and communications & utilities vertical markets. This was in part offset by a higher proportion of client projects delivered by our global delivery centers of excellence in Asia-Pacific (see section 3.4.9. of the present document). For the nine months ended June 30, 2021, revenue in our Canada segment was $1,317.2 million, an increase of $27.7 million or 2.1% compared to the same period last year. On a constant currency basis, revenue increased by $27.2 million or 2.1%. The increase was mainly due to the same factors identified for the quarter. On a client geographic basis, the top two Canada vertical markets were financial services and communications & utilities, generating combined revenues of approximately $298 million and $899 million for the three and nine months ended June 30, 2021, respectively. 3.4.4. U.S. Federal For the three months ended June 30, 2021, revenue in our U.S. Federal segment was $389.1 million, a decrease of $52.9 million or 12.0% over the same period last year. On a constant currency basis, revenue decreased by $3.0 million or 0.7%. The change was mainly driven by lower work volumes related to our application support services. For the nine months ended June 30, 2021, revenue in our U.S. Federal segment was $1,199.7 million, a decrease of $81.1 million or 6.3% over the same period last year. On a constant currency basis, revenue decreased by $1.0 million or 0.1%. The change was driven by lower transaction volumes related to our IP business process services, mainly due to the impact of the COVID-19, and a decrease in project related equipment sales. This was partially offset by the prior year's acquisition and higher work volume in application support and cybersecurity services. For the three and nine months ended June 30, 2021, 90% and 87% of revenues within the U.S. Federal segment were federal civilian based, respectively. 3.4.5. U.K. and Australia For the three months ended June 30, 2021, revenue in our U.K. and Australia segment was $329.7 million, a decrease of $11.0 million or 3.2% over the same period last year. On a constant currency basis, revenue decreased by $10.9 million or 3.2%. The change was mainly due to a provision taken on a client contract and completion of projects within the communications & utilities vertical market. This was partly offset by new business within the MRD vertical market. For the nine months ended June 30, 2021, revenue in our U.K. and Australia segment was $1,002.6 million, a decrease of $8.4 million or 0.8% over the same period last year. On a constant currency basis, revenue decreased by $19.1 million or 1.9%. The change was mainly due to the same factors identified for the quarter. On a client geographic basis, the top two U.K. and Australia vertical markets were government and communications & utilities, generating combined revenues of approximately $264 million and $807 million for the three and nine months ended June 30, 2021, respectively. © CGI Inc. Page 19
Management’s Discussion and Analysis      |   For the three and nine months ended June 30, 2021 and 2020

 3.4.6. Central and Eastern Europe
For the three months ended June 30, 2021, revenue in our Central and Eastern Europe segment was $325.5 million, an
increase of $27.5 million or 9.2% over the same period last year. On a constant currency basis, revenue increased by
$36.1 million or 12.1%. The increase in revenue was primarily due to higher work volume and new managed IT service
revenue within the government, MRD and financial services vertical markets.

For the nine months ended June 30, 2021, revenue in our Central and Eastern Europe segment was $980.8 million, an
increase of $75.5 million or 8.3% over the same period last year. On a constant currency basis, revenue increased by
$56.9 million or 6.3%. The increase in revenue was mainly due to the same factors identified for the quarter, as well as the
prior year's acquisition and additional IP license sales. This was partially offset by the impact of COVID-19, mainly affecting
the MRD vertical market.

On a client geographic basis, the top two Central and Eastern Europe vertical markets were MRD and government,
generating combined revenues of approximately $210 million and $632 million for the three and nine months ended June
30, 2021, respectively.

 3.4.7. Scandinavia
For the three months ended June 30, 2021, revenue in our Scandinavia segment was $259.6 million, a decrease of $12.8
million or 4.7% over the same period last year. On a constant currency basis, revenue decreased by $18.4 million or 6.7%.
The decrease was mainly driven by lower work volume within the government vertical market, as well as projects
completed and a slowdown of activities related to the delayed recovery from COVID-19, both primarily within the MRD
vertical market. Additionally, the sale of a non-profitable business related to a past acquisition contributed to the reduction
of revenue.

For the nine months ended June 30, 2021, revenue in our Scandinavia segment was $808.0 million, a decrease of $62.0
million or 7.1% over the same period last year. On a constant currency basis, revenue decreased by $107.5 million or
12.4%. The decrease was mainly due to the same factors identified for the quarter.

On a client geographic basis, the top two Scandinavia vertical markets were MRD and government, generating combined
revenues of approximately $186 million and $576 million for the three and nine months ended June 30, 2021, respectively.

 3.4.8. Finland, Poland and Baltics
For the three months ended June 30, 2021, revenue in our Finland, Poland and Baltics segment was $188.3 million, a
decrease of $9.9 million or 5.0% over the same period last year. On a constant currency basis, revenue decreased by $4.2
million or 2.1% due to lower work volume within the government vertical market and a prior year third-party software sale
related to a managed services contract ramp up.

For the nine months ended June 30, 2021, revenue in our Finland, Poland and Baltics segment was $594.5 million, a
decrease of $4.2 million or 0.7% over the same period last year. On a constant currency basis, revenue decreased by
$16.1 million or 2.7% due to lower work volumes in both government and MRD vertical markets, in part impacted by
COVID-19.

On a client geographic basis, the top two Finland, Poland and Baltics vertical markets were financial services and
government, generating combined revenues of approximately $118 million and $373 million for the three and nine months
ended June 30, 2021, respectively.

© CGI Inc.                                                                                                                Page    20
Management’s Discussion and Analysis      |   For the three and nine months ended June 30, 2021 and 2020

3.4.9. Asia Pacific
For the three months ended June 30, 2021, revenue in our Asia Pacific segment was $170.1 million, a decrease of $3.6
million or 2.1% over the same period last year. On a constant currency basis, revenue increased by $11.5 million or 6.6%.
The increase was mainly driven by the continued demand for our offshore delivery centers, predominantly within the
financial services and communications & utilities vertical markets, primarily from our North-American operations.

For the nine months ended June 30, 2021, revenue in our Asia Pacific segment was $498.5 million, a decrease of $4.8
million or 1.0% over the same period last year. On a constant currency basis, revenue increased by $27.0 million or 5.4%.
The increase in revenue was mainly due to the same factors identified for the quarter.

3.5. OPERATING EXPENSES
                                     For the three months ended June 30,             For the nine months ended June 30,
 In thousands of CAD except for
 percentages                                      % of                    % of                    % of                  % of
                                      2021     Revenue        2020     Revenue        2021     Revenue       2020    Revenue
 Costs of services, selling and   2,542,669      84.2%    2,606,135      85.4%    7,662,886      84.0%   7,831,509     84.8%
 administrative
 Foreign exchange loss (gain)        1,916        0.1 %      (1,499)     (0.0%)      (2,372)      0.0%      1,663         0.0%

 3.5.1. Costs of Services, Selling and Administrative
For the three months ended June 30, 2021, costs of services, selling and administrative expenses amounted to $2,542.7
million, a decrease of $63.5 million over the same period last year. As a percentage of revenue, costs of services, selling
and administrative expenses decreased to 84.2% from 85.4%. As a percentage of revenue, costs of services improved
compared to the same period last year due to improved utilization, additional Research and Development (R&D) tax credits
and the decrease in amortization of client relationships, in part offset by higher performance based compensation. As a
percentage of revenue, selling and administrative expenses increased compared to the same period last year due to higher
performance based compensation.

For the nine months ended June 30, 2021, costs of services, selling and administrative expenses amounted to $7,662.9
million, a decrease of $168.6 million over the same period last year. As a percentage of revenue, costs of services, selling
and administrative expenses decreased to 84.0% from 84.8%. As a percentage of revenue, costs of services improved
and selling and administrative expenses increased compared to the same period last year, both due to the same factors
identified for the quarter.

During the three months ended June 30, 2021, the translation of the results of our foreign operations from their local
currencies to the Canadian dollar favourably impacted costs by $113.2 million, partially offsetting the unfavourable
translation impact of $138.3 million on our revenue.

 3.5.2. Foreign Exchange Loss (Gain)
During the three months ended June 30, 2021, CGI incurred $1.9 million of foreign exchange losses and during the nine
months ended June 30, 2021, $2.4 million of foreign exchange gains, mainly driven by the timing of payments combined
with the volatility of foreign exchange rates. The Company, in addition to its natural hedges, uses derivatives as a strategy
to manage its exposure, to the extent possible.

© CGI Inc.                                                                                                                 Page   21
You can also read