Magnetic alignment enhances homing efficiency of hunting dogs
←
→
Page content transcription
If your browser does not render page correctly, please read the page content below
RESEARCH ARTICLE

                                     Magnetic alignment enhances homing
                                     efficiency of hunting dogs
                                     Kateřina Benediktová1*, Jana Adámková1, Jan Svoboda1, Michael Scott Painter1,2,
                                     Luděk Bartoš3,4, Petra Nováková1, Lucie Vynikalová5, Vlastimil Hart1,
                                     John Phillips6, Hynek Burda1*
                                     1
                                      Department of Game Management and Wildlife Biology, Faculty of Forestry and
                                     Wood Sciences, Czech University of Life Sciences, Praha, Czech Republic; 2Biology
                                     Department, Barry University, Miami, United States; 3Department of Ethology,
                                     Institute of Animal Science, Praha, Czech Republic; 4Department of Ethology and
                                     Companion Animal Science, Faculty of Agrobiology, Food and Natural Resources,
                                     Czech University of Life Sciences, Praha, Czech Republic; 5Department of Zoology
                                     and Fisheries, Faculty of Agrobiology, Food and Natural Resources, Czech
                                     University of Life Sciences, Praha, Czech Republic; 6Department of Biological
                                     Sciences, Virginia Tech, Blacksburg, United States

                                     Abstract Despite anecdotal reports of the astonishing homing abilities in dogs, their homing
                                     strategies are not fully understood. We equipped 27 hunting dogs with GPS collars and action
                                     cams, let them freely roam in forested areas, and analyzed components of homing in over 600
                                     trials. When returning to the owner (homewards), dogs either followed their outbound track
                                     (‘tracking’) or used a novel route (‘scouting’). The inbound track during scouting started mostly with
                                     a short (about 20 m) run along the north-south geomagnetic axis, irrespective of the actual
                                     direction homewards. Performing such a ‘compass run’ significantly increased homing efficiency.
                                     We propose that this run is instrumental for bringing the mental map into register with the
                                     magnetic compass and to establish the heading of the animal.
*For correspondence:
benediktovak@fld.czu.cz (KB);
burda@fld.czu.cz (HB)
                                     Introduction
Competing interests: The
                                     Homing, broadly defined as the ability to return to a known goal location (e.g. breeding grounds,
authors declare that no
                                     shelter sites) after displacement (Schmidt-Koenig and Keeton, 1978; Papi, 1992; Wiltschko and
competing interests exist.
                                     Wiltschko, 1995), has been shown in a taxonomically diverse range of vertebrates that rely on a mul-
Funding: See page 17                 titude of cues, for example visual, olfactory, acoustic, celestial, magnetic, and idiothetic (Schmidt-
Received: 11 January 2020            Koenig and Keeton, 1978; Papi, 1992; Wiltschko and Wiltschko, 1995; Cullen and Taube, 2017;
Accepted: 27 May 2020                Lohmann, 2018; Mouritsen, 2018). However, designing systematic studies to characterize the navi-
Published: 16 June 2020              gational strategies and underlying sensory mechanisms mediating homing behaviour in non-migra-
                                     tory species, particularly in free-ranging mammals, have proven difficult, and our understanding of
Reviewing editor: Mihaela D
Iordanova, Concordia University,
                                     large-scale navigation and homing remains incomplete (Poulter et al., 2018; Tsoar et al., 2011;
Canada                               Wolbers and Wiener, 2014).
                                         Anecdotal accounts of the impressive navigation abilities of dogs have been commonplace,
   Copyright Benediktová et al.
                                     maybe best exemplified in World War I when ‘messenger dogs’ were used as couriers to deliver sen-
This article is distributed under
                                     sitive information across battlegrounds (Richardson, 1920). Nearly a century ago, the first studies
the terms of the Creative
Commons Attribution License,         designed to examine navigational abilities in dogs were performed, revealing homing success even
which permits unrestricted use       if displaced to unfamiliar sites (Schmid 1932, 1936 cited in Nahm, 2015). Decades later, a more
and redistribution provided that     comprehensive study observed consistent homing success in a total of 26 dogs displaced without
the original author and source are   exposure to visual cues in various geographic directions. Dogs often homed using novel routes and/
credited.                            or shortcuts, ruling out route reversal strategies, and making olfactory tracking and visual piloting

Benediktová et al. eLife 2020;9:e55080. DOI: https://doi.org/10.7554/eLife.55080                                                   1 of 19
Research article Ecology
unlikely. Indeed, as previous authors have suggested, shedding light on the mystery of mammalian
homing may require unconventional research approaches that focus on ‘unusual’ senses
(Nahm, 2015).
Hunting dogs, particularly the so-called scent hounds, have been selected over generations to
detect and pursue tracks of game animals and, if not followed by the hunter, to return to the place
where the pursuit started, often over distances of hundreds or thousands of meters. How dogs pin-
point the owner’s location using novel routes of return in highly variable densely forested habitats
remains perplexing.
We expect that either dogs can find their way to the owner following their own scent trail back (a
strategy called ‘tracking’) or they can perform true navigation, the ability to home over large distan-
ces without relying on route-based landmarks or information acquired during the displacement, a
strategy we termed ‘scouting’, searching for a new way. While tracking may be safe, it is lengthy.
Scouting enables taking shortcuts and might be faster but requires navigation capability and,
because of possible errors, is risky.
Using GPS data complemented by video recordings by action cams, we analyzed orientation of
free-roaming scent hounds. We expected to find evidence for either tracking or scouting, to test the
predictions about the route length and duration, and to see indications for the type of decision
made at the turning point. Furthermore, we expected that should visual piloting (orientation towards
landmarks) take place there would be an effect of the height of the dog as higher (taller) dogs
should have better overview (farther horizon) than lower dogs.
Altogether, 27 hunting dogs from ten breeds were equipped with a GPS collar and in several
cases also with an action camera capturing a portion of the dog’s head, thus providing information
about its movement, behaviour, and the landscape in front of and around the dog (Figure 1,
Video 1). In total, 622 trials (excursions) were performed at 62 locations during diurnal walks in for-
ested hunting grounds in the Czech Republic from September 2014 to December 2017. Based on
the records, we determined turning points, dividing the whole excursion into the outbound and
inbound tracks, and we measured azimuths at particular points, length and speed of particular tracks
(Figure 2A).
Results
Return strategy
In 399 cases (59.4 %), dogs homed by following their outbound track (tracking strategy), and in 223
cases (33.2 %), dogs homed using novel route (scouting strategy). In 50 cases (8.0 %), dogs com-
bined both strategies during a single return (Figure 2B–C). In this study, we focus only on ‘scouting’.
Speed and track length
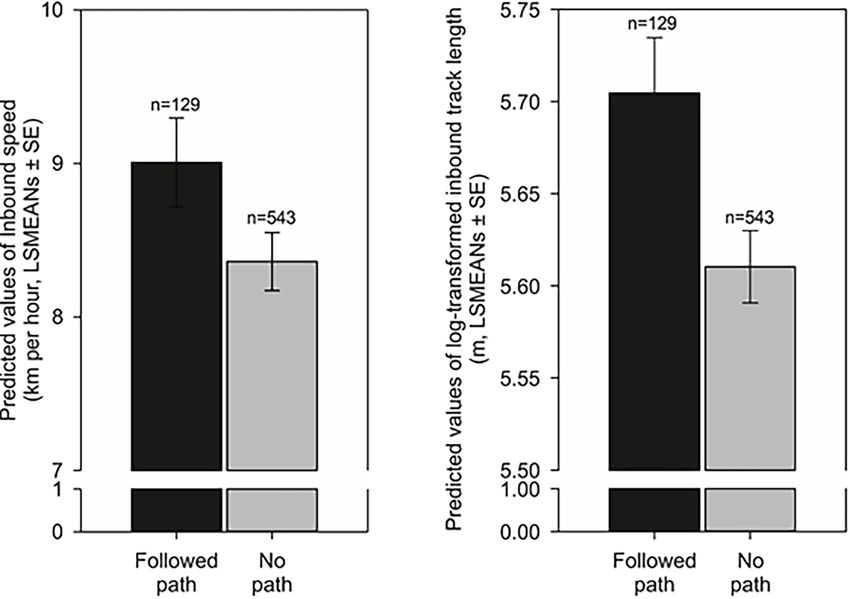
Scouting dogs were faster than tracking ones (Figure 3). As expected, taller dogs ran faster than
smaller ones, but the shoulder height did not affect length of the inbound track (Figure 4) and the
average speed of the inbound trajectory was faster when a portion of the return followed forest
paths (Figure 5). Inbound track length was significantly longer when forest paths were used (Fig-
ure 5). Shoulder height did not affect inbound track length (Supplementary file 1B- Table 2). As
expected, there was a positive correlation between direct (‘beeline’) distance between the turning
point and the owner and the average inbound track length (Figure 4, Supplementary file 1B- Table
2).
Azimuths and the ‘compass run’
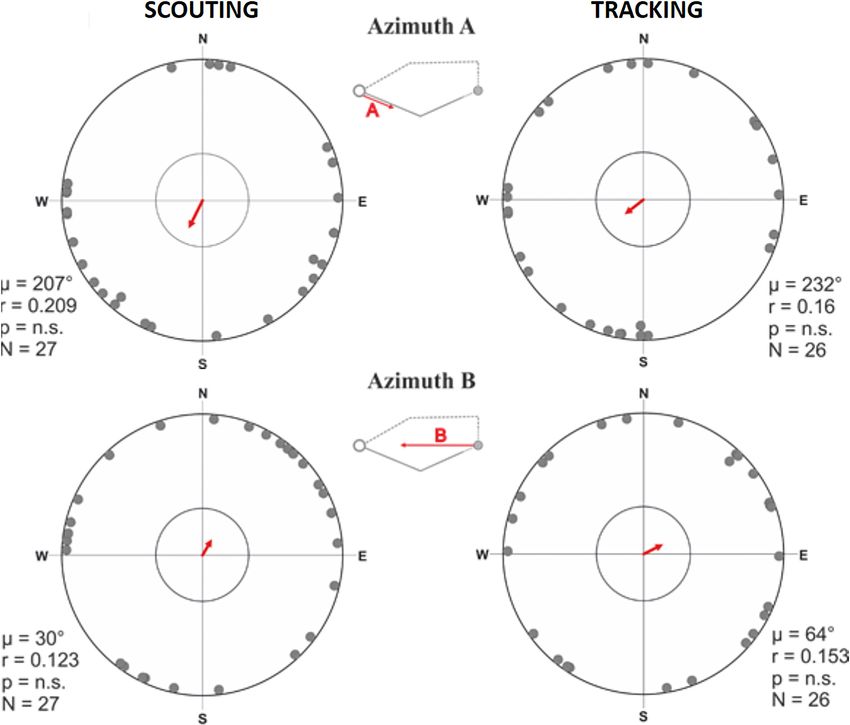
The compass directions in which dogs started the excursions (Figure 2A, azimuth A) and at the turn-
ing point relative to the excursion start, and thus to the goal (Figure 2A, azimuth B) were random,
irrespective whether dogs were later tracking or scouting (Figure 6, Supplementary file 1E- Table
5). The direction in which the dogs started to return (Figure 2A, azimuth C) was random in tracking
dogs, but significantly aligned along the ~north-south magnetic axis in scouting dogs (Figure 7,
Supplementary file 1E- Table 5). Specifically, dogs homing by scouting started their return with a
short (average length 18.1 m, Supplementary file 1D- Table 4), ‘compass run’ aligned along
the ~north-south geomagnetic axis (Supplementary file 1E-F- Tables 5-6, Video 2).
Benediktová et al. eLife 2020;9:e55080. DOI: https://doi.org/10.7554/eLife.55080 2 of 19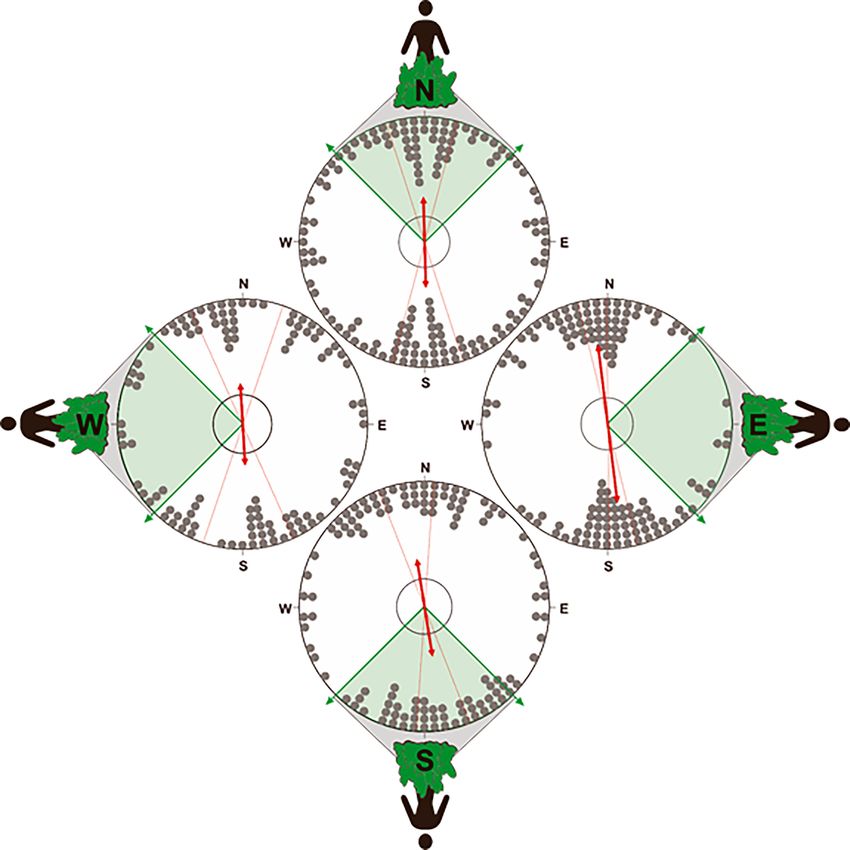
Research article                                                                                                                       Ecology

Figure 1. Still shots of a fox terrier (left column) and a miniature dachshund (right column) used in this study showing the tracking equipment and
habitat. Above: The GPS transmitter and antenna are fixed to a collar and fitted around the animal’s neck (note that for safety and comfort of the
animal, the collar is free to rotate). The black fabric harness is secured around the torso and chest and is used to attach the protective camera case
containing the camera and battery. Below: A typical field of view captured by the video camera that includes the dog’s head/neck, and provides a
detailed view of the surrounding terrain. An on-board microphone (not visible) is used to record audio.

                                        To determine if the position of the owner influenced the orientation of the compass run, we parti-
                                     tioned the data into four distributions (north, south, east, or west, + / - 45˚), according to the loca-
                                     tion of the owner relative to the turning point. In all four distributions, the compass run was
                                     significantly orientated along the ~north south geomagnetic axis, suggesting that its orientation was
                                     independent of the direction to the owner (Figure 8, Supplementary file 1F- Table 6).

Benediktová et al. eLife 2020;9:e55080. DOI: https://doi.org/10.7554/eLife.55080                                                                   3 of 19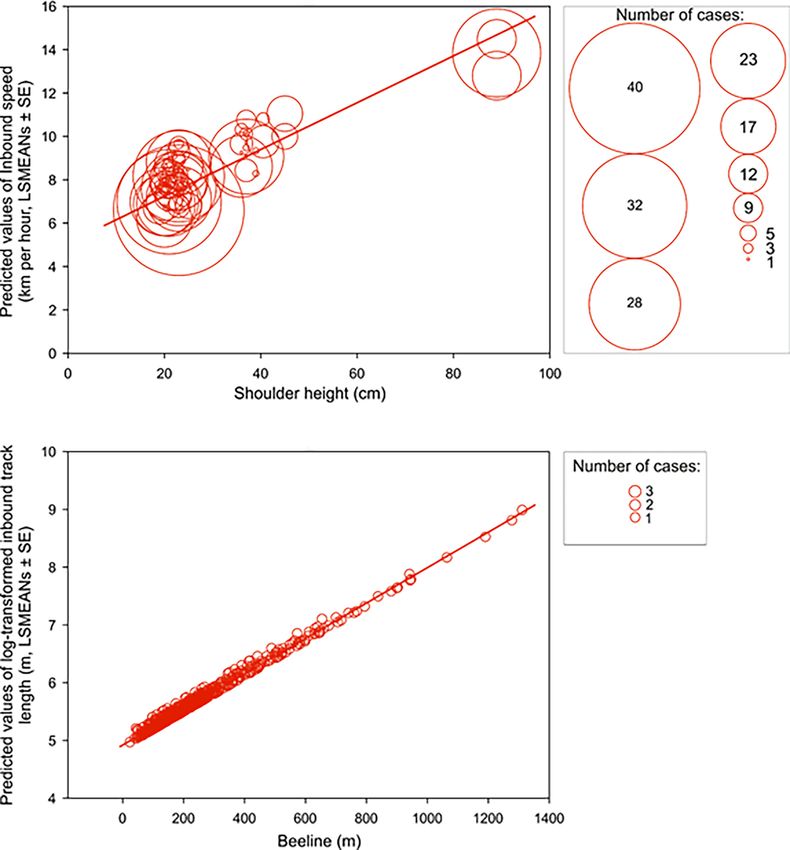
Research article Ecology
There were no significant differences in axial
preference of the compass run between sexes
(Watson’s U2 test, U = 0.027, p>0.5) or between
familiar and unfamiliar areas (Watson’s U2 test,
U = 0.036, p>0.5).
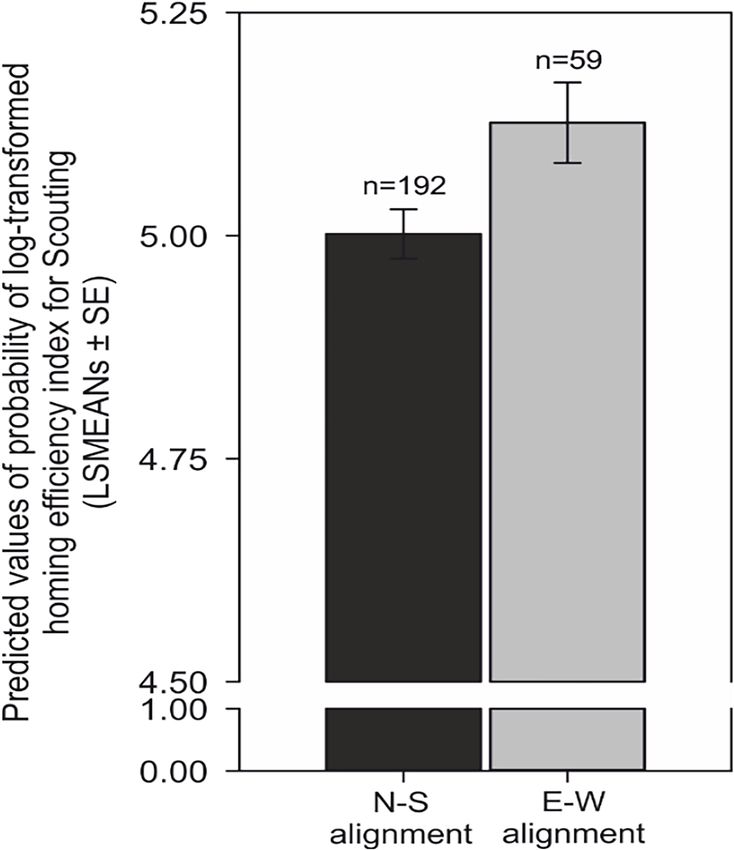
The probability of exhibiting a scouting strat-
egy after compass run was aligned along the
north-south axis was almost four times higher
than the probability of exhibiting tracking (odds
ratio = 3.60, p100 nificantly reduced compared to the ~east-west
m from the owner, at which point the owner remains
compass runs (F = 6.47, p=0.01) (Figure 9
stationary in the forest. Shortly after, the dog detects
Supplementary file 1B- Table 2).
and follows the olfactory track of a wild game animal,
indicated by barking behaviour. After the outbound
trajectory, the dog begins the turning trajectory phase Effect of sex, breed and study site
of the excursion (see Materials and methods) and the familiarity
turning point is shown when the dog briefly pauses.We partitioned the data by sex for all individuals
This location marks the beginning of the compass run
and used a Rayleigh test to determine if sex influ-
(=alignment run, azimuth C, initial inbound segment).
ence the orientation of the ‘compass run’ (Fig-
Lastly, the inbound trajectory is shown representing the
ure 2, azimuth C) during scouting returns. There
phase when the dog is homing back to the location of
the excursion start/owner.
was no significant difference between the two
https://elifesciences.org/articles/55080#video1 resulting distributions (Watson’s U2 test,
U = 0.027, p>0.5), and therefore, no sex differen-
ces in the orientation of the compass run.
Sex and breed did not influence the probabil-
ity of return strategy used during homing
(GLMM, p>0.05). Furthermore, we tested whether study site familiarity influenced the orientation of
the compass run. We grouped azimuth C into two groups, according to whether the dog had visited
the study at least one time prior to the excursion or if the dog was experiencing the study site for
the first time. No differences between the two distributions (familiar vs unfamiliar) were found (Wat-
son’s U2 test, U = 0.036, p>0.5).
Effect of sun
To test for an effect of sun and/or polarized light on the orientation of the compass run during scout-
ing returns, the sun position was determined by estimating the sun’s azimuth during the 15th day of
each month, therefore accounting for seasonal variation in azimuth position (sun position data was
taken from a central location in the Czech Republic, central to the locations of all test sites). Next,
the sun azimuth direction was recorded for each hour during the 15th day of each month, for all
available daylight hours. Thus, we created an average sun azimuth direction for each month of the
year, with one-hour resolution. For circular analyses, we pooled the orientation of azimuth C relative
to the sun position for each excursion, using the nearest hour of sun position according to each
excursion time. A Rayleigh test was used to determine if the distribution of azimuth C was non-ran-
dom when plotted relative to sun position. The position of sun, and thus polarization pattern, did
not significantly influence the orientation of azimuth C during scouting returns at the individual level
(n = 251, m = 69˚/249˚, r = 0.04, p=0.673) or at the group level (n = 27, m = 146˚/326˚, r = 0.021,
p=0.989).
Benediktová et al. eLife 2020;9:e55080. DOI: https://doi.org/10.7554/eLife.55080 4 of 19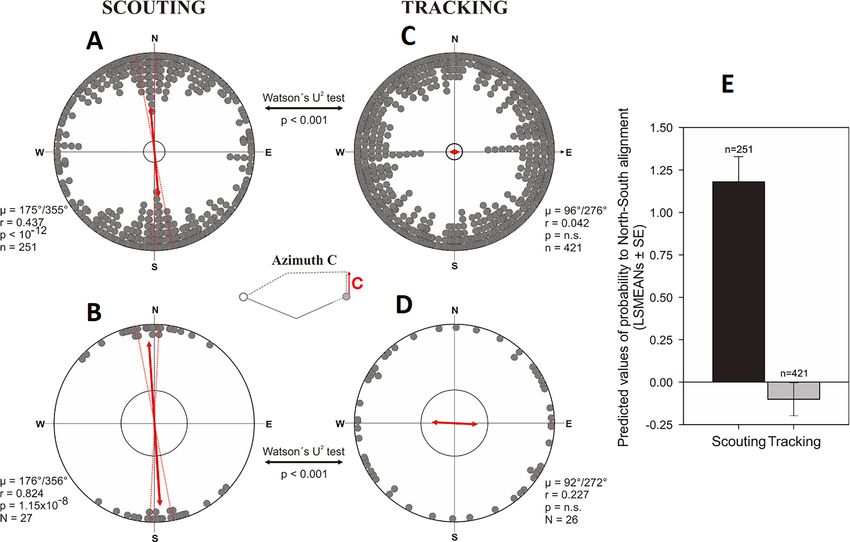
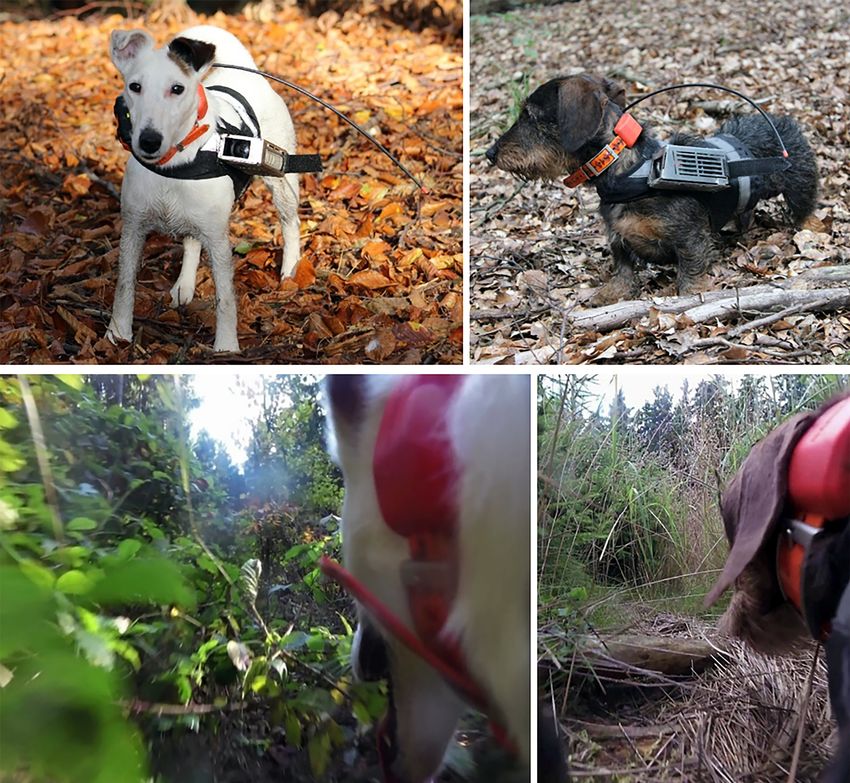
Research article                                                                                                                        Ecology

Figure 2. Spatial features and return strategies derived from GPS data used in analyses. (A) Schematic illustration of total excursion track. Excursion
start marks location of owner when the dog is more than 100 m away, indicating that the dog is pursuing a game animal. Excursion start also marks the
approximate location where the owner remains hidden until the dog returns. Turning point represents the location where the dog initiated its return to
the owner. Azimuth A represents the magnetic direction of the initial outbound segment, calculated between the excursion start and the GPS point
recorded 5 s after the excursion start. Azimuth B represents the magnetic direction of the owner relative to the dog at the turning point. Azimuth C
represents the magnetic direction of the initial inbound segment, the ‘compass run’, calculated by measuring the direction between the turning point
and the point where the dog exhibits a distinct (>20˚) deflection in track direction (magnified inset). See Materials and methods for additional details.
(B) GPS tracks showing examples of Tracking and Scouting strategies or combination of strategies. Solid white tracks show excursions. The turquoise
line shows the owner’s track and the white dotted line shows the dog’s track during non-excursion portions of the trial. (C) Examples of Tracking and
Scouting return strategies: Tracking: inbound return track falls within a ± 30 m corridor limit (shown by small white dots flanking each side of the track)
of the outbound track. Scouting: the inbound return track is separated from the outbound trajectory by at least 30 m.

Benediktová et al. eLife 2020;9:e55080. DOI: https://doi.org/10.7554/eLife.55080                                                                   5 of 19
Research article                                                                                                              Ecology

Figure 3. Average speed increases in scouting compared to tracking. Predicted values of inbound speed (km/hour, LSMEANs ± SE) according to return
strategy and independent of the direction of the compass run (azimuth C).

Benediktová et al. eLife 2020;9:e55080. DOI: https://doi.org/10.7554/eLife.55080                                                         6 of 19
Research article                                                                                                                     Ecology

Figure 4. Inbound speed and track length positively correlate with shoulder height and beeline excursion distance, respectively. Upper row: A bubble-
plot of predicted values of inbound speed (km per hour, LSMEANs ± SE) plotted relative to shoulder height (cm). The center of each bubble represents
the predictive value and bubble size represents the number of cases for that value. Size class scale is shown on the right. Bottom row: A bubble-plot of
predicted values of log-transformed total inbound track length (m, LSMEANs ± SE) as a function of direct (‘beeline’) distance between the turning point
and the owner. The center of each bubble indicates the predictive value and bubble size is equivalent to the number of cases, as shown in the box on
the right.

Benediktová et al. eLife 2020;9:e55080. DOI: https://doi.org/10.7554/eLife.55080                                                                7 of 19
Research article                                                                                                                      Ecology

Figure 5. Inbound speed (length) and inbound track length (right) influenced by forest paths during the homing return. Left: Predicted values of
inbound speed (km per hour, LSMEANs ± SE) grouped according to whether a portion of the inbound trajectory followed a forest path (‘Followed
path’), or if the return was completed without the use of a forest path (‘No path’). Right: Predicted values of log-transformed total inbound track length
(m, LSMEANs ± SE) between returns when at least a portion of the inbound track followed a forest path compared to returns when no forest paths were
used.

                                     Effect of wind
                                     Wind direction was recorded at the study site for each excursion by the owner. To test for an effect
                                     of wind direction, particularly in conditions when wind was blowing from the owner to the direction
                                     of the dog at the turning point, we used a Rayleigh test to determine if the wind direction was non-
                                     random across excursions when dogs used a scouting return strategy. In 55 cases (22 % of all scout-
                                     ing excursions), no wind was detected and therefore these excursions could not be included in the
                                     analyses. For the remainder of excursions (n = 196), Azimuth B (i.e. direction between the turning
                                     point and owner) (Figure 2) was plotted relative to the wind direction.
                                         Partitioning the circular data into eight equal bin sizes (each bin ±22.5˚ and centered on the 45’s,
                                     i.e. 0˚, 45˚, 90˚, 135˚, etc.), we found that the wind conditions in only 24 scouting returns (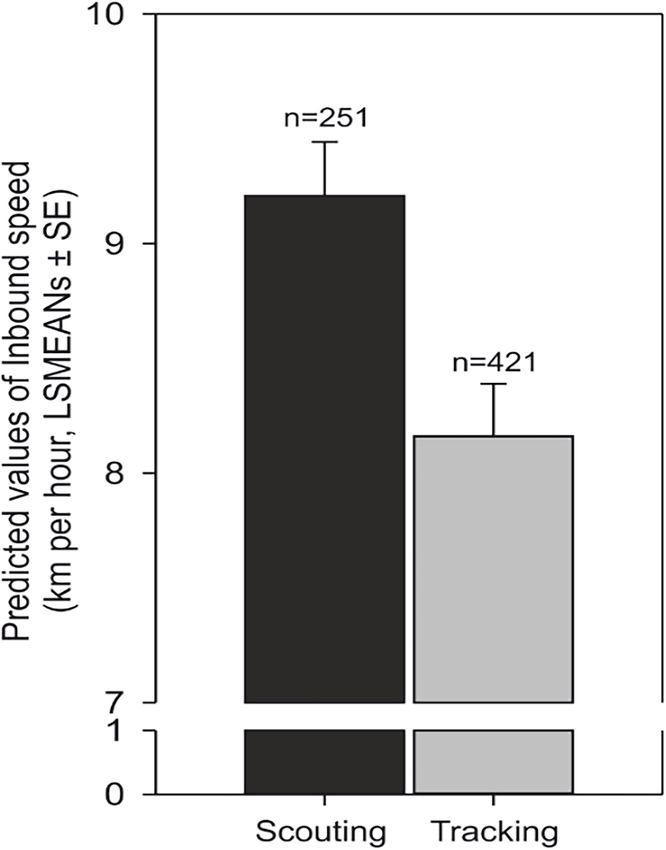
Research article                                                                                                                         Ecology

Figure 6. Circular distributions for azimuth A and azimuth B means grouped by return strategy. Circular distributions of magnetic orientation of the
direction of the turning point relative to the excursion start/owner (azimuth B) and the initial outbound segment (azimuth A) for scouting (left column)
and tracking (right column). The small schematics centered between each plot show the vector corresponding to the data in each distribution. The red
arrow indicates the angular vector (m) calculated over all angular means. The length of the mean vector (r) corresponds to the degree of clustering in
the distribution on a scale of 0.0–1.0, where the circular plot radius = 1.0. The inner circle marks the 0.05 level of significance limit computed using the
Rayleigh test.

                                      Discussion
                                      We found that dogs returning in a forest either follow back their outbound trajectory, a strategy
                                      called tracking or chose a completely new route, a strategy called scouting. In this study, we ana-
                                      lyzed only scouting events and found a conspicuous phenomenon. In most cases, dogs start their
                                      return with a short (about 20 m long) run, called here compass run, mostly performed along the
                                      north-south axis irrespective of the actual homeward direction.
                                         It is unlikely that the direct involvement of visual, olfactory or celestial cues can explain the highly
                                      stereotyped and consistent ~north south alignment of the compass run. For example, the forested
                                      habitat and dense vegetation of the study sites make visual piloting unreliable and, in many cases,

Benediktová et al. eLife 2020;9:e55080. DOI: https://doi.org/10.7554/eLife.55080                                                                     9 of 19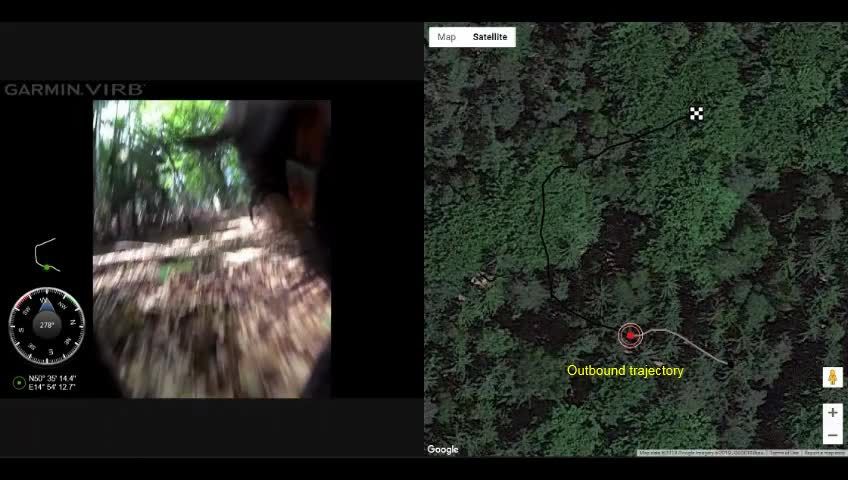
Research article                                                                                                                     Ecology

Figure 7. Alignment responses during the initial inbound return (= ‘compass run’) in free-roaming dogs. (A–D) Circular distributions showing
geomagnetic alignment responses during the initial inbound segment (azimuth C, ‘compass run’), when distributions are partitioned into Scouting (A,
B) and Tracking (C, D) return strategies. Grey bearings plotted on the periphery of the distributions represent the axial orientation of compass runs for
each excursion (A, C), each bearing treated as an independent data point, or (B, D) the axial orientation of compass runs when the mean orientation
was first calculated for each dog. All data are plotted relative to magnetic north, indicated at the top of each plot, and the red double-headed arrow
indicates the mean axial vector (m) for each distribution. The length of the mean vector (r) corresponds to the degree of clustering around the mean and
ranges from 0.0 to 1.0, with the radius of each plot = 1.0. Dashed red lines represent the 95% confidence intervals and the inner grey circle marks the
p=0.05 level of significance limit computed using the Rayleigh test. Results from Watson’s U2 tests are shown between distributions, revealing
significant differences in the compass run orientation between tracking a scouting return strategies. The small schematic centered between the plots
shows azimuth C and the axial direction of the red vector corresponds to the orientation data plotted in each distribution. (E) Predicted values of the
probability that dogs will exhibit a compass run along the ~north south geomagnetic axis (±45˚) during the initial inbound segment (LSMEANs ± SE)
according to return strategy.

                                     not possible. Furthermore, there was no effect of the body height (and thus the degree to which the
                                     dog’s field of view of its surroundings was limited) on the probability of north-south alignment when
                                     compared to east-west alignment, a fact which is not consistent with a visual piloting hypothesis.
                                     Highly variable wind conditions, coupled with turbulence in the forest understory, rule out the use of
                                     olfactory piloting during scouting. In many cases, the Sun’s disk was fully obstructed by cloud cover
                                     and/or overhead vegetation, making it challenging to use a sun or polarized light compass. And,
                                     although polarized light has been shown to calibrate the magnetic compass in bats (Greif et al.,
                                     2014), detection of skylight polarization is not thought to be widespread in mammals (Horváth and
                                     Varjú, 2004; Marshall and Cronin, 2011). More generally, it is difficult to reconcile what advantage
                                     a north-south orientation response would provide for any of the sensory modaities discussed above.
                                        In contrast, the Earth’s magnetic field provides a stable, omnipresent cue, regardless of daily or
                                     seasonal temporal variation, visual cue availability or weather conditions. The north-south alignment
                                     of the compass run in dogs is consistent with a wealth of studies providing support for spontaneous

Benediktová et al. eLife 2020;9:e55080. DOI: https://doi.org/10.7554/eLife.55080                                                               10 of 19
Research article Ecology
magnetic alignment along the north-south mag-
netic axis in a range of vertebrates in the field
(reviewed in Begall et al., 2013;
Malkemper et al., 2016) as well as in the labora-
tory under controlled conditions (e.g.
Burda et al., 1990; Phillips et al., 2002;
Muheim et al., 2006; Malkemper et al., 2015;
Painter et al., 2018).
While the functional significance of magnetic
alignment is not fully understood, magnetic align-
ment may help to organize and structure many
Video 2. Example video showing the compass run
behaviour during a scouting strategy return. The GPS aspects of spatial behaviour (Begall et al., 2013).
track is shown on the right half of the video with the This may help to explain the compass run at the
red ‘bulls-eye’ tracker synced with the video shown on beginning of homing in scouting dogs. Indeed,
the left. The bulls-eye tracker moves across the track several recent studies have shown that dogs are
corresponding to the position of the dog in the video. sensitive to magnetic cues (Hart et al., 2013;
The checkerboard square represents the location Adámková et al., 2017; Martini et al., 2018),
where the video ends, but does not represent any and behavioural studies show that Earth-strength
relevant features/landmarks used for analyses.
magnetic fields play a direct role in homing
Compass and GPS measurements are shown on the left
and are synced to the video and bulls-eye tracker.
responses also in the blind mole-rat, a subterra-
Yellow labels appear superimposed on the right side of nean mammal (Kimchi et al., 2004). Taken
the screen to indicate relevant features of the together, we propose that the compass run is
excursion. Before reaching the turning point, the dog is mediated by magnetic cues, and it helps to
travelling in a ~ west northwest direction. As shown, the increase the accuracy and reduce the complexity
compass run (=alignment run, azimuth C) starts at the of long-distance navigation across unfamiliar and/
turning point and the dog begins its initial inbound or highly variable environments.
segment in the ~north direction. The compass run is
Noteworthy, scouting dogs in unfamiliar loca-
terminated at 0:22 when the dog changes magnetic
tions cannot use visual landmarks to recalibrate a
direction by >20˚ (see Materials and methods) and the
inbound trajectory continues as the dog navigates back
path integration system. Therefore, in the
to the owner (not shown). absence of familiar landmarks, the compass run
https://elifesciences.org/articles/55080#video2 may serve to recalibrate a path integration sys-
tem relative to Earth’s magnetic field, so that
errors accumulated during the outbound trajec-
tory are not incorporated into the estimate of the
homing direction. Importantly, dogs in our study
were not passively displaced as is usual in most homing experiments (Tsoar et al., 2011;
Ostfeld and Manson, 1996), and therefore, the involvement of path integration seems plausible,
and may be one of several reasons why the compass run has not been identified in previous studies.
Our findings clearly show the importance of further research on the role and involvement of mag-
netic cues in canine (and more generally mammalian) navigation. More specifically, the research sug-
gests that the magnetic field may provide dogs (and mammals generally) with a ‘universal’ reference
frame, which is essential for long-distance navigation and arguably the most important component
that is ‘missing’ from our current understanding of mammalian spatial behaviour and cognition.
Materials and methods
Study subjects
A total of 27 hunting dogs (10 M, 17 F) from ten breeds were used in the study (Supplementary file
1A- Table 1). All dogs come from breeds with pedigrees in hunting and animal tracking and were
regularly assessed by veterinarians throughout the study. These dogs innately detect and pursue the
olfactory tracks of game, and in rare cases, dogs were able to spot game animals from a distance (i.
e. >20 m) through the forest. However, the small breeds used in this study are unable to keep pace
with the much larger and faster game animals. Therefore, dogs were almost immediately left to rely
on olfactory tracking and never posed any physical threat to wild animals.
Benediktová et al. eLife 2020;9:e55080. DOI: https://doi.org/10.7554/eLife.55080 11 of 19Research article Ecology Figure 8. Orientation of the compass run plotted relative to the position of owner. To test for an influence of the owner on the orientation of the compass run (azimuth C) during scouting, the data was partitioned into four distributions corresponding to when the owner was located at one of the four cardinal compass directions (±45˚) relative to the turning point. Therefore, the distributions above show the orientation of azimuth C when the owner is positioned at magnetic ~north (316˚ 45˚),~east (46˚ 135˚),~south (136˚ 225˚), or ~west (226˚ 315˚) relative to the turning point (i.e. relative to the start of the compass run). If the N-S orientation of the compass run is a direct response to the owner (i.e. olfactory or visual piloting towards the owner), then in situations when the owner is located along the ~east west axis relative to the turning point, the orientation of the compass run should also align along the ~east-west axis. Alternatively, if the compass run is independent of the owner, then there should be no statistical difference in the orientation of azimuth C when the owner is position in different magnetic directions. Each distribution plots the axial bearings recorded from each excursion. The position of the owner relative to azimuth C is shown on the outside of each distribution and the shaded section of each plot bounded with green arrows shows the range of possible positions of the owner in each distribution (45˚ range centered on each cardinal compass direction). All other symbols are identical to those in Figure 6. Note that the axial bearings have been rounded to the nearest 5˚ only to facilitate the graphical representation of the responses and all statistics were calculated using data values measured to 1˚ resolution. Benediktová et al. eLife 2020;9:e55080. DOI: https://doi.org/10.7554/eLife.55080 12 of 19
Research article                                                                                                          Ecology

                                    Tracking equipment
                                    Dogs were equipped with a Garmin T5 mini (or DC50) GPS collar (Garmin Ltd., USA) fitted around
                                    the neck and programed to record GPS positions at 2.5 or 5.0 s intervals (GPS accuracy ±4.2 m
                                    based on ground-truth measurements collected at study site locations). A portion of the trials (31 %)
                                    were carried out using a Garmin Virb Elite action camera (Garmin Ltd., USA) housed inside a non-
                                    magnetic stainless steel mount fixed to the side of a custom-fitted fabric harness (Figure 1). The
                                    camera captured a similar field of view to that of each dog (Figure 1), and thus provided information
                                    about the dog’s visual surroundings, including habitat characteristics. In addition, a portion of the
                                    dog’s head was also captured, providing information about the dog’s behaviour and movement
                                    (e.g. activity, head scanning, head orientation) and an on-board microphone detected barking
                                    behaviour, an indicator that the dog was in pursuit of a game track (Video 1). The customized har-
                                    ness was designed to minimize discomfort and allowed full mobility for all dogs. Dog owners were
                                    equipped with a handheld Garmin Alpha 100 or Astro 320 receiver (Garmin Ltd., USA) used to moni-
                                    tor and record GPS tracks.

                                    Experimental procedure
                                    A total of 622 trials were performed in forested hunting grounds at 62 independent locations in the
                                    Czech Republic from September 2014 to December 2017. All trials were performed with a single
                                    dog (i.e. trials were not carried out with groups of dogs), in areas free from high voltage power lines,
                                    paved roads or buildings, and at different times of day (daylight hours only) and different times of
                                    year. Dogs were transported to each site by a car and were given a 10 min rest and acclimation
                                    period in the close surroundings of the car (
Research article Ecology Figure 9. Compass run improves homing performance during scouting. Comparison of predicted values of the probability of log-transformed homing efficiency index (LSMEANs ± SE) between dogs exhibiting a compass run oriented along the ~north south (±45˚) compared to orientation along the east-west (±45˚) axis during scouting return strategies. The efficiency of homing is expressed as the ratio (%) between the length of the dog’s inbound trajectory and the direct (beeline) distance between the turning point and the excursion start/owner. Titles and legends to supplementary videos. Benediktová et al. eLife 2020;9:e55080. DOI: https://doi.org/10.7554/eLife.55080 14 of 19
Research article                                                                                                           Ecology

                                    calculated and the segment with the slowest speed was labelled as the turning trajectory. If the so
                                    determined place seems to be improbable (either too close to the start/goal or the dog pauses rela-
                                    tively long at one point) we checked the situation at video to exclude the possibility that the dog
                                    stopped to drink, bath, sniff at some interesting place or encountered difficult terrain. If this was the
                                    case or video was not available, the second slowest segment was identified as the turning trajectory
                                    (n = 26, 20˚ deflection in track direction without an immedi-
                                    ate return to its preceding track heading (Figure 2A). These criteria helped to omit short-lived track
                                    deviations often caused by obstacles (e.g. fallen trees, dense clusters of vegetation) and were
                                    applied to all tracks. A criterion for classifying the compass run as either north-south or east-west,
                                    was established by grouping runs into one of four sectors corresponding to a sector of ±45˚ of the
                                    cardinal compass axes, i.e. ~north (316˚ 45˚),~east (46˚ 135˚),~south (136˚ 225˚), or ~west (226˚
                                    315˚).

                                    Return strategies
                                    Based on preliminary evaluations from a subset of excursions, each inbound return was categorized
                                    into two distinct return strategies:
                                       1. Tracking: The inbound return trajectory followed the outbound trajectory, i.e. the dog ‘simply’
                                          followed its outbound track back to the owner (Figure 2). Here, the inbound return track is no
                                          more than 30 m from the outbound track at any point along the return path (Figure 2).
                                       2. Scouting: A novel route of return was taken to the owner (i.e. dog was not following its out-
                                          bound trajectory) (Figure 2). Here, the inbound and outbound trajectories were separated by
                                          more than 30 m (Figure 2).
                                        In some cases, dogs exhibited a combination of return strategies, e.g. dogs began the inbound
                                    return trajectory using a tracking strategy and later changed to a scouting strategy, or vice versa
                                    (Figure 2). In these relatively rare situations (n = 50, 8.4 % of all excursions), strategies were divided
                                    into two separate tracks and the initial inbound segments (azimuth C) were measured for each
                                    strategy.
                                        Importantly, the personnel responsible for identifying the spatial features of excursions (i.e. excur-
                                    sion start, outbound, turning and inbound trajectory, turning point and owner position, see Identify-
                                    ing excursion features) as well as partitioning tracks into return strategy type were unaware of the
                                    directional data (azimuths A, B, C). Conversely, personnel responsible for measuring directional data
                                    were unaware to which segments and strategies each measurement belonged. Therefore, the analy-
                                    sis of all directional data was carried out using a double-blind protocol.

Benediktová et al. eLife 2020;9:e55080. DOI: https://doi.org/10.7554/eLife.55080                                                     15 of 19
Research article Ecology
Statistical analysis
Circular statistical analyses were carried out with Oriana 4.02 (Kovach Computing Services). Before
evaluation, all directional responses were grouped by return strategy. Magnetic headings for azi-
muth A and azimuth B were treated as angular data. However, preliminary results for azimuth C
revealed a strong bimodal response within individuals, and therefore, azimuth C was treated as axial
data (Batschelet, 1981). The Rayleigh test was used for circular statistics to determine if distribu-
tions were indistinguishable from random at the p0.05) were dropped from the model.
Interaction terms were tested and all tests were treated as two-tailed distributions.
The effects used in the analyses were continuous variables and classes are listed in
Supplementary file 1. C - Table 3. Where appropriate, variables were log-transformed to improve
normality of residuals and to reduce skewness. All fitted models included the dog’s identity as a ran-
dom effect to account for the use of repeated measures across the same individuals.
Least-squares means (LSMEAN) were computed for each class and differences between classes
were tested using a t-test. Associations between the dependent variable and time were estimated
by fitting a random coefficient model using PROC MIXED (Tao and Littell, 2002). Predicted values
of the dependent variable were calculated and plotted against the fixed effect with predicted
regressions for each group. Where more than one value was plotted in the same position, a bubble
plot was generated to represent the data.
To compare the probability of an event between two groups, an odds ratio was calculated
(Stokes et al., 2012). Odds ratios greater than one imply that the event is more likely to occur in the
first group, while an odds ratio less than one implies that the event is more likely to occur in the sec-
ond group.
Acknowledgements
We thank the following students, colleagues and collaborators for helping to collect the field data:
Tereza Březinová, Václav Fuks, Hedvika Fuksová, Mirka Jakšlová, Barbora Kletečková, Hana Kneřová,
Alena Mottlová, Richard Policht, Jaroslav Spal, Hana Spalová, and Miloslav Zikmund. We thank
Richard Holland, Diethard Tautz, and two anonymous reviewers for their constructive comments on
the manuscript.
Benediktová et al. eLife 2020;9:e55080. DOI: https://doi.org/10.7554/eLife.55080 16 of 19Research article Ecology
Additional information
Funding
Funder Grant reference number Author
European Social Fund Operational Programme Hynek Burda
Research, Development and
Education, EVA 4.0
European Social Fund Operational Programme Hynek Burda
Research, Development and
Education, CZ.02.1.01/0.0/
0.0/16_019/0000803
Ministry of Agriculture of the MZE-RO0718 Luděk Bartoš
Czech Republic
Czech University of Life CIGA CZU (Project No. Hynek Burda
Sciences Prague 20174319)
Faculty of Forestry and Wood IGA (Project No. B07/16) Hynek Burda
Sciences, Czech University of
Life Sciences Prague
Grant Agency of the Czech No. 15-21840S Hynek Burda
Republic
European Regional Develop- Operational Programme Hynek Burda
ment Fund Research, Development and
Education, EVA 4.0
European Regional Develop- Operational Programme Hynek Burda
ment Fund Research, Development and
Education, CZ.02.1.01/0.0/
0.0/16_019/0000803
The funders had no role in study design, data collection and interpretation, or the
decision to submit the work for publication.
Author contributions
Kateřina Benediktová, Conceptualization, Resources, Data curation, Formal analysis, Investigation,
Visualization, Methodology, Writing - original draft; Jana Adámková, Investigation, Visualization,
Methodology, Project administration; Jan Svoboda, Petra Nováková, Investigation; Michael Scott
Painter, Formal analysis, Methodology, Writing - original draft, Writing - review and editing; Luděk
Bartoš, Formal analysis, Visualization, Writing - original draft, Writing - review and editing; Lucie
Vynikalová, Formal analysis, Visualization; Vlastimil Hart, Conceptualization, Supervision, Funding
acquisition, Methodology, Writing - original draft, Project administration; John Phillips, Formal analy-
sis, Writing - original draft, Writing - review and editing; Hynek Burda, Conceptualization, Formal
analysis, Supervision, Funding acquisition, Validation, Visualization, Methodology, Writing - original
draft, Project administration, Writing - review and editing
Author ORCIDs
Kateřina Benediktová https://orcid.org/0000-0003-0130-4770
Vlastimil Hart http://orcid.org/0000-0003-4901-3817
Hynek Burda https://orcid.org/0000-0003-2618-818X
Ethics
Animal experimentation: Permission from landowners and local game managers were obtained prior
to entering each location, and searching and tracking methods were in accordance with the Czech
national law and regulations for game management (§ 14 and § 15, Decree No. 244/2002, Ministry
of Agriculture, Statue No. 449/2001, Game Management). The Professional Ethics Commission of
the Czech University of Life Sciences in Prague has decided that according to the law and national
and international rules, this study has not a character of an animal experiment and does not require
a special permit.
Benediktová et al. eLife 2020;9:e55080. DOI: https://doi.org/10.7554/eLife.55080 17 of 19Research article Ecology
Decision letter and Author response
Decision letter https://doi.org/10.7554/eLife.55080.sa1
Author response https://doi.org/10.7554/eLife.55080.sa2
Additional files
Supplementary files
. Source data 1. Basic raw data used in calculations.
. Supplementary file 1. Information on subjects studied, parameters included in the analyses, and
results of circular statistics. (A) Table 1 Information about dogs used in the study. Owner = initials of
owner accompanying dog during walks, Age = age or age-range during the study period,
NOUT = number of outbound trajectories, NIN = total number of inbound trajectories, NT = number
of inbound returns using a tracking strategy, NS = number of returns using a scouting strategy. (B)
Table 2 Factors in the final GLMMs for the dependent variables (in bold). a) probability for N-S align-
ment (±45˚) during the initial inbound segment (i.e. ‘compass run’); b) probability for scouting strat-
egy; c) efficiency of return; d) speed of inbound trajectory; e) inbound track length. (C) Table 3
Effects used in General Linear Mixed Models. (D) Table 4 Length parameters during different phases
of the excursion (data from combined strategies are excluded). (E) Table 5 Circular analyses of indi-
vidual (‘raw’) and grouped means for azimuth A, B and C during scouting and tracking strategies,
and when a scouting strategy was used as the second return strategy (tracking used as a second
return strategy not shown). Means were calculated by averaging directional headings for each dog,
then calculating a grand mean from all individuals. Raw data were calculated by treating each azi-
muth as an independent bearing. Note that due to the bimodal preference found within individual
dogs for azimuth C, these bearings were treated as axial data. See Figures 6–8. (F) Table 6 Axial
analyses of azimuth C (=orientation of the compass run) partitioned into four groups to test for an
influence of the owner on the orientation of the compass run during scouting strategy returns. Each
analysis corresponds to the orientation of the compass run when the owner was located in one of
four cardinal compass directions (±45˚) relative to the turning point. Therefore, owner positions rela-
tive to the turning point are: owner = magnetic ~ north (316˚ 45˚),~east (46˚ 135˚),~south (136˚
225˚), or ~west (226˚ 315˚). All data are treated as independent bearings. (See Figure 8).
. Transparent reporting form
Data availability
The raw source data are provided as Source Data 1.
References
Adámková J, Svoboda J, Benediktová K, Martini S, Nováková P, Tůma D, Kučerová M, Divišová M, Begall S, Hart
V, Burda H. 2017. Directional preference in dogs: laterality and "pull of the north". PLOS ONE 12:e0185243.
DOI: https://doi.org/10.1371/journal.pone.0185243, PMID: 28945773
Batschelet E. 1981. Circular Statistics in Biology. London: Academic Press.
Begall S, Malkemper EP, Červený J, Němec P, Burda H. 2013. Magnetic alignment in mammals and other
animals. Mammalian Biology 78:10–20. DOI: https://doi.org/10.1016/j.mambio.2012.05.005
Burda H, Marhold S, Westenberger T, Wiltschko R, Wiltschko W. 1990. Magnetic compass orientation in the
subterranean rodent Cryptomys hottentotus (Bathyergidae). Experientia 46:528–530. DOI: https://doi.org/10.
1007/BF01954256, PMID: 2347407
Cullen KE, Taube JS. 2017. Our sense of direction: progress, controversies and challenges. Nature Neuroscience
20:1465–1473. DOI: https://doi.org/10.1038/nn.4658, PMID: 29073639
Greif S, Borissov I, Yovel Y, Holland RA. 2014. A functional role of the sky’s polarization pattern for orientation in
the greater mouse-eared bat. Nature Communications 5:4488. DOI: https://doi.org/10.1038/ncomms5488,
PMID: 25050897
Hart V, Nováková P, Malkemper EP, Begall S, Hanzal V, Ježek M, Kušta T, Němcová V, Adámková J, Benediktová
K, Červený J, Burda H. 2013. Dogs are sensitive to small variations of the earth’s magnetic field. Frontiers in
Zoology 10:80. DOI: https://doi.org/10.1186/1742-9994-10-80, PMID: 24370002
Horváth G, Varjú D. 2004. Polarized Light in Animal Vision. Berlin, Heidelberg: Springer. DOI: https://doi.org/10.
1007/978-3-662-09387-0
Benediktová et al. eLife 2020;9:e55080. DOI: https://doi.org/10.7554/eLife.55080 18 of 19Research article Ecology
Kiernan K, Tao J, Gibbs P. 2012. Tips and Strategies for Mixed Modeling with SAS/STAT Procedures. SAS
Global Forum.
Kimchi T, Etienne AS, Terkel J. 2004. A subterranean mammal uses the magnetic compass for path integration.
PNAS 101:1105–1109. DOI: https://doi.org/10.1073/pnas.0307560100, PMID: 14732687
Lohmann KJ. 2018. Animal migration research takes wing. Current Biology 28:R952–R955. DOI: https://doi.org/
10.1016/j.cub.2018.08.016, PMID: 30205070
Malkemper EP, Eder SHK, Begall S, Phillips JB, Winklhofer M, Hart V, Burda H. 2015. Magnetoreception in the
wood mouse (Apodemus sylvaticus): influence of weak frequency-modulated radio frequency fields. Scientific
Reports 5:9917. DOI: https://doi.org/10.1038/srep09917
Malkemper EP, Painter MS, Landler L. 2016. Shifted magnetic alignment in vertebrates: evidence for neural
lateralization? Journal of Theoretical Biology 399:141–147. DOI: https://doi.org/10.1016/j.jtbi.2016.03.040,
PMID: 27059891
Marshall J, Cronin TW. 2011. Polarisation vision. Current Biology 21:R101–R105. DOI: https://doi.org/10.1016/j.
cub.2010.12.012, PMID: 21300269
Martini S, Begall S, Findeklee T, Schmitt M, Malkemper EP, Burda H. 2018. Dogs can be trained to find a bar
magnet. PeerJ 6:e6117. DOI: https://doi.org/10.7717/peerj.6117, PMID: 30588405
Mouritsen H. 2018. Long-distance navigation and magnetoreception in migratory animals. Nature 558:50–59.
DOI: https://doi.org/10.1038/s41586-018-0176-1, PMID: 29875486
Muheim R, Edgar NM, Sloan KA, Phillips JB. 2006. Magnetic compass orientation in C57BL/6J mice. Learning &
Behavior 34:366–373. DOI: https://doi.org/10.3758/BF03193201, PMID: 17330527
Nahm M. 2015. Mysterious ways : the riddle of the homing ability. J. Soc. Psych. Res 79:140–155.
Ostfeld RS, Manson RH. 1996. Long-Distance homing in Meadow Voles, Microtus pennsylvanicus. Journal of
Mammalogy 77:870–873. DOI: https://doi.org/10.2307/1382692
Painter MS, Davis M, Ganesh S, Rak E, Brumet K, Bayne H, Malkemper EP, Phillips JB. 2018. Evidence for
plasticity in magnetic nest-building orientation in laboratory mice. Animal Behaviour 138:93–100. DOI: https://
doi.org/10.1016/j.anbehav.2018.02.006
Papi F. 1992. Animal Homing. Berlin, Heidelberg: Springer. DOI: https://doi.org/10.1007/978-94-011-1588-9
Phillips JB, Freake MJ, Fischer JH, Borland CS. 2002. Behavioral titration of a magnetic map coordinate. Journal
of Comparative Physiology A 188:157–160. DOI: https://doi.org/10.1007/s00359-002-0286-x
Poulter S, Hartley T, Lever C. 2018. The neurobiology of mammalian navigation. Current Biology 28:R1023–
R1042. DOI: https://doi.org/10.1016/j.cub.2018.05.050, PMID: 30205053
Richardson EH. 1920. Dogs Bwar Their Training and Psychology. London: Skeffington & Son Ltd.
Schmidt-Koenig K, Keeton WT. 1978. Animal Migration, Navigation, and Homing. Berlin, Heidelberg: Springer.
DOI: https://doi.org/10.1007/978-3-662-11147-5
Stokes ME, Davis CS, Koch GG. 2012. Categorical Data Analysis Using SAS. SAS Institute Inc.
Tao J, Littell R. 2002. Mixed Models Analyses Using the SAS System: Course Notes. SAS Institute Inc.
Tsoar A, Nathan R, Bartan Y, Vyssotski A, Dell’Omo G, Ulanovsky N. 2011. Large-scale navigational map in a
mammal. PNAS 108:E718–E724. DOI: https://doi.org/10.1073/pnas.1107365108, PMID: 21844350
Wiltschko R, Wiltschko W. 1995. Magnetic Orientation in Animals. Berlin, Heidelberg: Springer. DOI: https://doi.
org/10.1007/978-3-642-79749-1
Wolbers T, Wiener JM. 2014. Challenges for identifying the neural mechanisms that support spatial navigation:
the impact of spatial scale. Frontiers in Human Neuroscience 8:1–12. DOI: https://doi.org/10.3389/fnhum.2014.
00571, PMID: 25140139
Benediktová et al. eLife 2020;9:e55080. DOI: https://doi.org/10.7554/eLife.55080 19 of 19You can also read