London Local Elections Pack - A guide to the 2022 elections From the Opinium political team
←
→
Page content transcription
If your browser does not render page correctly, please read the page content below
London Local Elections Pack
A guide to the 2022 elections
From the Opinium political team

May 2022
Local elections in the capital always attract huge
    interest. In the context of sweeping electoral
    changes over the last 4 years and some
    remarkable political events of the last 4 months, all
    eyes will be on the fates of the surviving
    Conservative councils in London.

    The political team at Opinium have taken an in-
    depth look at the borough council elections. We
    hope that our research will illuminate the vote on
    the 5th May and provide election-watchers with a
    helpful guide as to what to look out for as the
    results come in.

                                         James Crouch
                          Head of Policy & Public Affairs

2
Contents

Contents

01
     Understanding these local elections
     The four categories of ward in London that helps explain how
     the election might play out

02
     State of play
     How London voted at the last local elections and what the
     battleground for 2022 looks like

03
     Battleground boroughs
     A focus on the key battleground boroughs and what to look out
     for on election night

04
     Past elections in London
     What recent elections in the capital can tell us about the
     direction voters are heading

05
     Our polling
     What matters the most to Londoners in these elections and
     how will it impact how residents will vote

06
     About us
     Find out a little more about Opinium’s political and social team
     and what we do

3
Understanding these local elections
    Welcome to our guide to the 2022 local elections in London

4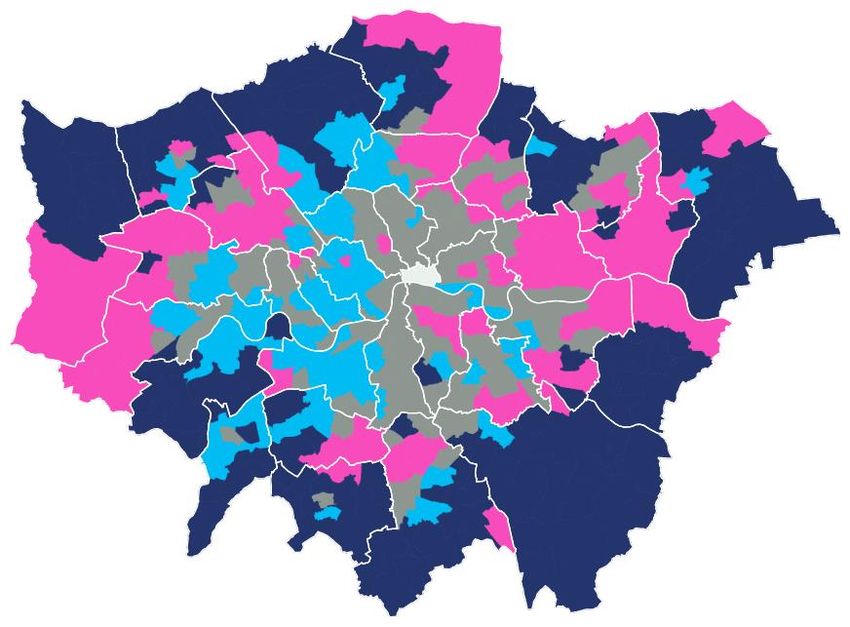
Introduction

    The four
    categories of
    ward in London

    Older homeowning suburbs

    Professional graduate neighbourhoods

    Young and urban districts

    Working-class estates

5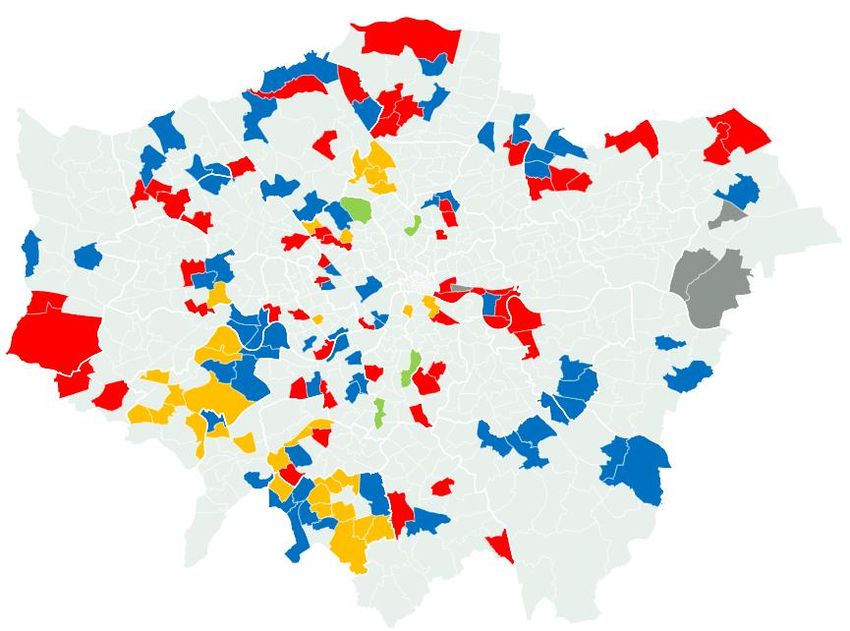
Introduction

    The four categories of ward in London

    Older homeowning                        Professional graduate                 Young and urban                         Working-class
    suburbs                                 neighbourhoods                        districts                               estates
    The oldest areas of the capital, with   These areas have the highest          The most common type of ward in         Neighbourhoods with the highest
    a significant number of over 50s,       number of graduates who are           inner London, it’s also the youngest,   number of blue collar workers and
    most of whom are homeowners with        generally successful and higher-      with the lowest rates of home and       the lowest number of graduates.
    many owning 2 or more cars. These       income younger professionals. The     car ownership. Although everyone        Although housing tenure is mixed,
    suburbs are mainly – but not            housing mixture is a combination of   living there has that in common, it     social housing (current or former) is
    exclusively – white and can often be    privately      rented  flats   and    tends to be a complex mix of            likely to be prominent. These are
    from a variety of class backgrounds,    homeowners. They are generally        privately renting graduates (usually)   most of the majority-minority areas
    as far from all are professional or     white, although not necessarily       and minorities (usually) in social      in London, often with only a small
    managerial.                             white British.                        housing.                                proportion of white Brits.

6
State of play
    How London voted at the last local elections and what the battleground
    for 2022 looks like

7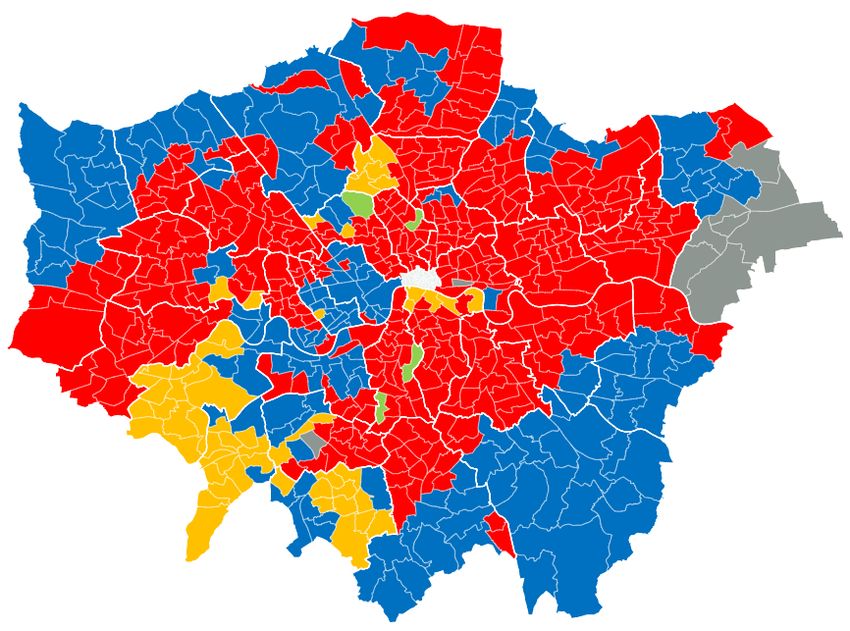
State of play

    Results of the 2018 local elections

                                Councillors                                                                Vote share

        1123
                                                                                   44%

                                                                                               29%
                     511

                                                                                                           13%
                                                                                                                                               4%
                                             11                     27                                                 9%          1%
                                155                      7

         Lab        Con       Lib Dem      Green        Ind       Other             Lab        Con       Lib Dem      Green        Ind        Other

     Labour won more than twice as many councillors as the Conservatives in     Labour won 44% of the vote, a 15-point lead over the Conservatives on
     2018. After 1982 the only time the Conservatives have had a plurality of   29%. In terms of vote share. This is the best local election performance
     councillors in London was 2006.                                            ever for Labour in London, including their success in 1994 during John
                                                                                Mayor’s troubled premiership.

8
State of play

    London is often seen as being a combination of
    Conservative-leaning suburbs surrounding a Labour-
    voting urban centre. The real picture is more complex.

    Outer London still has a large number of estates, while
    the Conservatives have struggled with demographic
    change in many of their old heartlands. The Liberal
    Democrats have also had a major presence in south
    west London since the 1990s.

    Conversely central London, containing many of the
    most affluent parts of the country, has several
    Conservative redoubts. The gentrification of many
    traditional working class areas in inner London also saw
    limited Conservative success under David Cameron,
    even if this is less obvious now.

    Largest party in 2018
    local elections by ward
                                                               Labour
                                                               Conservative
                                                               Lib Dem
                                                               Green
                                                               Other

                                                               These wards are coloured according to the party of the candidate with most votes. If an Independent received the most
9                                                              votes it is coloured according to the party of the candidate with second most votes, as most wards elect three councillors.
State of play

     Last time around, Labour came top in 57 wards by less
     than 15%, and these wards elected a total of 161
     councillors.

     This was actually fewer than the Conservatives, who
     held onto 66 wards that would now be considered
     marginal, electing a total of 194 councillors.

     Most of the Lib Dems’ wards were held by less thana
     15% margin - 32 wards electing a total of 95 councillors.

     That the Conservatives held more wards marginally is
     partly due to a greater efficiency in spreading their
     vote. However, it also makes their already small
     number of councillors vulnerable to any further
     advance in the Labour vote share in 2022.

     The marginal wards as
     they were in 2018
                                                                 Labour 57 wards / electing 161 councillors
                                                                 Conservative 66 / 194
                                                                 Lib Dem 32 / 95
                                                                 Green 4 / 12
                                                                 Other 4 / 11

                                                                 These are the wards where the gap between the largest party and the second largest party (excluding independents) is
10                                                               less than 15% of the votes (or requiring a swing of 7.5% or less to take).
State of play
The Conservative-Labour battleground
Wandsworth is the most vulnerable Conservative council in London, followed by Barnet. If Labour wins most of the Tories’ marginal wards in
Westminster they could also take overall control there. In the longer term the Conservatives could be more vulnerable in Bromley than the current tally
of councillors appears. The Tories’ greatest opportunities are taking Harrow or depriving Labour of overall control in Merton.
The Conservative-Labour battleground
Safe Labour Marginal Labour Oth Marginal Conservative Safe Conservative
Conservative Hillingdon 15 6 6 38
councils that could
be vulnerable in
future
Bromley 8 17 33
Westminster 12 7 17 24
Conservative
councils vulnerable Barnet 15 10 14 24
to Labour
Wandsworth 21 5 15 18
Labour councils Harrow 24 11 10 18
vulnerable to the
Conservatives Merton 27 7 5 12
Labour councils Croydon 35 6 4 25
that could be
vulnerable in future
Hamm. and Fulham 26 9 3 8
Control of the council for either side
These are the number of marginal councillors for Labour and the Conservatives. This means they were elected in a ward where the gap where between the largest party and the second largest party (excluding independents) is
11 less than 15% of the votes (or requiring a swing of 7.5% or less to take). For example, this tally might include a Labour councillor elected alongside two Conservatives in a marginal Conservative ward.State of play
The Conservative-Lib Dem battleground
Sutton is the most vulnerable Liberal Democrat council in London, and the Conservatives’ most likely gain considering the large number of marginal
wards.
Richmond upon Thames has a much stronger base for the Liberal Democrats, including many safer wards in Twickenham, although it still could be
vulnerable to a successful Conservative challenge. Kingston upon Thames appears to be solidly behind the Lib Dems, particularly nearer Surbiton
which falls within the constituency represented by the party leader, Sir Ed Davey.
The Conservative-Lib Dem battleground
Safe Lib Dem Marginal Lib Dem Oth Marginal Conservative Safe Conservative
Lib Dem councils
Sutton 6 28 15 3
vulnerable to the
Conservatives Richmond upon Thames 18 21 11
Kingston upon Thames 33 6 6 3
Control of the council for either side
These are the number of marginal councillors for the Lib Dems and the Conservatives. This means they were elected in a ward where the gap where between the largest party and the second largest party (excluding
12 independents) is less than 15% of the votes (or requiring a swing of 7.5% or less to take). For example, this tally might include a Lib Dem councillor elected alongside two Conservatives in a marginal Conservative ward.The battleground boroughs
A focus on the key battleground boroughs and what to look out for on
election night
13In focus
Wandsworth: background and marginal wards
Political makeup Demographic makeup
While Wandsworth has been a Conservative council for over four decades, the Tories’ hold on the Wandsworth is predominantly made up of professional graduate neighborhoods, with several
council is now precarious and now all three constituencies have a Labour MP. The Conservatives’ young and urban districts at various corners of the borough. Labour controls the latter districts,
strength is around Wandsworth Common and Putney. Labour’s strength is around Tooting, with with Tooting being the best example, as it is much more ethnically diverse than other parts of the
growing pockets of support around Battersea and Roehampton. borough. On the other hand, the Tories control the leafier and more affluent neighbourhoods
stretching from Clapham Common in the east to Barnes Common in the west.
Labour’s opportunities are focused on the two marginal wards around Balham (which elected 6
Conservative councillors in 2018), and the two marginal wards around Clapham Junction and The Conservatives’ line of defence is predominantly in the east of the borough. 8 of their 15
Battersea (which elected 5 Conservative councillors). The Conservatives only need to lose 3 vulnerable councillors are from wards within the Battersea constituency alone. Wandsworth is
councillors to lose overall control. If Labour gains 5 councillors, they will take overall control. undergoing boundary changes at this election. Most have related successor wards. The key Tory
defences will be: Balham, Lavender, Trinity, St Mary’s, Southfields.
14In focus
Wandsworth: electoral history
The Conservatives have seen a drastic drop in their fortunes in Wandsworth. They generally did better here than in London as a whole until 2015 and larger than
average swings away from the Conservatives begin to be clear from 2016. As late as the 2018 local elections, the Conservatives still have a considerable advantage
compared to rest of London where Labour has a large lead. This had almost completely evaporated in the 2019 general election – Wandsworth is where Labour made
their one and only gain – and in the 2021 Assembly elections. Even assuming a few additional points at borough council level, it will be an uphill struggle for the
Conservatives to reverse this trend to the extent that they will be able to hold onto the council.
70% 70% 70% 70%
60% 60% 60% 60%
50% 50% 50% 50%
40% 40% 40% 40%
30% 30% 30% 30%
20% 20% 20% 20%
10% 10% 10% 10%
0% 0% 0% 0%
2010 2015 2017 2019 2010 2014 2018 2012 2016 2021 2012 2016 2021
GENERAL ELECTIONS LOCAL ELECTIONS ASSEMBLY ELECTIONS MAYORAL ELECTIONS
15In focus
Westminster: background and marginal wards
Political makeup Demographic makeup
The City of Westminster is often aligned closely with the historically Conservative seat of the Westminster is predominantly made up of professional graduate neighborhoods, with large
same name, including famous areas such as Belgravia and Marylebone. But it also contains pockets of young and urban districts and working-class estates. The political pattern in the
historically Labour areas. For example, the former Paddington North constituency was Labour north of the constituency is more predictable, with Labour controlling the latter two areas and the
solidly from 1945 until it was abolished. It now makes up a part of the Westminster North Conservatives maintaining a lead in the professional areas.
constituency, which has been Labour since it was created in 2010.
However, the picture is more complex in the south with very atypical areas and the
Currently there are three main battlegrounds. demographics of electors not necessarily matching those of the general residents of the area.
The Tories are attempting to defend two or more councillors in these wards: Bayswater,
1. The three wards around Pimlico are marginal, which elected seven Conservative councillors
Lancaster Gate, Little Venice, Tachbrook, West End, Vincent Square
between them.
2. The two wards around Bayswater elected 5 Conservative councillors.
3. Other vulnerable Tory councillors can be found in Little Venice and the West End.
16In focus
Westminster: electoral history
Westminster and Wandsworth voted Conservative by a similar degree at all levels up until 2015. However, the rate at which the Conservatives’ advantage in
Westminster has dropped has been much slower since 2016. Although Labour has been in contention for the most votes at local level since 2018, this is in the context
of Labour having a large lead across London and Labour having the most votes at a general election since 2017. There may be a trend in Labour’s direction which
makes future gains appear likely, but taking control of the borough council still looks like a challenge too far for Labour this year.
70% 70% 70% 70%
60% 60% 60% 60%
50% 50% 50% 50%
40% 40% 40% 40%
30% 30% 30% 30%
20% 20% 20% 20%
10% 10% 10% 10%
0% 0% 0% 0%
2010 2015 2017 2019 2010 2014 2018 2012 2016 2021 2012 2016 2021
GENERAL ELECTIONS LOCAL ELECTIONS ASSEMBLY ELECTIONS MAYORAL ELECTIONS
17In focus
Barnet: background and marginal wards
Political makeup Demographic makeup
The Conservatives have been the largest party at local level in Barnet since its inception in 1964 Barnet is for the most part made up of the older homeowning suburbs, with professional
and have controlled the council for all but 8 years of that time. It includes Margaret Thatcher’s old graduate neighborhoods around Finchley and Golders Green, and working-class estates in
seat of Finchley and former cabinet minister Theresa Villiers’ seat in Chipping Barnet. Hendon.
Traditionally a Tory corner of London, Barnet voted for Tony Blair’s New Labour in big numbers. Labour’s base is amongst the graduates in Finchley and the large number of minorities in the
Since 2010 it has elected three Conservative MPs but not always by comfortable margins. working-class areas around Colindale. In addition, Labour has made advances in the leafier
Historically Chipping Barnet in the north was the strongest part of the borough for the Tories, now suburbs in the further north of the borough, with some demographic change impacting this.
all corners of the constituency are a complicated mixture of Conservative and Labour voters. Barnet is also the local authority with the largest number of Jews in the country, which also
makes the political patterns in recent times heavily specific to the area.
The primary battleground is in the north of the constituency, stretching from Hale in the west to
Brunswick Park in the east. That includes five wards which elected 9 Conservative and 6 Labour There are boundary changes, Tories will be looking to return councillors in: Brunswick Park, High
councillors. The Tories are also defending 5 more marginal councillors in and around the Golders Barnet, Underhill, Edwgare, Edgwarebury, West Hendon, Cricklewood and Childs Hill.
Green area.
18In focus
Barnet: electoral history
Almost nothing about Barnet looks like the story from Wandsworth or Westminster. Firstly, it is less central, mostly in zones 4 or 5. Then it is also the opposite electoral
story, Labour is stronger at borough council level than any other, but also there is very little evidence that it is trending against the Conservatives. Hence, while Barnet
might have a large number of marginals wards, a Labour takeover of this council would suggest a far wider wipe out for the Conservatives in London.
70.0% 70% 70% 70%
60.0% 60% 60% 60%
50.0% 50% 50% 50%
40.0% 40% 40% 40%
30.0% 30% 30% 30%
20.0% 20% 20% 20%
10.0% 10% 10% 10%
0.0% 0% 0% 0%
2010 2015 2017 2019 2010 2014 2018 2012 2016 2021 2012 2016 2021
GENERAL ELECTIONS LOCAL ELECTIONS ASSEMBLY ELECTIONS MAYORAL ELECTIONS
19Past elections
What recent elections in the capital can tell us about the direction voters
are heading
20The London blues:
Past elections
A story of two halves
It is often assumed that the Conservatives have done poorly in London since
the 2016 referendum, with comparatively little attention given to the city re-
electing a Conservative mayor as recently as 2012.
In reality, the Conservatives have performed poorly in London for at least the
last twenty years, if not longer. David Cameron was the first Conservative
prime minister not to win a plurality of votes in London, a position that got
worse in 2015 even when he won an overall majority in the general election.
Demographic change is the barrier he could not overcome. Even Boris
Johnson’s re-election in 2012 provided few coattails for his party at the
Assembly level where it was trounced by 9 points.
However, this failure of the Conservative Party in London has two phases, and
the second, post-referendum, chapter is more ominous for the party in the
longer term.
David Cameron maxed out his support in the homeowning suburbs and the
well-to-do graduates of inner London in opposition to a divided left-of-centre
vote. Since then Labour has consolidated much of left-of-centre vote and the
Tories have done badly amongst those successful graduates in central
London. The former looked bad, but the latter was lethal in battleground areas
such as Kensington and Wandsworth.
Peculiarly, the Conservatives have shed their graduate votes and ended up
gaining supporters in the diverse working class estates in London – the 2019
election anticipated this trend before it was replicated in the 2021 assembly
and mayoral elections. A trend useful for keeping their city-wide vote share
steady, terrible in terms of winning seats or councils.
Key to understanding the results will be 2022 council elections will be spotting
if this trend continues or not.
21General elections
General elections: average vote share
2005 2010 2015 2017 2019
54%
48%
44%
40% 37%
31% 34% 35% 34% 32%
22% 7% 22% 7% 7% 8% 5%
14% 4% 14%
Con Lab LD Oth Con Lab LD Oth Con Lab LD Oth Con Lab LD Oth Con Lab LD Oth
Conservative-Labour swing by constituency type
Older homeowning suburbs 5% 2% 4% 2%
Professional graduate neighbourhoods 6% 2% 9% 1%
Young and urban districts 1% 4% 8% 1%
Working-class estates 1% 5% 4% 5%
22Local elections
Local elections: total vote share
2010 2014 2018
42% 44%
32% 33% 29% 29%
23%
13% 12% 17% 13% 14%
Con Lab LD Oth Con Lab LD Oth Con Lab LD Oth
Conservative-Labour swing by ward type
Older homeowning suburbs 3% 1%
Professional graduate neighbourhoods 3% 4%
Young and urban districts 7% 3%
Working-class estates 7% 2%
23Assembly elections
Assembly elections: total vote share
2012 2016 2021
41% 40% 38%
32% 29% 31%
7% 6% 24% 7% 24%
20%
Con Lab LD Oth Con Lab LD Oth Con Lab LD Oth
Conservative-Labour swing by ward type
Older homeowning suburbs 0% 2%
Professional graduate neighbourhoods 2% 5%
Young and urban districts 2% 2%
Working-class estates 3% 7%
24Mayoral elections
Mayoral elections: total vote share
2012 2016 2021
44% 44%
40% 40%
35% 35%
4% 5% 4% 20%
12% 16%
Con Lab LD Oth Con Lab LD Oth Con Lab LD Oth
Conservative-Labour swing by ward type
Older homeowning suburbs 5% 0%
Professional graduate neighbourhoods 10% 7%
Young and urban districts 9% 4%
Working-class estates 0% 10%
25Our polling
What our latest poll in London tells us about the borough council
elections taking place this year
26Polling
Average Westminster voting intention
in London
At a Westminster level, the
51%
49%
Conservatives have lost a lot
of ground to Labour
We have compared the average polling figures from the London region across 6 27%
polls at the end of 2021, and 9 polls since the start of 2022.
23%
The Conservatives have dropped 4 points between those two periods, from 27%
to 23%. Labour has seen an increase of 2 points to 51%, and the Lib Dems have
seen an increase of 2 points to 14%.
14%
12%
This suggests a general movement from the Conservatives to the other parties
from the end of last year.
6% 6%
Oct-Dec 2021 Jan-Apr 2022
27 A representative study of 1,000 London adults (aged 18+) conducted between 14 th and 20th April.Polling
Voting intention at the 2022 local elections
While Labour might be looking at a 20-point lead in
vote share at the local elections, this would still be Implied vote share in the 2022
equivalent to a swing of only 2.5% from the
Conservatives.
local elections in London
While 25% would be a very bad performance for the
Conservatives in the capital, it means that Labour’s
chances at taking their target councils are far from Implied swing
certain.
to Labour
At a local level Labour’s voting intention lags quite far
behind what it is at a Westminster-level, either due to 45%
differential turnout or because the Labour coalition is
more likely to fracture in favour of other parties such
as the Greens.
Despite this, the polling evidence appears to be that
2.5%
the Conservatives are likely to lose ground at these
local elections but the scale or impact of these losses
is unclear. 25%
12%
10%
Lab Con Lib Dem Green
28 A representative study of 1,000 London adults (aged 18+) conducted between 14 th and 20th April.Polling
Housing is the most important local issue
Labour also holds significant leads on the most important local issues. This is true of both traditionally strong Labour subjects (health/NHS, public services) but also
more traditionally strong Conservative subjects like crime and council tax. Labour also lead on energy/power which has climbed up the importance ranking recently.
Most important local issues Most trusted party on each issue
Housing / house prices 37% 40% 20%
Health / NHS 34% 44% 23%
Energy / power 32% 39% 18%
Economy 29% 39% 27%
Crime 23% 35% 24%
Council tax 22% 38% 19%
Inequality 16% 47% 16%
Environmental issues 16% 37% 19%
Public services / benefits 15% 49% 18%
Transport 14% 40% 24%
Immigration 13% 41% 23%
Terrorism 8% 27% 28%
Education 8% 41% 23%
A representative study of 1,000 London adults (aged 18+) conducted between 14 th and 20th April. V1021. And which of the following do you think will be the biggest issues facing Londoners at the moment? Please select up to
29 three options. V104A. And which party locally do you think has the best approach or responds best on…?When it comes to council tax,
are these parties…
… a tax raising party … a tax cutting party Neither Don’t know
The Conservatives are
seen as a tax raising 49%
party at a local level
Half (49%) of Londoners think that the Conservatives are a tax raising party at a 29% 31%
local level, while only 29% think that of the Labour Party.
There are specific battleground areas, such as Wandsworth, where the 22%
Conservatives are fighting on a low council tax platform. The outcome could 18% 18%
depend on if the London-wide perception holds even in these battleground areas, 16% 17%
or if intense campaigning at a local level can overturn this perception.
Conservatives Labour
A representative study of 1,000 London adults (aged 18+) conducted between 14 th and 20th April.
30 V105. When it comes to council tax locally, do you think the following parties are...About us
Find out a little more about Opinium and what we do
31About us
The senior political team at Opinium
The senior political team at Opinium have experience running research and polling around elections, campaigns, and for policy. Get
in touch with us to find out more or to receive additional insight about the upcoming local elections.
ADAM DRUMMOND CHRIS CURTIS JAMES CROUCH PRIYA MINHAS
32Get in touch
Whether you’d like to discuss a project or simply learn more –
we’d love to hear from you.
020 7566 3190
political@opinium.com
58 Great Sutton Street, London, EC1V 0DGYou can also read