Levelling up the Lifecycle - A Think Piece from Metro Dynamics - April 2021
←
→
Page content transcription
If your browser does not render page correctly, please read the page content below
o

Levelling up the Lifecycle –

A Think Piece from Metro Dynamics
April 2021

                   1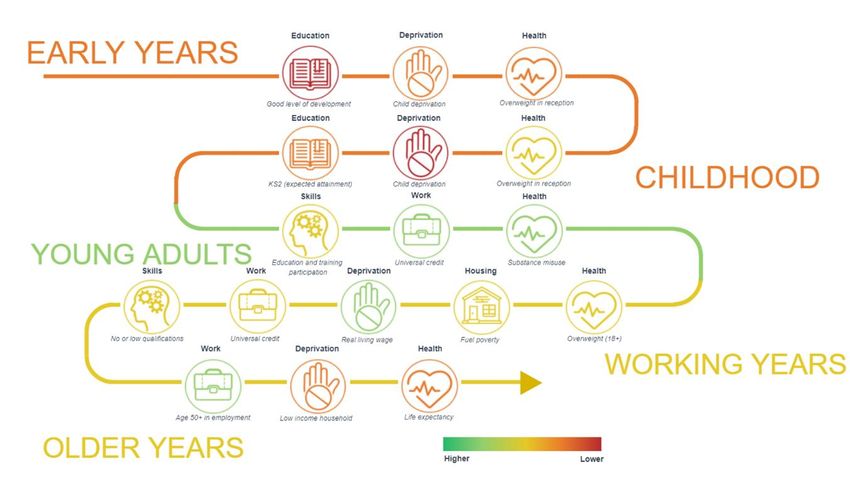
Contents

 Inclusive Recovery and Growth in 2021 .......................................................................................... 3
 Levelling up the Lifecycle ....................................................................................................................... 4
 Using the Lifecycle Data Tool................................................................................................................ 5
 Our Emerging High-Level Findings .................................................................................................... 8
 Next Steps..................................................................................................................................................... 9

                                                                              2
As the lockdown begins to lift, the economy starts to open and local vaccination
programmes continue to make progress, the UK is looking optimistically towards recovery
and renewal from the pandemic. In the context of the Government’s priorities on levelling
up, now is the opportune time to think through what building back better and inclusive
recovery mean for places.

To help with this, Metro Dynamics has developed a Levelling up the Lifecycle approach – a
new way of thinking about economic, social and health policy that helps places work
towards creating inclusive, sustainable and thriving communities.

To illustrate this approach we have developed a Lifecycle Data Tool, available here via our
website. It shows spatial differences in outcomes across different stages of the lifecycle and
how these interrelate with data on health, education and deprivation. The Lifecycle Data
Tool can be used to explore this analysis and see how these spatial differences play out
across England.

Inclusive Recovery and Growth in 2021
Covid-19 has shone a spotlight on the relationship between people, health and the economy.
The pandemic has exacerbated existing inequalities, in both the profile of people and places
most affected by the health and economic impacts of the crisis. Demographic and socio-
economic inequalities have played out in Covid-19 infection and death rates across different
dimensions, including age, gender, ethnicity, occupation and underlying health.2

Rates have been highest in urban areas of high deprivation and density. The death rate for
people living in the least deprived areas in England was less than half the death rate in the
most deprived areas from April to July 2020.3 And the economic impacts have been felt
most in those places with higher levels of underlying economic vulnerability.

Arising from the pandemic are new challenges, such as the impact of long Covid on the
workforce and school catch up. The pandemic has widened educational inequalities, linked
to home learning environments and access to digital resources, with the richest third of
primary school children spending four and a half hours per week more on learning than the

2 Sources: Age & gender – ONS, April 2021; ethnicity – PHE, August 2020; occupation – ONS, 2021; health
– BMJ, 2020
3 ONS, 2020

                                                  3
poorest third.4 Other existing challenges which have been worsened by the pandemic
include mental health and financial insecurity.
Given these challenges, more than ever, it is important to take a holistic approach to
developing inclusive, sustainable and thriving communities and economies, integrating
economic, social and health policy. This has been championed as an approach over the years
by Public Health England, highlighting how health and wealth are two sides of the same
coin5. We have built on this thinking and developed a Levelling up the Lifecycle approach to
help local places think more about the anatomy of the local inclusive growth challenge –
how they compare to other places – and better inform how to deliver an inclusive recovery
and levelling up.
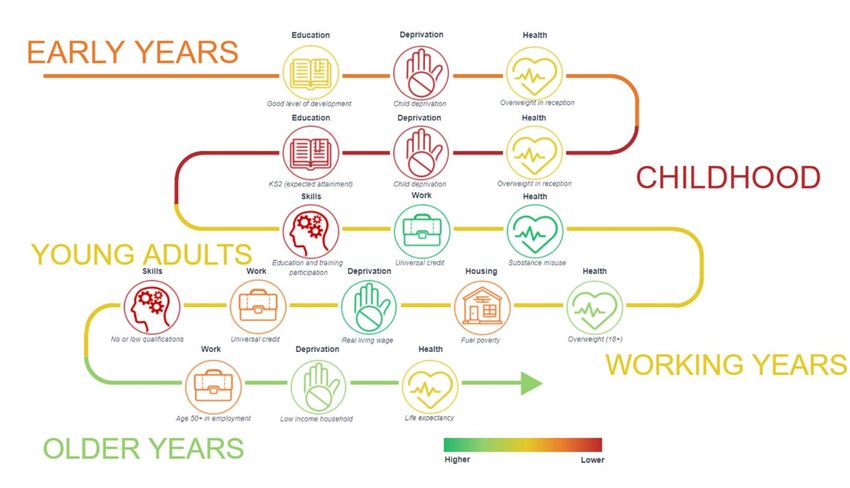
Levelling up the Lifecycle
Our approach is a high-level inclusive growth diagnostic tool that gives a snapshot of how a
place is performing. It looks at outcomes for people in five different stages of life: Early
Years, Childhood, Young Adults, Working Years, and Older Years, across education, skills,
work, housing, deprivation and health. Sitting underneath each theme is one metric which
captures performance in this area, is available at the local level (ideally district or unitary
authority) and has been published recently. The insights from the Lifecycle analysis can
help inform local decision-makers where future focus and attention should be prioritised.
4Institute for Fiscal Studies (2020) Family time use and home learning during the COVID-19 lockdown.
5 Metro Dynamics and Public Health England (2017) Health and Wealth: The Inclusive Growth
Opportunity for Mayoral Combined Authorities.
4This analysis has been run for every local authority in England and our first Levelling Up the
Lifecycle Index scores themes and life stages by a five-stage RAG rating from ‘red’ (worst) to
‘dark green’ (best).
Using the Lifecycle Data Tool
The Lifecycle Data Tool has two interactive visuals:
• Flow visual – On the home screen, click ‘flow visual’ to see our Levelling up the Lifecycle
infographic. At the bottom right-hand side of the screen, you can select a place to view,
and the infographic will automatically update. More information on how to interpret the
infographic is available if you click the ‘?’ icon at the bottom left-hand side of the screen.
To return to the home screen, click ‘Return to navigation’ on the top left-hand side of the
screen. You can also use the arrows at the bottom of the screen to move from the flow
visual to the map visuals.
• Map visual – Click on one of the life stages and this will take you through to a map of
English local authorities. Use the buttons on the left-hand side of the screen to select the
overall RAG rating for the life stage or the rating by individual theme. To return to the
home screen, click ‘Return to navigation’ on the top left-hand side of the screen. You can
also use the arrows at the bottom of the screen to move through the different life stage
map visuals or to go back to the flow visual.
Over the next couple of pages are two examples, from Leeds and Norwich, to show how the
Levelling Up the Lifecycle approach can be used to develop insights about a place.
5Leeds
Like many places with a university and large student presence, Leeds performs well for
Young Adults with good health outcomes and low levels of Universal Credit claimants.
However, the number of 16-17 year olds not in education, employment or training is
higher than other places, such as York, and suggests that not all of the young people who
grow up in the city are connected to the strong education offer. Like many of the Core
Cities, Early Years and Childhood are life stages where many of the indicators are ‘orange’
or ‘red’, and score lower than other places. Research by Professor James Heckman shows
that early intervention is a cost-effective strategy for promoting economic growth with a
7-10% per year return on investment.6 A focus on early years in Leeds across all themes –
health, education and deprivation – could have lasting positive impact through a
resident’s life. Higher levels of deprivation and poor health in later life also suggest that
there should be a focus on healthy ageing.
6 The Heckman Equation (2012)
6Norwich
Selected as one of 12 Opportunity Areas to improve education standards locally,
education and skills is a challenge in Norwich across the lifecycle. This begins with low
school attainment and continues into low performance for Young Adults. For working
adults, this may be a barrier to employment, as the city has high Universal Credit rates,
and into older years, this may inhibit work for those aged over 50. Despite this, the city
performs well for wages, reflecting growth in tech, creative, finance and insurance, as well
as the work of the Council and local businesses, including Aviva, on promoting the Real
Living Wage. Health is an area where Norwich performs well for young and working
people, but lower performance in Early Years and Childhood may suggest that this
becomes a priority area of focus.
7Our Emerging High-Level Findings
Looking across the themes and life stages, we’ve started to think about what it tells us about
place and a person’s life chances. Some of our early analysis suggests:
1. There are clear geographical disparities. The lowest performing places include the
‘Red Wall’ (especially strong for Early Years) and some coastal and rural areas. A
total of 40 local authorities are in the two lowest RAG ratings, either ‘red’ or ‘orange’,
across all life stages, including many towns and cities in the North and Midlands, as
well as Great Yarmouth, Peterborough and Thanet.
2. Early Years is a major challenge across the country. It is the life stage with the
highest proportion of local authorities in the lowest RAG rating (14%). Performance
in Early Years is strongly related to how the place performs in the Childhood
metrics.
3. There are intergenerational trends at play. City centres perform well for Young
Adults relative to other life stages, whilst their hinterlands and neighbouring towns
perform less well. This illustrates the mobility of young people moving to university,
often in larger cities, and perhaps staying for job opportunities. And Older Years
outperforms the other life stages with over half of local authorities in the two
highest RAG ratings.
4. Places that start poorly tend to perform low across the lifecycle. Of the 45 local
authorities that are RAG rated ‘red’ for Early Years, only two see significant positive
improvement for Childhood, rising to six for Working Years. Equally, those that start
off well tend to continue that trajectory. Of the 45 local authorities with the highest
RAG rating for Early Years, only one drops to mid-ranking for Childhood.
5. In low performing areas for Early Years, Childhood and Young Adults, one of the
main factors is educational/skills attainment. Across both Childhood and Working
Years, health is an important factor. Housing quality is an important driver of
performance for Working Years, and over 50s employment is most significant for
low performance in Older Years.
8Next Steps
Over the next few months, we will be doing more work on Levelling up the Lifecycle to
better understand the challenges facing places, local economies and their communities. We
will use various lenses to unpack the analysis, but we’d also be keen to hear from you as to
what you think of this new type of diagnostic we’ve developed. Is it helpful and how should
we develop it?
We will bring our findings and insights together to consider potential policy implications.
What does this mean for recovery, renewal and levelling up in places? And what data should
be available to measure progress?
We’d love to hear from you. If you’re interested in finding out more, please get in touch at
admin@metrodynamics.co.uk
93 Waterhouse Square Elliot House 138 Holborn 151 Deansgate London Manchester EC1N 2SW M3 3WD 020 3868 3085 0161 393 4364 10
You can also read