JOB LONGEVITY A study on migrant workers of Singapore, Mar-Sep 2021 - TWC2
←
→
Page content transcription
If your browser does not render page correctly, please read the page content below

A study on migrant workers of Singapore, Mar-Sep 2021

JOB LONGEVITY

Table of Contents

Executive summary
Introduction
Methodology
Profile of Respondents
Employment Tenure
Salary
Recruitment Fees
Conclusion

Executive Summary

This study looks at the work history of work permit (WP) holders      • Overall, more than 40% of respondents have worked for three or
from Bangladesh and India (NOTE: almost all of the Indian               more companies, and about two-thirds have worked for two or
respondents are from Tamil Nadu). Respondents serve in the              more companies. In general, Bangladeshi respondents have
construction, marine and process sectors. We chose to focus on          worked at more companies than Indian respondents, i.e. they
these sectors and nationalities as these are the workers that TWC2      changed companies more frequently. The mean average tenure
typically works with. The study was based on an online survey           for all respondents was 4.2 years per company.
distributed through various channels, in three languages: English,
Bengali and Tamil.                                                    • Bangladeshi respondents reported a lower mean starting basic
                                                                        salary when compared to Indian respondents. This may be the
The main findings of the study are as follows:                          reason why Bangladeshi workers tended to change jobs more
                                                                        frequently – they hope to get a pay raise with a new employer.
• Most of the respondents in the survey have been working in            Bangladeshi respondents also reported a lower mean current
  Singapore between 6 to 15 years. Compared to the previous             basic salary compared to their peers from India.
  survey (2016), respondents in this survey have been working in
  Singapore for longer than those surveyed in 2016.                   • The starting basic salary of respondents adjusted for CPI has
                                                                        decreased gradually from the cohort who arrived in 2000 to the
• Less than one-third of the respondents are currently working in       most recent cohort. In contrast, the construction sector GDP
  their first job. This suggests that most respondents have             and productivity have increased in the same time period.
  opportunities to switch companies. In contrast, the 2016 survey
  found that two-third of respondents were in their first job since
                                                                                                                                         3
  they first came to Singapore.
Executive Summary

• The mean basic salary increment for Bangladeshi and Indian        • We defined a worker’s “recovery period” as the recruitment fees
  respondents in the 2021 survey is slightly higher than in the       that a worker has paid divided by his starting basic monthly
  2016 survey. We calculated the basic salary increment as the        salary. With increasing recruitment fees and decreasing starting
  difference between the salary when they first arrived in            basic salaries for successive cohorts of workers, the average
  Singapore and the current basic salary. There is no significant     recovery period has risen from about 6.5 times their monthly
  difference between Bangladeshi and Indian respondents in their      basic salary for the 2000-2005 cohort to the current 11 times for
  mean basic salary increment.                                        the 2016-2020 cohort. The recovery period for Bangladeshi
                                                                      workers is significantly longer than their counterparts from
• In general, respondents who have worked in Singapore longer         India.
  reported a higher current basic salary, which should be
  expected, and respondents who have worked for more                The ensuing sections discuss the motivations for the study, explain
  companies reported a higher basic salary increment.               the methodology, provide more details on the profile of the
                                                                    respondents, and elaborate on the findings.
• In terms of recruitment fees, Bangladeshi respondents reported
  higher median recruitment fees at $6000 compared to Indian
  respondents, who paid a median recruitment fee of $2000.
  Recruitment fees paid have been rising over the years.

                                                                                                                                          4
Introduction

Introduction

  This study aims to provide insights into the work history of foreign    • Recruitment fees paid by the workers to come to Singapore
  workers in Singapore. The focus is on male Indian and Bangladeshi
  work permit holders (WPHs) in the construction, marine and              The length of time that the workers are employed in Singapore and
  process (CMP) sectors. These are the workers that TWC2 often            their company is an important area to investigate as this is tied to
  works with and this study would enable the organisation to better       productivity and the workers’ safety and welfare. A high churn rate
  understand their situation and contextualise the issues that they       where workers stay in Singapore only for a short period of time and
  face. From TWC2’s experiences and interactions with the workers,        are quickly replaced by new workers would not be beneficial to the
  the CMP sectors are understood to share similarities in salary          worker, to the company or to Singapore. It takes time for the worker
  scales and recruitment fees.                                            to acclimatise himself to the work environment, to be trained and to
                                                                          learn on the job.
  This study will cover primarily the following areas, which are
  interlinked and have to be studied together:                            A more experienced worker who has worked in Singapore for some
                                                                          time would be, all things remaining equal, more productive than a
  • The workers’ employment tenure in Singapore and the extent of         newly arrived worker. Crucially, he is also likely to be less prone to
    turnover                                                              injury. Many of the injury cases handled by TWC2 are from workers
                                                                          who are in their first year of employment in Singapore,1 perhaps
  • Evolution of their salary during the period of employment in          because these workers have not adapted to their workplaces and
    Singapore                                                             are less familiar with safety protocols.

1 http://twc2.org.sg/2019/02/16/are-foreign-workers-abusing-wic-claims/                                                                            6
Introduction

Companies also incur administrative costs in bringing in new           There is also the ethics of what constitutes a reasonable wage for
workers. To the worker, the length of time he can work in Singapore    these workers and whether their wages rise in tandem with
is important as he needs to recoup the often significant recruitment   experience, and with inflation.
fees paid to agents in their home country. He would also want to
save sufficient money for a better life and/or to start a business     The discussion of foreign workers’ employment in Singapore is not
when they return home.                                                 complete without consideration of recruitment fees. These fees,
                                                                       together with work permit conditions that restrict their ability to
On the subject of salary, the wages of the worker and how it           change jobs, put WPHs in a weak and even vulnerable position
changes over the tenure of his employment has an impact on how         relative to their employers. WPHs are often wary of losing their jobs
quickly the money paid to agents can be recouped. Many of these        because of the debts they incurred to agents in their home country
workers are in debt when they arrive in Singapore, and experience      for securing a job in Singapore. It is therefore important to know
some financial stress. The salary level and how it changes over        how much these workers pay, and how long it takes for them to
time also has an impact on the worker’s decision on how long to        recover the fees from their salary.
stay with a company and whether to seek a transfer to another
company promising higher pay. One thing to note is that many
employers see transfers as something that benefits their business
competitors, so many workers end up being repatriated by their
current employers when they seek transfers to another company.

                                                                                                                                               7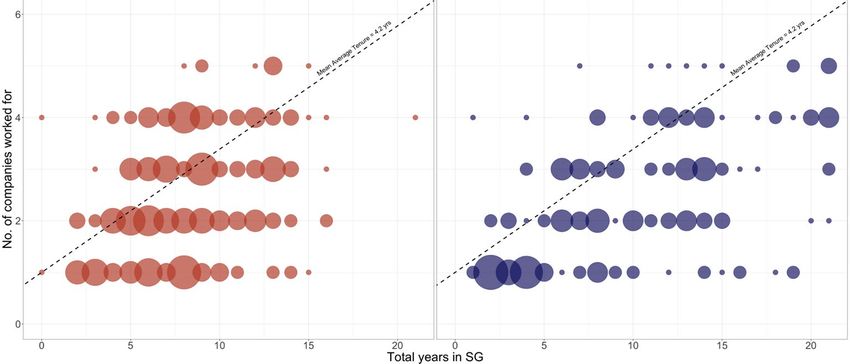
TIMELINE OF IMPORTANT POLICY CHANGES and EVENTS
                                   1987; Levy is 200
                                   SGD with max WPH of
                                                                                                                                        2011; Introduction of
                                   50% in construction                                                                                  levy differential for
                                   sector (Bal, 2013)                                                                                   workers with 4 - 6 years
                                                                                                                                        experience and
                                                                                                                                        CoreTrade or SEC(K)
                                                                                                                                                                      2012; Levy
                                                                                                                                                                      increased to 200 -
                                                                                                     2010; Levy                                                       450 SGD with max
                                                                                                     increased to 160 - 470                                           WPH of 87.5% in
                                                       1988; Levy increased to                       SGD with max WPH of                                              construction sector
                                                       100 - 430 SGD with max                        87.5% in construction                                            .
                                                       WPH of 80% in construction                    sector (Bal, 2013)
2006; start of                                         sector (Bal, 2013).
the construction of                                    Introduction of man-year
MBS and RWS                                            entitlements (MOM)                                                          2015; some flexibility
                                                                                                                                   given to construction                  2013; Levy increased
                                                                                                                                                                          to 300 - 950 SGD with max
                                                                                                                                   and process WPH to                     WPH of 87.5% in
                                                                                                                                   change employers                       construction sector (Bal,
                                                                                                                                                                          2013; MOF Budget)

                                                                              2009; gradual dip                  2017; in
                      2008; financial                                         in foreign workforce               construction
                      crisis (great recession)                                numbers                            sector, minimum
                                                                                                                 10% of R1

                                                                                                                               2018; Maximum employment
                                                                                                                               period of 10 (R1) and 18 (R2) years
                                                                                                                               increased to 14 and 26 respectively.                                   8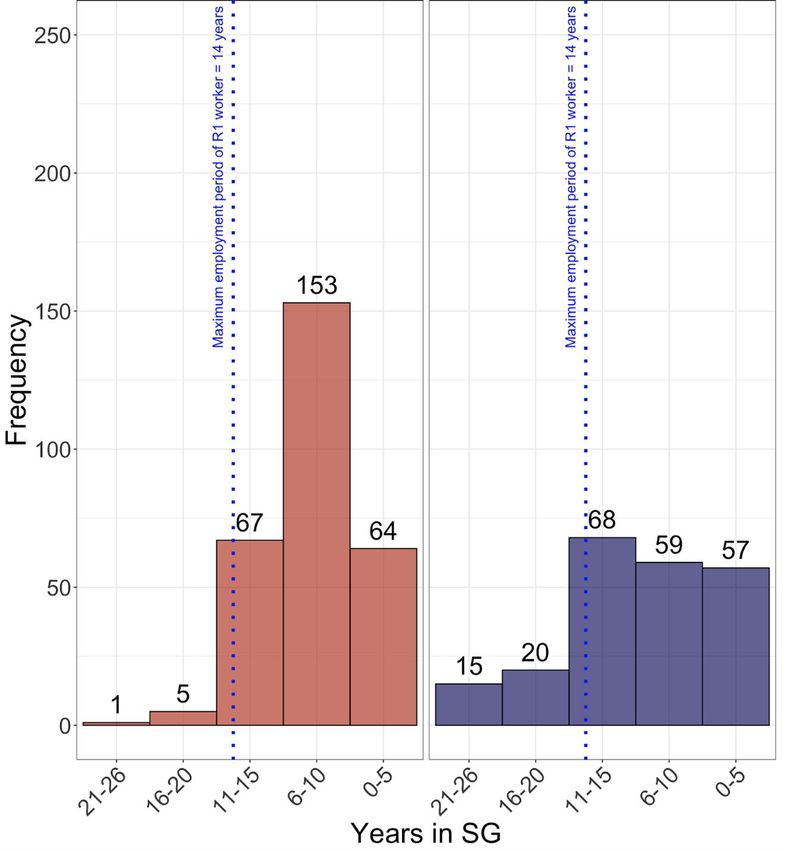
Methodology
Methodology

The data analysed in this study was collected through a Google        To incentivise participation and as a gesture of appreciation, the
Forms survey shared with foreign workers via TWC2’s Tamil and         respondents were entered into a lucky draw where 400 of them
Bengali Facebook pages as well as personal contacts.                  were selected for a $10 phone top-up.
The survey was made available in three languages: English, Tamil
and Bengali. It was disseminated from the last week of April 2021     The first five questions of the survey sought to understand the
and was closed by the end of the first week of May 2021.              personal profile of the respondents and the subsequent 10
                                                                      questions sought to understand their employment experiences. We
                                                                      received a total of 589 responses to the survey. We found that
There were 15 questions in the survey and the entire survey could     some of the responses shared the same phone numbers. Some of
be completed in 10 minutes. Please refer to Appendix for the          these entries were identical, while some were different. We do not
questionnaire. The number of questions was deliberately kept small    know why the latter happened and to ensure integrity of the
to encourage participation in the survey. It was also hoped that a    answers, we removed these responses as well as any duplicates.
shorter and concise survey would result in more accurate              This left us with a total of 568 responses. Out of 568 responses, we
responses. For the same reason, all the questions were close-         removed 59 respondents who were either: female, not from
ended, i.e. they were all multiple choice questions. This, however,   Bangladesh or India, non-WPHs, or WPHs not in the CMP sectors.
meant that some precision had to be traded off. For example,          509 responses remained, all of which were male Indian or
respondents had to select one of the salary ranges provided           Bangladeshi WPHs working in the CMP sectors.
instead of giving their exact salary.

                                                                                                                                           10
Profile of the Respondents
Profile of the
Respondents
As stated above, the focus of the study is on WPHs from The respondents are predominantly from the construction sector.
Bangladesh and India in the CMP sectors. The distribution of the In order to know whether the sectoral distribution of respondents in
509 work permit holders by country and sector is tabulated below. our survey reflects the actual percentages in Singapore, we would
need to know the actual numbers of Bangladeshi and Indian WPHs
in the individual CMP sectors. However, the latest annual statistics
on foreign workforce published by MOM shows a combined figure
Construction Marine Process Total for CMP of 311,000 as at end December 20202. The most recent
available figure for the number of construction WPHs reported by
MOM was 280,500 as at end 2018. This represented 79% of the
Bangladesh 248 (85%) 34 (12%) 8 (3%) 290 (57%) combined figure for CMP of 355,700 as at end 20183. Assuming
India 185 (85%) 29 (13%) 5 (2%) 219 (43%) that the sectoral distribution has not changed much between 2018
and 2020, it would appear that the predominance of our
433 (85%) 63 (12%) 13 (3%) 509 respondents in the construction sector squares with the reality on
the ground.
There was a similar survey conducted by TWC2 in 2016. The graph
below compares the sectoral distribution of our survey with the
previous survey.
2 https://www.mom.gov.sg/documents-and-publications/foreign-workforce-numbers
12
3 http://twc2.org.sg/2019/05/02/foreign-construction-workers-continue-to-reduce-no-improvement-in-productivity/Profile of the Respondents
Fig. 1. Distribution of respondents by sector
2016 2021
Bangladeshi Indian Bangladeshi Indian
13Profile of the Respondents
Fig. 2. Distribution of respondents by nationality
The graph here shows the nationality distribution for the
2021 and 2016 surveys. The 2021 survey had a more 2016 2021
even split between Bangladeshi and Indian respondents
in 2021. We do not know whether it reflects the national
percentages because MOM does not publish such
information. However, empirical observations through
TWC2’s communications with other NGOs and some
dormitory operators suggest that Bangladeshis and
Indians are present in approximately equal numbers. If
this is true, then the 2021 results would be a better
representation of the migrant worker population.
Of the 219 respondents in 2021 who are Indian nationals,
at least 207 are from Tamil Nadu (they responded to the
Tamil-language survey). While we have referred to this
group of 219 respondents as Indians, the reader should
note that our observations and interpretations are most
strongly applicable to migrant workers from the state of Bangladeshi Indian
Tamil Nadu in India.
14Profile of the Respondents
We grouped survey respondents into cohorts of five years based on For example, the maximum employment period of R2 workers was
their year of arrival in Singapore. Most of the respondents arrived increased from 6 to 10 years in 2012, and in 2018, the maximum
between 2006 and 2015. In fact, there is a large increase in employment period of R2 workers was increased further to 14
respondents from the 2006-2010 cohort, compared to the 2001- years, and of R1 workers from 18 to 26 years4.
2005 cohort. One possible explanation is that a lot more workers
were brought in for the construction of the integrated resorts which The low number of respondents from the 2016-2020 cohort can be
started in 2006. attributed to tightened arrivals during the Covid-19 pandemic, as
well as the reduction in CMP WPHs from 423,300 as at end-
Seen from another angle, most of the respondents have been December 2015 to 370,100 as at end-December 2019.
working in Singapore for between 6 to 15 years. In comparison,
most of the respondents in the 2016 survey had been working in The graphs below show the distribution of respondents by cohort,
Singapore for between 0 and 10 years. This is a good development as well as by their length of employment in Singapore, for the 2021
in that the workers appear to be working longer in Singapore now. and 2016 surveys.
In other words, it appears that there is less “churn” compared to a
few years ago. The progressive increase in maximum employment
period of WPHs by MOM in recent years could have contributed to
the workers working longer in Singapore.
4 R2 workers are considered basic-skilled while R1 workers are higher skilled.
15Profile of the Respondents
Fig. 3. Distribution of respondents by cohort
2016 2021
Bangladeshi Indian Bangladeshi Indian
Max employment period of Max employment period of
R1 worker = 10 years R1 worker = 14 years 16Profile of the Respondents
Fig. 4. Distribution of respondents by years in Singapore
2016 2021
Bangladeshi Indian Bangladeshi Indian
Max employment period of Max employment period of
R1 worker = 10 years R1 worker = 14 years 17Profile of the Respondents
Fig. 5. Distribution of respondents by age
This graph shows the age groups of our
respondents, with the majority belonging to the 25-
2016 2021
30 and 31-35 age groups. This is similar to the 2016
survey. However, compared to the 2016 survey, we
had significantly fewer respondents from the 18-24
age group. In the five years between the 2016 and
2021 surveys, the migrant workers in the 18-24 age
group would have aged into the 25-30 age group. In
the same period, the reduction in CMP WPH meant
that potential migrants aged 18-24 had fewer
chances to come to Singapore. The existing
workers who already had experience here held a
competitive advantage, and inexperienced
Bangladeshis and Indians would have found fewer
opportunities for a first job here.
Bangladeshi Indian
18Employment Tenure
Employment
Tenure
Fig. 6. Distribution of no. of companies worked for
In quantifying the job mobility of the workers, we asked for
the total number of companies that the workers have worked
at since their first arrival in Singapore. We wish to explain that
job mobility in this context straddle both voluntary and
involuntary changes in job. While some workers may have
voluntarily switched jobs, others may have been forced to
look for another employer, for example, when projects are no
longer available in their company, which is common in the
project-based construction sector. Our data also do not
differentiate between those who changed employers in
Singapore, and those who managed to find another job and
returned to Singapore after being repatriated.
Overall, more than 40% of respondents have worked for three
or more companies, and a two-thirds majority have worked
for two or more companies (Fig. 6)5.
5 Some respondents did not indicate how many companies they have worked for, so the total
number of respondents in the graph do not add up to 509. This may also be a feature of other 20
graphs.Employment Tenure
Fig. 7. Distribution of no. of companies worked for
The earlier the cohort, the more the number of companies
that they have worked for. This suggests that workers who
have been in Singapore for a longer period of time are likely to
have had more opportunities to transfer to other companies
over the years (Fig. 7).
21Employment Tenure
Fig. 8. Distribution of no. of companies worked for –
segmented by country and cohort
We also observed that for cohorts 2011-2015 and 2016-2021,
a larger proportion of Bangladeshi respondents have worked
at 2-4 companies compared to Indian respondents. This may
be because Bangladeshi respondents have a lower mean
starting salary compared to their Indian peers (Fig. 15)), and
so could have changed jobs more frequently to get salary
increments.
Bangladeshi Indian
22Employment Tenure
From data collected on the number of companies the respondents A possible explanation can be found in a policy change in 2015,
have worked for, we calculated the proportion of respondents who where WPHs in the construction sector were allowed to change
are currently working in their first job since they first came to employers at the end of their work permit term, if they were not
Singapore. Our study has found that less than one-third of the able to come to mutual agreement with their employer on the
respondents are currently working in their first job, suggesting that renewal of their work permit. In 2017, the same flexibility was given
most respondents have opportunities to switch to other to WPHs in the process sector. The implications of this policy can
companies. In contrast, a similar study done by TWC2 in 2016 be seen from how in the second half of 2020, 20% of workers with
found that two-third of respondents were in their first job since they expiring work permits were transferred to new employers6. The
first came to Singapore (Fig. 9). This difference is not merely a introduction of this policy can hence possibly account for the
result of the pandemic because only about 25% of respondents not difference between the findings in 2016 and 2021.
working in their first job changed their job in the past year (Fig 10).
6 http://twc2.org.sg/2021/04/06/nearly-8000-foreign-construction-workers-had-permits-cancelled-close-to-expiry-date/
23Employment Tenure
Fig. 9. Distribution of respondents in first job, segmented by country
2016 2021
Bangladeshi Indian Bangladeshi Indian
24Employment Tenure
Fig. 10. Current tenure of people NOT in first job
Only about 25% of respondents not in their first jobs have been in
their current jobs for less than a year. This suggests that job
change in the pandemic was not the sole reason for the distribution
of respondents in their first job (Fig. 9).
Bangladeshi
Indian 25Employment Tenure
Fig. 11. Distribution of respondents in first job, segmented by
country and cohort
When analysed by cohort, the same trend (i.e. that more have
changed jobs than those who have not) is observed except
for Indian respondents in the most recent cohort (Fig. 11).
Since they arrived most recently, it is reasonable that many
have remained in their first job since they are more unlikely to
have been presented with opportunities to switch companies
compared to those who have been here for a longer time.
This also corresponds with the earlier observation that fewer
Indian respondents than Bangladeshi respondents have
switched companies.
Bangladeshi Indian 26Employment Tenure
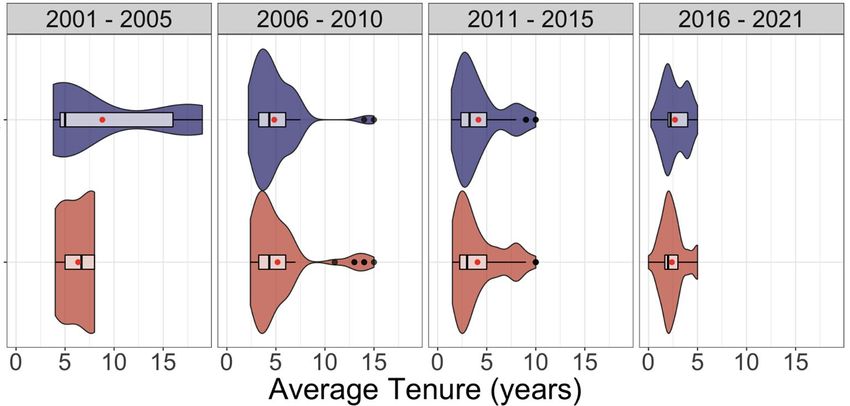
Based on the year that a worker first arrived in Singapore, we calculated the average employment tenure for each respondent by dividing a worker’s
total employment tenure in Singapore by the number of companies he has worked at. Across all respondents, the mean average tenure was 4.2 years
per company a worker has worked at. The mean average tenure is shortest for the most recent cohorts and longest for the earliest cohorts. A point to
note is the distribution of respondents in the 2001-2005 cohort – there is a rather large disparity between the two nationalities which could be because
there were only 5 Bangladeshi respondents in that cohort.
Fig. 12. Distribution of average tenure, segmented by country and cohort
27
Bangladeshi IndianEmployment Tenure
In a crossplot of the number of companies a worker has worked for against the total number of years he has spent in Singapore, the mean average
tenure can be plotted as a straight line. Please see the graphs below. Since most data points lie below this line, the mean average tenure is mostly an
underestimate, i.e. most people work at a job for longer than 4.2 years. This mean average tenure is shorter than most respondents’ average tenure due
to a group of Bangladeshi respondents who worked in many companies during their short stay in Singapore, represented in the crossplot by the data
points lying above the mean average tenure line. This corresponds to our earlier observation that more Bangladeshi respondents have worked at 3 or 4
different jobs compared to Indian respondents.
Fig. 13. Comparison of mean average tenure to actual data, segmented by country and cohort
28
Bangladeshi IndianEmployment Tenure
Fig. 14. Tenure of the respondents in first job, comparison to
mean average tenure of 4.2 years
Of the respondents still in their first job, there is a fairly even
split between those who have either worked for longer (56%)
or shorter (44%) than the mean average tenure (Fig. 14). This
would suggest, in addition to most respondents having some
degree of job mobility, that those who are in their first job
have some job stability comparable to other respondents. In
other words, foreign workers who are in their first job in
Singapore are not being held in the job for an excessive
period of time, nor are they leaving their first job after only a
very short period of time. The main assumption is that
reduced migrant inflows during the pandemic have not
significantly affected this distribution. It is possible that if
migrant inflows were normal, we may find a very large
proportion below the mean average tenure.
29Salary
Salary                                                           Fig. 15. Distribution of starting   Fig. 16. Distribution of current
                                                                 salary, segmented by country        salary, segmented by country

The economic opportunities in Singapore constitute one of
the motivating factors for many foreign workers arriving here.
By extension, foreign workers’ wages and wage growth
constitute an important area of investigation. The results of
our survey show that Bangladeshi respondents reported a
lower mean starting basic salary when compared to Indian
respondents (Fig. 15). Bangladeshi respondents also
reported a lower mean current basic salary compared to
Indian respondents (Fig. 16).

                                                                    Bangladeshi           Indian                                    31

                                                                   mean                 median
Salary
The starting basic salary of each cohort adjusted for CPI has decreased gradually from 2000 to the present. In contrast, the construction sector GDP
and productivity have increased in the same time period (Fig. 17). This is a worrying trend, because it essentially suggests that the workers’ salaries do
not increase in accordance with their productivity.
Fig. 17. Evolution of starting basic salary against GDP and productivity in construction sector7
7 http://twc2.org.sg/2021/04/06/nearly-8000-foreign-construction-workers-had-permits-cancelled-close-to-expiry-date/ &
https://www.bca.gov.sg/EmailSender/BuildSmart-052012/microsite/measuring-overall-productivity.shtml 32Salary
We defined the basic salary increment as the difference between the starting and the current basic salary. The mean basic salary increment for
Bangladeshi and Indian respondents in the 2021 survey is slightly higher than in the 2016 survey. This can be attributed to pay increments earned by a
migrant worker population that has more work experience in general, keeping in mind that new migrant workers are having fewer opportunities to find a
first job in Singapore. The difference between the mean basic salary increment of the different nationalities is not statistically significant i.e. below 95%
confidence level.
Fig. 18. Mean basic salary increments, segmented by country, in 2016 and 2021
2016 2021
33
Bangladeshi IndianSalary
Fig. 19. Distribution of basic salary increment, segmented by the no. of
companies worked for
Respondents who have worked for more companies reported
higher mean basic salary increments. In the previous section,
we observed that Bangladeshi respondents changed jobs
more frequently than the Indian respondents. Connecting it
with the wage data, this suggests that Bangladeshi
respondents tend to change jobs more frequently in order to
win salary increments from their lower base salary. In
contrast, we observed that Indian respondents start at a
higher mean basic salary, change jobs less frequently on
average, stay working in Singapore for longer on average, and
have a higher mean current salary.
34Salary
Fig. 20. Distribution of current basic salary, segmented by cohort
Current basic salary increases with the amount of time spent
in Singapore (Fig. 20).
An additional observation from Fig. 20 and Fig. 21 show that
there are some workers who report surprisingly low wages
and no increments even after working for 20 years in
Singapore.
35Salary
Fig. 21. Distribution of basic salary increment, segmented by cohort
Basic salary increments are also directly proportionate to the
length of time spent in Singapore (Fig. 21). Respondents’
salary increments increased the fastest for those who have
worked in Singapore between 0 - 15 years. In contrast, those
who have worked beyond 15 years have slower increases in
salary increments.
36Salary
Fig. 22. Distribution of basic salary increment, plotted against average
Respondents’ average tenure is positively correlated with tenure (in years)
their reported basic salary increment. However, based on the
dispersion of the data, this relationship is not particularly
strong. The positive gradient of the trendline, however,
reveals that the total tenure is a more important factor than
the number of companies worked for.
37Salary
Fig. 23. Distribution of basic salary increment, plotted against starting
Higher starting basic salaries are correlated with lower basic basic salary
salary increments. However, this is not a principal factor that
explains wage growth, because it only explains for a $100 -
200 difference in basic salary increment, and not the wider
distribution of increments up to $650.
To sum up, work experience in Singapore has the highest
correlation with higher wages. Changing employers is a
supporting factor to wage growth. More recent cohorts are
being paid less in real wages than the cohorts who arrived in
Singapore earlier.
38Recruitment Fees
Recruitment
Fees
Fig. 24. Distribution of recruitment fees, segmented by country
Comparing the median recruitment fees paid by the
respondents by nationality, Bangladeshi respondents
reported a higher median recruitment fees of $6000
compared to Indian respondents, who paid a median
recruitment fee of $2000 (Fig. 24).
40
Bangladeshi Indian
mean medianRecruitment Fees
Fig. 25. Evolution of mean recruitment fees over time, adjusted for
To compare recruitment fees paid by the workers over time, inflation
we analysed the data collected from this survey alongside the
results collected in 2012 from a TWC2 study in 20128 and
those collected from another TWC2 study in 20169. Each
survey found that recruitment fees have been rising gradually
across time from 2000 to 2020 (Fig. 25).
8 http://twc2.org.sg/2012/08/12/worse-off-for-working-kickbacks-intermediary-fees-and-migrant-
construction-workers-in-singapore/ 41
9 http://twc2.org.sg/2017/02/05/average-recruitment-cost-hit-15000-in-2015-for-first-time-bangladeshi-
construction-workers/Recruitment Fees
We also sought to calculate the duration that the workers would need to recover the amount spent on their recruitment fees. A worker’s “recovery
period” is hence defined as the recruitment fee that a worker has paid divided by his starting basic monthly salary. Based on the recruitment fees and
starting basic salaries reported, Bangladeshi respondents have a higher median recovery period compared to Indian respondents (Fig. 26). The earlier
section on salary found that Bangladeshi respondents earned relatively less. Yet, they paid higher recruitment fees than Indian workers. All these paint a
picture of a financial journey that is increasingly difficult for the workers, especially for the more recent cohorts of Bangladeshi workers.
Fig. 26. Distribution of recovery period, segmented by country
Bangladeshi Indian 42
mean medianRecruitment Fees
Fig. 27. Distribution of respondents reporting salary or injury issues,
Incidentally, Bangladeshi respondents were twice as likely as segmented by country
Indian respondents to encounter salary or injury issues (Fig.
27). While we do not know the specifics of these cases, this
would certainly add another element of financial stress.
43
Bangladeshi IndianRecruitment Fees
Fig. 28. Evolution of recovery period over time
Lastly, we calculated the average recovery periods for
different cohorts of workers arriving through the years. With
increasing recruitment fees and decreasing starting basic
salaries over time, the average recovery period for successive
cohorts has steadily risen from about 6.5x their monthly basic
salary for the 2000-2005 cohort to the current 11x of their
monthly basic salary for the 2016-2020 cohort.
44Conclusion
Conclusion

This study has uncovered a couple of positive developments but        There have been policy changes made by MOM in recent years to
also several negative ones concerning the employment of               provide a little more flexibility for workers to change employers and
Bangladeshi and Indian WPH in the CMP sectors. One positive           increase the maximum period that WPHs can work in Singapore.
development is that the workers appear to experience higher job       These policy changes may have contributed to these
mobility now than several years ago, as seen from the significant     developments. When thinking about future policy it is also
increase in the proportion of respondents who are not in their        important to consider the implications associated with an aging
current job, compared to the proportion from a similar study          migrant population especially the need for comprehensive
conducted in 2016. We have interpreted this as a positive             healthcare plans.
development but it would be useful to investigate the various
circumstances under which the workers have changed jobs, for          On negative developments, one is that the starting basic salary of
example, whether the change in employment was voluntary,              successive cohorts of the workers adjusted for CPI has been
whether it was borne out of necessity because no more work was        decreasing, despite the increase in construction sector GDP and
available at their current company, and so on.                        productivity over the same period. Increases in levy rates could
                                                                      have had a negative impact on the wages of the workers but more
Another positive development is that the workers are staying longer   research would need to be done. We may also need to look at the
in Singapore, which is good for the individual as well as CMP         total wages of the workers, which may tell a different story.
sectors.

                                                                                                                                           46
Conclusion
On a related point, the starting monthly salary of Bangladeshi One likely reason why recruitment fees are much higher now is that
workers was found to be generally lower than that of Indian there are fewer jobs in Singapore, and existing workers in
workers. This is likely the reason why the Bangladeshi respondents Singapore are preferred by employers to new workers. So
tended to change jobs more frequently. It may be useful to Bangladeshi and Indian migrants wishing to find new work in
investigate the disparity between the starting salaries of Singapore are being charged higher recruitment fees. One thing
Bangladeshi and Indian workers. that should be worth exploring, is whether there is profiteering
involved - exploitation of the situation by employment agents - or
Another negative development is the increase in recruitment fees perhaps the extent of it.
paid by successive cohorts of the workers. This finding
corroborated the TWC2 studies done in 2012 and 2016, and The higher recruitment fees will inevitably affect the well-being of
showed that the worrying trend appears to be continuing. The the workers. Arriving in Singapore heavily indebted, they will
recovery period - which we define as the recruitment fees divided invariably face higher financial stress and become more vulnerable
by the basic starting monthly salary - has thus been increasing for to the demands of the employers. A key theme that is presented is
workers who arrived more recently. Bangladeshi workers faced a that when compared to Indian workers, Bangladeshi workers are
double whammy - their mean starting monthly salary is lower than the most vulnerable in terms of their conditions and the possibility
their peers from India, and they paid significantly higher of problems they may face.
recruitment fees to come to Singapore.
47Appendix
Appendix 1: English Questionnaire

Questionnaire description:                                               3. Where are you from?

We would like to know more about your job experience in                  О Bangladesh     О Cambodia          О China          О India
Singapore. The survey won't capture your name or contact address,
so your information is safe with us. There are 15 questions and it       О Indonesia      О Malaysia          О Myanmar        О Nepal
will take about 5 minutes to fill. All questions are mandatory. Please
                                                                         О Philippines    О Sri Lanka         О Thailand       О Vietnam
answer all and click submit.
                                                                         О Other
Section 1: About you
                                                                         4. Which pass are you holding?
1. What is your gender
                                                                         О Work Permit    О S Pass            О Special Pass
О Male            О Female          О Prefer not to say
                                                                         О EP             О Other
2. How old are you?
                                                                         5. What sector are you working in?
О 24 or younger О 25-30             О 31-35
                                                                         О Cleaning       О Construction О Landscaping
О 36-40           О 41 or older

                                                                                                                                           49
Appendix 1: English Questionnaire
О Manufacturing О Marine О Process 8.What was your monthly basic salary (in Singapore currency) for
your first job in Singapore? (Basic salary excludes overtime pay and
О Services О Others bonuses)
О Less than $500 О $500 to $599 О $600 to $699
Section 2: About your employment experiences О $700 to $799 О $800 to $899 О $900 to $999
6. When did you come to Singapore? О $1000 to $1199 О $1200 to $1499 О $1500 to $1999
7. How much did you pay your first agent to come to Singapore? О $2000 to $2999 О $3000 or above
О I did not pay any agent О Less than $1000 9. Since coming to Singapore, how many companies have you
worked for?
О Between $1000 to $2999 О Between $3000 to $4999
О1 О2 О3 О4
О Between $5000 to $6999 О Between $7000 to $9999
О5 О 6 or more
О $10000 or above
50Appendix 1: English Questionnaire
10. How much time have you spent at home, on leave, or between О Less than $500 О $500 to $599 О $600 to $699
jobs?
О $700 to $799 О $800 to $899 О $900 to $999
О Less than 6 months О 6-11 months
О $1000 to $1199 О $1200 to $1499 О $1500 to $1999
О 1 year to 23 months О 2 years to 35 months
О $2000 to $2999 О $3000 or above
О 3 years or more
13. Have you gotten a pay raise in your current company?
11. How long have you been in your current company? (select the
closest answer) О Yes О No
О 6 months О 1 year О 1 year and 6 months 14.Are you consistently paid by your current employer?
О 2 years О 2 years and 6 months О 3 years О Yes О No
О 3 years and 6 months О 4 years 15. Have you ever filed a salary or injury claim in the past?
О 4 years and 6 months О 5 years О Other О Yes О No
12. What is your monthly basic salary (in Singapore currency) now -
in your current company? (Basic salary excludes overtime pay and 51
bonuses)Appendix 2: Tamil Questionnaire
Questionnaire description: Section 1: About you
�ங் கப் �ரில் உங் கள் ேவைல அ�பவம் பற் � 1. உங் கள் பா�னம்
நாங் கள் ேம�ம் அ�ய ��ம் ��ேறாம் . இந்தக்
கணக்ெக�ப் �ல் உங் கள் ெபயர் மற் �ம் О ஆண் О ெபண்
�கவரி �வரங் கள் ப�� ெசய் யப் பட�ல் ைல.
О ப�லளிக்க ��ம் ப�ல் ைல
உங் கள் தகவல் கள் பா�காப் பாக
ைவத்��க்கப் ப�ம் . ப�வத்�ல் 15 �னாக்கள் 2. உங் கள் வய�
உள் ளன. இவற் ைற நிைற� ெசய் ய �மார் 5
நி�டங் கள் ��க்�ம் . அைனத்�க் О 24 அல் ல� அதற் �ம் �ைற�
ேகள் �க�க்�ம் �ைடயளிப் ப� கட்டாயம் .
உங் கள் �ைடகள் அைனத்ைத�ம் �ர்த்� О 25-30 О 31-35 О 36-40
ெசய் த�ன் "சமர்ப்�க்க�ம் " என்பைதக் �ளிக்
О 41 அல் ல� அதற் �ம் ��தல்
ெசய் ய�ம் .
3. நீ ங் கள் எந்த நாட்ைடச் ேசர்ந்தவர்?
* ேதைவயான �வரம்
О பங் களாேதஷ் О கம் ேபா�யா
52Appendix 2: Tamil Questionnaire
О �னா О இந்�யா О இந்ேதாேன�யா О ேதாட்டத்�ைற О உற் பத்�த் �ைற
О மேல�யா О �யான்மர் О ேநபாளம் О கப் பல் �ைற О ெசயல் �ைறத்�ைற
О ��ப் ைபன்ஸ் О ��ப் ைபன்ஸ் О ேசைவத் �ைற О Others
О தாய் லாந்� О �யட்நாம்
О Other Section 2: About your employment experiences
4. எந்த �தமான பணி அ�ம� அட்ைட 6. நீ ங் கள் �தன்�தலாக �ங் கப் �ர் வந்த
ைவத்�ள் ளர ீ ்கள் ? வ�டம் எ�?
О ஒர்க் பர்�ட் О S பாஸ் О ஸ்ெபஷல் பாஸ் 7. �ங் கப் �ர் ேவைலக்காக உங் கள் �தல்
ேவைல �கவ�க்� எவ் வள� பணம்
О இ. � (EP) О Other ெகா�த்�ர்கள் ?
5. நீ ங் கள் எந்தத் �ைற�ல் பணி�ரி��ர்கள் ? О �கவர் எவ�க்�ம் பணம் ெகா�க்க�ல் ைல
О �ப் �ர�த்�ைற О கட்�மானத் �ைற О 1000 ெவள் ளிக்�ம் �ைறவாக
53Appendix 2: Tamil Questionnaire
О 1000 ெவள் ளி �தல் 2999 ெவள் ளி வைர О 900 �தல் 999 ெவள் ளி О 1000 �தல் 1199 ெவள் ளி
О 3000 ெவள் ளி �தல் 4999 ெவள் ளி வைர О 1200 �தல் 1499 ெவள் ளி О 1500 �தல் 1999 ெவள் ளி
О 5000 ெவள் ளி �தல் 6999 ெவள் ளி வைர О 2000 �தல் 2999 ெவள் ளி
О 7000 ெவள் ளி �தல் 9999 ெவள் ளி வைர О 3000 ெவள் ளி அல் ல� அதற் �ம் ��தல்
О 10,000 ெவள் ளி அல் ல� அதற் �ம் ��தல் 9. �ங் கப் �ர் வந்த���ந்� நீ ங் கள் எத்தைன
நி�வனங் களில் ேவைல ெசய் ��க்��ர்கள் ?
8. �ங் கப் �ரில் உங் கள் �தல் ேவைல�ன்
அ�ப் பைட மாதச் சம் பளம் என்ன? (ஓவர் ைடம் О1 О2 О3 О4
மற் �ம் ேபானஸ் த�ர்த�)
О5 О 6 அல் ல� அதற் �ம் ேமல்
О 500 ெவள் ளிக்�ம் �ைற�
10. ���ைற அல் ல� ேவைல மாற் ற
О 500 �தல் 599 ெவள் ளி О 600 �தல் 699 ெவள் ளி இைடெவளி�ல் எத்தைன காலம் உங் கள்
�ட்�ல் தங் ��ள் ளர
ீ ்கள் ?
О 700 �தல் 799 ெவள் ளி О 800 �தல் 899 ெவள் ளி
О 6 மாதங் க�க்�ம் �ைறவாக
54Appendix 2: Tamil Questionnaire
О 6 �தல் 11 மாதங் கள் 12. இப் ேபா� பணி�ரி�ம் நி�வனத்�ல் உங் கள்
தற் ேபாைதய அ�ப் பைட மாதச் சம் பளம் என்ன?
О 12 �தல் 23 மாதங் கள் О 24 �தல் 35 மாதங் கள் (ஓவர் ைடம் மற் �ம் ேபானஸ் த�ர்த�)
О 3 வ�டங் கள் அல் ல� அதற் � ேமல் О 500 ெவள் ளிக்�ம் �ைறவாக
11. தற் சமயம் பணி�ரி�ம் நி�வனத்�ல் நீ ங் கள் О 500 �தல் 599 ெவள் ளி О 600 �தல் 699 ெவள் ளி
எத்தைனக் காலமாக ேவைல�ல்
இ�க்��ர்கள் ? (ெந�க்கமான �ைடையத் О 700 �தல் 799 ெவள் ளி О 800 �தல் 899 ெவள் ளி
ேதர்� ெசய் �ங் கள் )
О 900 �தல் 999 ெவள் ளி О 1000 �தல் 1199 ெவள் ளி
О 6 மாதங் கள் О 1 வ�டம்
О 1200 �தல் 1499 ெவள் ளி
О 1 வ�டம் 6 மாதங் கள் О 2 வ�டங் கள்
О 1500 �தல் 1999 ெவள் ளி
О 2 வ�டம் 6 மாதங் கள் О 3 வ�டங் கள்
О 2000 �தல் 2999 ெவள் ளி
О 3 வ�டம் 6 மாதங் கள் О 4 வ�டங் கள்
О 3000 ெவள் ளி அல் ல� அதற் � ேமல்
О 4 வ�டம் 6 மாதங் கள் О 5 வ�டங் கள்
О Other 55Appendix 2: Tamil Questionnaire
13. இப் ேபா� ேவைல ெசய் �வ�ம் நி�வனத்�ல்
உங் க�க்�ச் சம் பள உயர்� �ைடத்�ள் ளதா?
О ஆமாம் О இல் ைல
14. தற் ேபாைதய நி�வனம் உங் க�க்�த்
ெதாடர்ந்� சம் பளம் ெகா�த்� வ��றதா?
О ஆமாம் О இல் ைல
15. கடந்த காலத்�ல் எப் ெபா�தாவ� நீ ங் கள்
சம் பளம் அல் ல� ேவைல�டக்
காயங் க�க்காக ேகாரிக்ைக
ெசய் ��க்��ர்களா?
О ஆமாம் О இல் ைல
56Appendix 3: Bengali Questionnaire
Questionnaire description: О জানােত চান না (Prefer Not to Say)
িস�াপুের আপনার কােজর অিভ�তার স�ে� আমরা আেরা 2. আপনার বয়স কত? েয েকান এক�ট েবেছ িনন।
জানেত চাই
О ২৪ বছর বা তার েচেয় কম
এই সােভ��ট করেল আপনার নাম বা েযাগােযােগর �ঠকানা
�কাশ পােব না, তাই আপনার সব খবর আমােদর কােছ О ২৫-৩০ О ৩১-৩৫ О ৩৬-৪০
সুরি�ত।
О ৪১ বছর বা তার েবিশ
*�েয়াজন
3. আপনার েদশ েকাথায় . েয েকান এক�ট েবেছ িনন
�থম ���ট আপিন এিড়েয় েযেত পােরন
О বাংলােদশ О কাে�ািডয়া О চীন О ভার
েয েকান এক�ট েবেছ িনন
О ইে�ােনিশয়া О মালয়িশয়া О িময়ানমার
Section 1: About you О েনপাল О িফিলিপ� О �ল�া
1. আপনার িল� িক? О থাইল�া� О িভেয়তনাম О অন�ান�
О পুংিল� (Male) О �ীিল� (Female)
57Appendix 3: Bengali Questionnaire
4. আপিন েকান পােসর ধারক. েয েকান এক�ট েবেছ িনন
О ওয়াক� পারিমট О এস্ পাস О ে�শাল পাস Section 2: About your employment experiences
О ই.িপ О অন�ান� 6. আপিন কেব �থম এেসেছন িস�াপুের? েয েকান এক�ট
েবেছ িনন
5. আপিন েকান িবভােগ কাজ কেরন? েয েকান এক�ট েবেছ
িনন 7. িস�াপুের আসার জেন� আপিন আপনার �থম এেজ�েক
কত টাকা িদেয়িছেলনেয েকান একটা েবেছ িনন
О ি�িনং (Cleaning) О ক��াকশন (Construction)
О আিম েকান টাকা িদইিন এেজ�েক
О ল�া�ে�িপং (Landscaping) О ১০০০$ এর কম О ১০০০-২৯৯৯$
О ম�ানুফ�াকচারীং (Manufacturing) О ৩০০০-৪৯৯৯$ О ৫০০০-৬৯৯৯$
О েমিরন (Marine) О সািভ�স (Service) О ৭০০০-৯৯৯৯$ О ১০,০০০$ এর েবিশ
О �েসশ (Process) О অন�ান�
58Appendix 3: Bengali Questionnaire
8. িস�াপুের �থম কােজ আপনার েবিসক মািসক েবতন ( 10. আপিন বাড়ীেত, ছ��টেত অথবা দুই�ট কােজর মােঝ কত সময়
িস�াপুেরর টাকার অে�) কত িছল? ( ওভার টাইম আর েবানাস কা�টেয়েছন? েয েকান এক�ট েবেছ িনন
বাদ িদেয় েবিসক েবতন)েয েকান একটা েবেছ িনন
О ৬ মােসর কম О ৬-১১ মাস
О ৫০০$ এর কম О ৫০০-৫৯৯ О ৬০০-৬৯৯
О ১বছর-২৩ মাস О ২বছর-৩৫ মাস
О ৭০০-৭৯৯ О ৮০০-৮৯৯ О ৯০০-৯৯৯
О ৩বছেরর েবিশ
О ১০০০-১১৯৯ О ১২০০-১৪৯৯ О ১৫০০-১৯৯৯
11. আপিন আপনার বত�মান েকা�ানীেত কতিদন কাজ
О ২০০০-২৯৯৯ О ৩০০০$ এর েবিশ করেছন? ( িনকটতম উ�র�ট েবেছ িনন)
9. িস�াপুের আসার পর েথেক আপিন কয়�ট েকা�ানীেত О ৬ মাস О ১ বছর О ১ বছর ৬ মাস
কাজ কেরেছন? েয েকান এক�ট েবেছ িনন
О ২ বছর О ২ বছর ৬ মাস О ৩ বছর
О১ О২ О৩ О৪
О ৩ বছর ৬ মাস О ৪ বছর О ৪ বছর ৬ মাস
О৫ О ৬এর েবিশ
О ৫ বছর О অন�ান�
59Appendix 3: Bengali Questionnaire
12. বত�মান েকা�ানীেত আপনার েবিসক মািসক েবতন ( 14. আপনার বত�মান িনেয়াগকত�া আপনােক িনয়িমত েবতন েদন?
িস�াপুেরর টাকার অে�) কত? ( েবিসক েবতন মােন ওভার েয েকান এক�ট েবেছ িনন
О ৫০০$ এর কম О ৫০০-৫৯৯$ О হ�াঁ О না
О ৬০০-৬৯৯$ О ৭০০-৭৯৯$ 15. অতীেত কখেনা িক আপিন েবতন বা েকান আঘােতর দাবী (
injury claim) কেরেছন? েয েকান এক�ট েবেছ িনন
О ৮০০-৮৯৯$ О ৯০০-৯৯৯$
О হ�াঁ О না
О ১০০০-১১৯৯$ О ১২০০-১৪৯৯$
О ১৫০০-১৯৯৯$ О ২০০০-২৯৯৯
О ৩০০০$ এর েবিশ
13. বত�মান েকা�ানীেত িক কখেনা আপনার েবতন েবেড়েছ?
েয েকান এক�ট েবেছ িনন
О হ�াঁ О না
60Mar-Sep 2021
You can also read