January 2022 Investor Presentation - Advancing Simplification, Pivoting to Growth
←
→
Page content transcription
If your browser does not render page correctly, please read the page content below

Advancing Simplification,
   Pivoting to Growth

    January 2022
Investor Presentation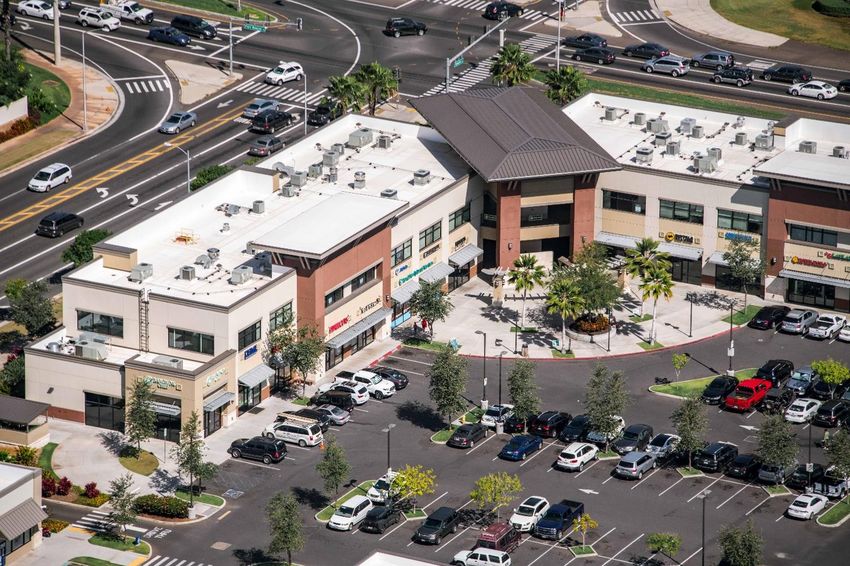
SAFE
                       Statements in this presentation that are not historical facts are forward-looking
                       statements within the meaning of the Private Securities Litigation Reform Act of 1995
                       that involve a number of risks and uncertainties that could cause actual results to differ

    H ARBO R           materially from those contemplated by the relevant forward-looking statements.

                       These forward-looking statements include, but are not limited to, statements regarding

    ST AT E ME N T     possible or assumed future results of operations, business strategies, growth
                       opportunities and competitive positions, as well as the rapidly changing challenges with,
                       and the Company's plans and responses to, the novel coronavirus (COVID-19) pandemic
                       and related economic disruptions. Such forward-looking statements speak only as of
                       the date the statements were made and are not guarantees of future performance.
                       Forward-looking statements are subject to a number of risks, uncertainties,
                       assumptions and other factors that could cause actual results and the timing of certain
                       events to differ materially from those expressed in or implied by the forward-looking
                       statements. These factors include, but are not limited to, prevailing market conditions
                       and other factors related to the Company's REIT status and the Company's business,
                       risks associated with COVID-19 and its impacts on the Company's businesses, results of
                       operations, liquidity and financial condition, the evaluation of alternatives by the
                       Company related to its materials and construction business and by the Company's joint
                       venture related to the development of Kukui‘ula, generally discussed in the Company's
                       most recent Form 10-K, Form 10-Q and other filings with the SEC. The information in
                       this presentation should be evaluated in light of these important risk factors. We do not
                       undertake any obligation to update the Company's forward-looking statements.

Partners for Hawai‘i                                                               Alexander & Baldwin I NYSE: ALEX   2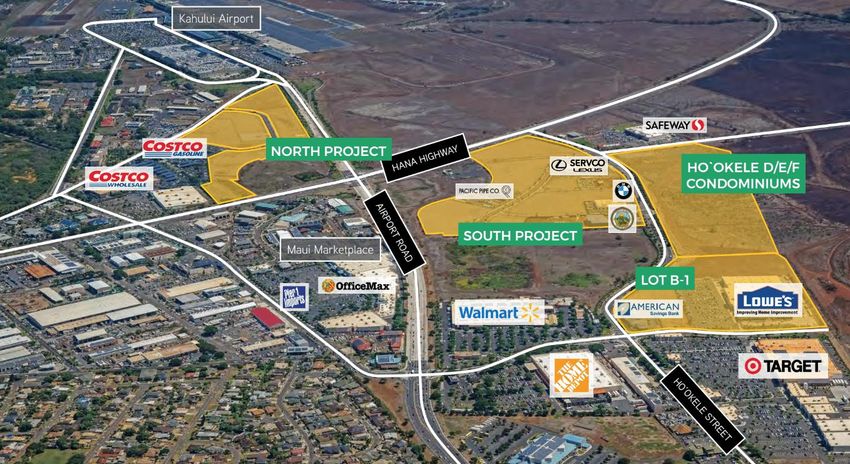
SUPERIOR
                       MARKET FUNDAMENTALS
                       Dynamic, Growing Market with
                       Structural Limitations on New Supply

                       HIGH-QUALITY

ADVANCING
                       PORTFOLIO
                       Irreplaceable Assets with
                       Embedded Growth Opportunities
SIMPLIFICATION,
PIVOTING TO            SIMPLIFICATION
                       NEARING COMPLETION

GROWTH                 Facilitates Pivot Back to CRE Investments

                       STRONG
                       BALANCE SHEET
                       Supports Accelerated Investment Activity

                       COMMITMENT TO
                       CORPORATE RESPONSIBILITY
                       Significant Progress in ESG Initiatives in
                       Recent Years

Partners for Hawai‘i
             Hawai’i                    Alexander & Baldwin I NYSE: ALEX   3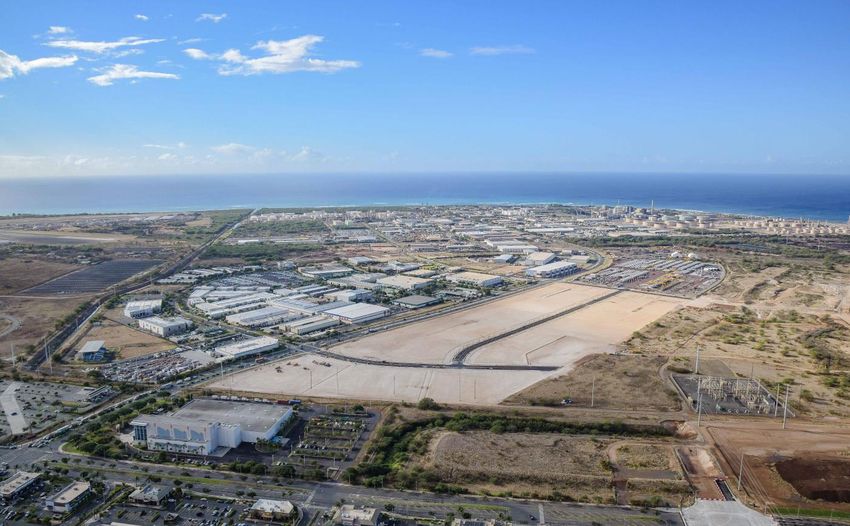
High Retail and Industrial Performance
                                                              Due to Market Factors

     DYNAMIC MARKET WITH
     SUBSTANTIAL BARRIERS TO ENTRY
                                                              Fundamentals Drive                           $33.09                    vs              $20.35
                                                              Performance: Q3 2021                           A&B Retail                              Peer Average
                                                                                                              ABR PSF                                 Retail ABR
                                                                                                                                                         PSF

     H AWAI‘I MARKE T :                                       Source: Green Street Advisors and
                                                              Company disclosures; comparative
                                                              data set represents strip retail and          $15.13                   vs               $8.25
     SUP E RIO R LO N G -TERM
                                                              industrial REITs under Green Street          A&B Industrial                             Peer Average
                                                              coverage.
                                                                                                             ABR PSF                                 Industrial ABR
                                                                                                                                                          PSF

     FUN D AME N TALS                                                                                                          $797
                                                                                                                   A&B Full-Year 2020 Average
                                                                                                                   Traditional Grocer Sales PSF

Strong Consumer Demand                                        Supply Constraints
Due to Favorable Market Metrics                               Due to Long Entitlement Process

   5-Year Hawai‘i
        Forecasts                 2.8%           3.0%          Lengthy &
                                                                 Complex                             3-5               3-5                                 3-5
   (Growth Rates                                              Entitlement
                                 JOB GROWTH   INCOME GROWTH                                     YEARS FOR          YEARS FOR                      YEARS FOR
      Annualized;                                                 Process
                                                                                                 COUNTY            STATE LAND                      COUNTY
    Rankings 1-50
                                                                                                 GENERAL           USE URBAN                    URBAN ZONING
with 1 being best)
                                   #3             #4                                              PLAN            DESIGNATION
                                                                                                INCLUSION
                                   RANK IN        RANK IN

Source: Green Street Advisors.
                                 JOB GROWTH
                                  OUT OF 50
                                              INCOME GROWTH
                                                 OUT OF 50                                                  9 to 15 years
   Partners for Hawai‘i                                                                                           Alexander & Baldwin I NYSE: ALEX     4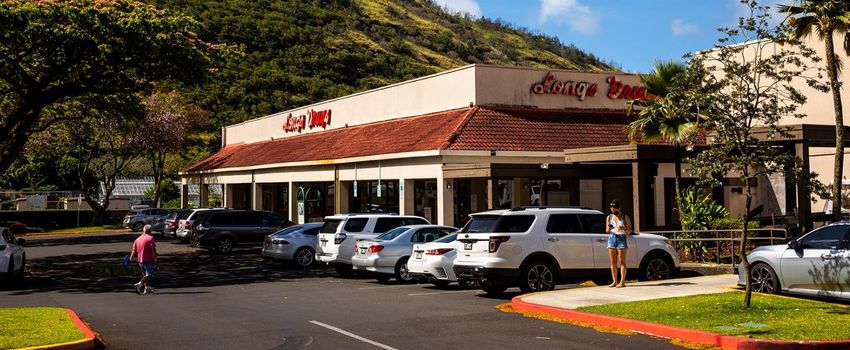
KAUAI                    OAHU

 I R R E P L A C E A B L E                  A S S E T S

O UT ST AN DIN G
  P O R T FO L IO
                                                                                                                                         MAUI

     Strategically located portfolio of
 high-quality, needs-based retail, industrial
         and ground lease assets                                $104.2M                                                                                  HAWAI‘I ISLAND

 Largest portfolio of grocery-anchored,                      Total NOI (2019; Pre-COVID)                                OAHU
neighborhood shopping centers in Hawai‘i                                                                                Hawai‘i GDP2 I 74%
                                                                                                                        Q3 2021 NOI I 70%

                                                                $94.3M
    The “one-stop shop” for new market
     entrants with both retail and light
        industrial/distribution needs                                                                                   MAUI
                                                                  Total NOI (2020)                                      Hawai‘i GDP2 I 11%
 High-performing market with compelling
           growth opportunities                                                                                         Q3 2021 NOI I 13%
• Many retail chains’ top-performing stores

                                                                 $28.1M
   are in Hawai‘i (e.g., Sam’s Club, Safeway,                                                                           OTHER ISLANDS
  Home Depot and California Pizza Kitchen)
                                                                                                                        Hawai‘i GDP2 I 15%
• 32%1 of nation’s top-25 retailers and QSRs                     Total NOI (Q3 2021)                                    Q3 2021 NOI I 17%
    do not currently have any operational
               Hawai‘i locations
                                                                                                                        2: Per State of Hawai‘i DBEDT data.

  1: Per QSR Magazine and National Retail Federation data.        Note: See appendix for a statement on management’s use of non-GAAP financial measures and reconciliations.
  Partners for Hawai‘i                                                                                                                      Alexander & Baldwin I NYSE: ALEX   5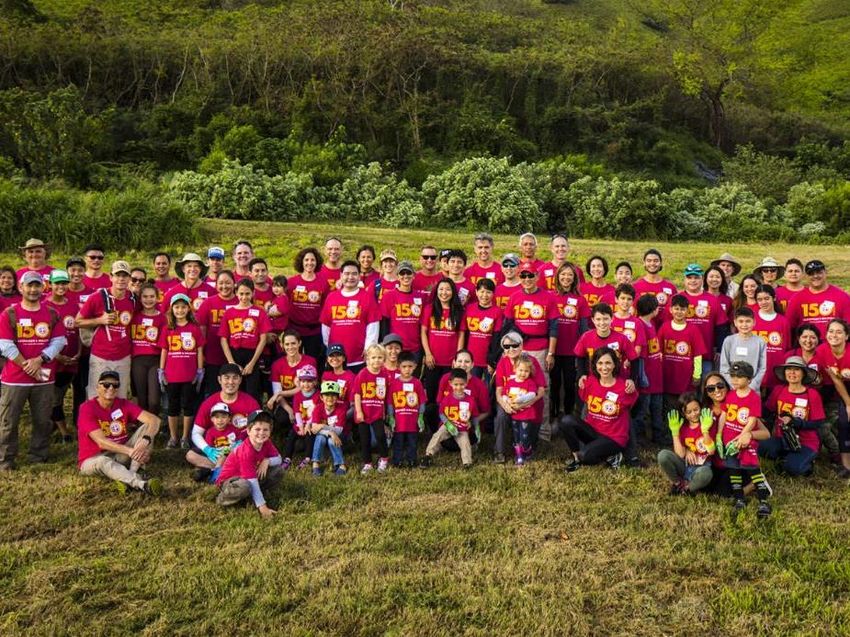
Return of 10%                                 Return of 11%                                     Estimated return
                        on repositioning                              on repositioning                                  of 9% on
                        capital spent and                             capital spent and                                 repositioning
                        current leased                                current leased                                    capital spend and
                        occupancy of                                  occupancy of                                      current leased
                        99.8%.                                        100%.                                             occupancy of
                                                                                                                        94.0%.

                                                                                                         AIKAHI PARK
 PEARL HIGHLANDS CENTER                                   LAU HALA SHOPS                             SHOPPING CENTER
       Refresh of Asset and                                    Reversion of                        Reversion of Ground Lease Asset,
        Effective Leasing                                   Ground Lease Asset                    Redevelopment of Aging Asset and
                                                                                                           GLA Expansion

IRREPLACEABLE ASSETS WITH EMBEDDED GROWTH UPSIDE
E X P E R T I S E       I N   U N L O C K I N G   V A L U E - A D D   O P P O R T U N I T I E S

 Partners for Hawai‘i                                                                                       Alexander & Baldwin I NYSE: ALEX   6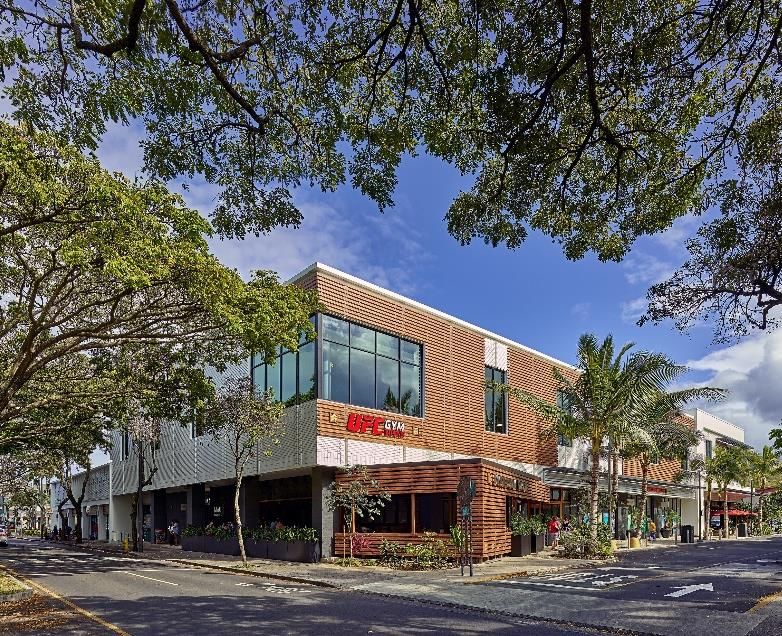
IDENTIFIED ASSET VALUE
                                                                                              As of November 30, 2021
                                                                                                                                               Internal capital sources
                                                                                                            Land Ops.                            to fuel CRE growth
                                                                                                            $121.0M
FACILITATES PIVOT BACK TO
                                                                                                                     Materials &

                                                 79%                                                                                                    21%
CRE INVESTMENTS
                                                                                                                    Construction
                                                                                                                      $210.3M

SIMP LIFICAT IO N                            CRE-Identified                                                                                         Non-CRE
                                              Assets Value
                                                                                  CRE            $1.9B                                             Assets Value

NEARING                                                                        $1,502.4M
                                                                                                  Asset Value
                                           22                   11
                                                                                                                                           •   Land Operations (Net BV

CO MP LE TIO N
                                                                                                                                               $21.8M)
                                           Retail         Industrial                                                                       Maui Business Park carrying value: $25.4M
                                         Properties       Properties
                                                                                                                                           •   25,800-acre land portfolio
Well-positioned for continued
simplification and expect to achieve        4                  50                                                                          •   Development-for-sale portfolio

vision, in near term, of becoming a        Office   Ground Leases                                                                          •   Materials & Construction
pure-play Hawai‘i CRE company.           Properties on 146 Acres                                                                               businesses (Net BV $166.1M)

                                                                                                                                           Grace Pacific carrying value: $134.7M
Steady monetization of non-core assets      HAWAI‘I NOI
has strengthened balance sheet and
enabled a renewed focus on CRE growth.                           2020                                   $94.3M
                                                                                                                                                               Nearly
                                                                                                                                                              Fourfold
                                                 2019 (Pre-COVID)                                          $104.2M
                                                                                                                                                             Hawai‘i NOI
                                                                                                                                                              Increase
                                                                 2012         $26.7M                                                                         Since 2012

                                                                        0             20             40             60              80            100             120
                                                                                                               $ in Millions
 Partners for Hawai‘i
              Hawai’i                                                                                                          Alexander & Baldwin I NYSE: ALEX   7
                                            Note: See appendix for a statement on management’s use of non-GAAP financial measures and reconciliations.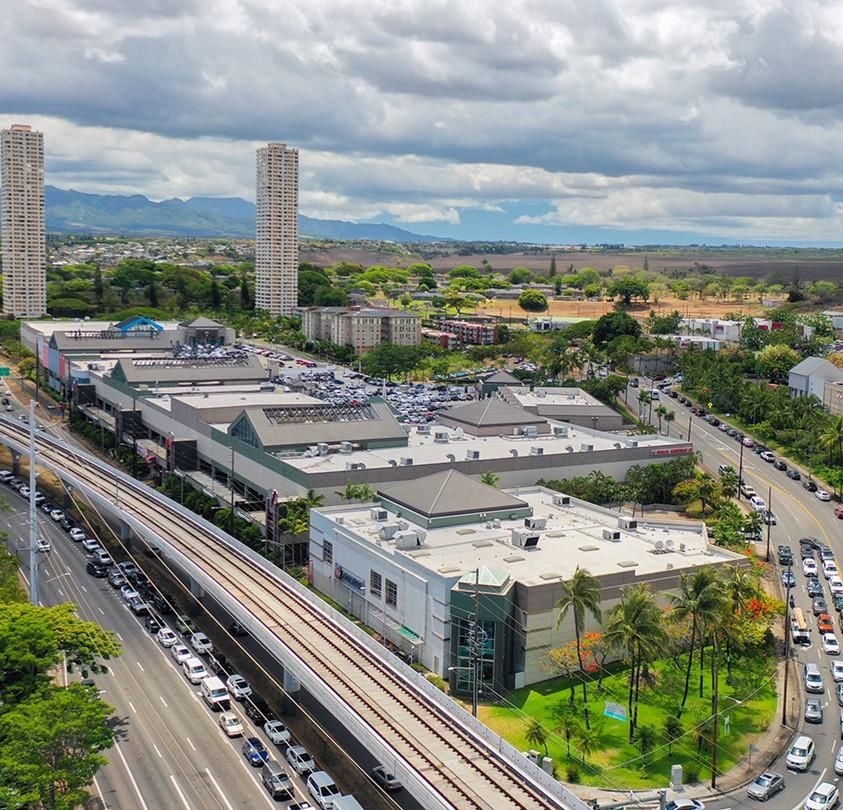
ST RO N G
                                                                                                                                    $26 M

  BALANCE SH E E T                                                                TOTAL LIQUIDITY I $383M
                                                                                                                       $383M
                                                                                                CASH I $26M               Total
  AMPLE LIQUIDITY TO SUPPORT
  ACCELERATED CRE GROWTH                                                    UNDRAWN REVOLVER I $357M                    Liquidity

                                                                                                                          $357 M

   During Q3 2021, to ensure A&B has all the necessary tools to                                               After closing the recast credit
   maximize shareholder value as a REIT:                                                                      facility, no material debt
                                                                                                              maturities until 2024
   •       Closed recast of credit facility, increasing total capacity from $450 million to
           $500 million and extending maturity to 2025 with additional favorable changes
   •       Established an At-the-Market equity issuance program of up to $150 million
              −        Combined with existing share repurchase authorization, provides robust capital         As of September 30, 2021, Net
                       markets tools as we complete simplification efforts and pivot to growth                Debt to TTM Consolidated
                                                                                                              Adjusted EBITDA was 5.5x,
                                                                                                              down from 6.6x one year ago
Partners for Hawai‘i                                                                                                Alexander & Baldwin I NYSE: ALEX   8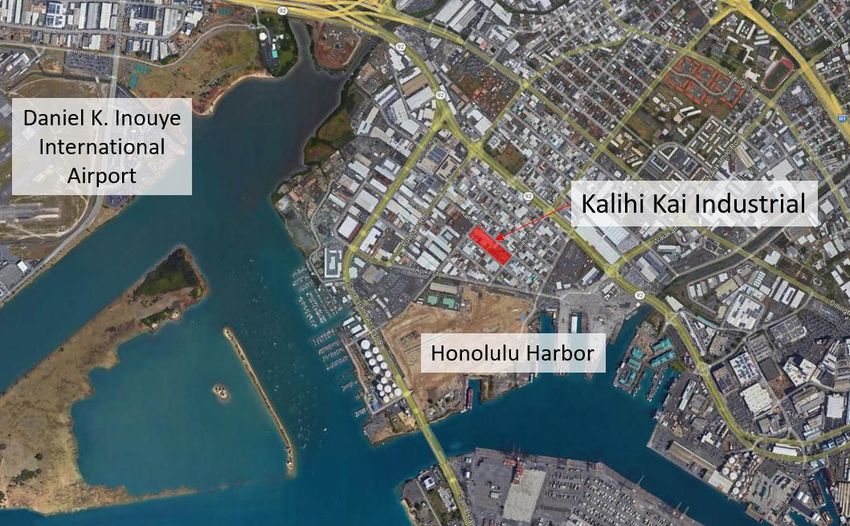
MULTI-PRONGED APPROACH                     ACTIVE INVESTMENTS TEAM                                POTENTIAL UTILIZATION
                                               New industrial acquisition announced,                  OP Units to facilitate tax-advantaged
                                               with additional acquisitions expected                  transactions

    GRO W CRE                                  150-YEAR HISTORY
                                               Successfully operating in high-performing,
                                                                                                      DEEP EXPERTISE
                                                                                                      In development and redevelopment

    PORTFOLIO                                  high barrier to entry Hawai‘i market

                                               HAWAI‘I “SHARPSHOOTER”                                 GROW CRE PORTFOLIO
    THROUGH EXISTING GROUND LEASE,
                                               Deep market knowledge providing                        Internal options through existing
    REDEVELOPMENT AND ENTITLED LAND
                                               superior sourcing advantages, including                entitled land, ground lease and
    OPPORTUNITIES
                                               off-market and first look opportunities                redevelopment opportunities

Vast growth opportunities in preferred asset types
ANCHORED RETAIL ASSET
 OWNERSHIP IN HAWAI‘I                     15   Grocery or drugstore
                                               anchored assets
                                                                           INDUSTRIAL ASSET
                                                                         OWNERSHIP IN HAWAI‘I                              11       Industrial assets

                                       2.2M    Sq. Ft. of GLA
                                                                                             2%
                                                                                                                 1.2M               Sq. Ft. of GLA
                               22%
                                       93.2%   Leased Occupancy                                              98.0%                  Leased Occupancy

                                               Of Total Improved                            98%                                     Of Total Improved
                         78%
                                        62%    Property NOI in 2020                                               23%               Property NOI in 2020

                         A&B   Other
                                       ~10M    Sq. Ft. of GLA
                                               Total Market                            A&B    Other           ~60M                  Sq. Ft. of GLA
                                                                                                                                    Total Market
  Partners for Hawai‘i
               Hawai’i                                                                                            Alexander & Baldwin I NYSE: ALEX   9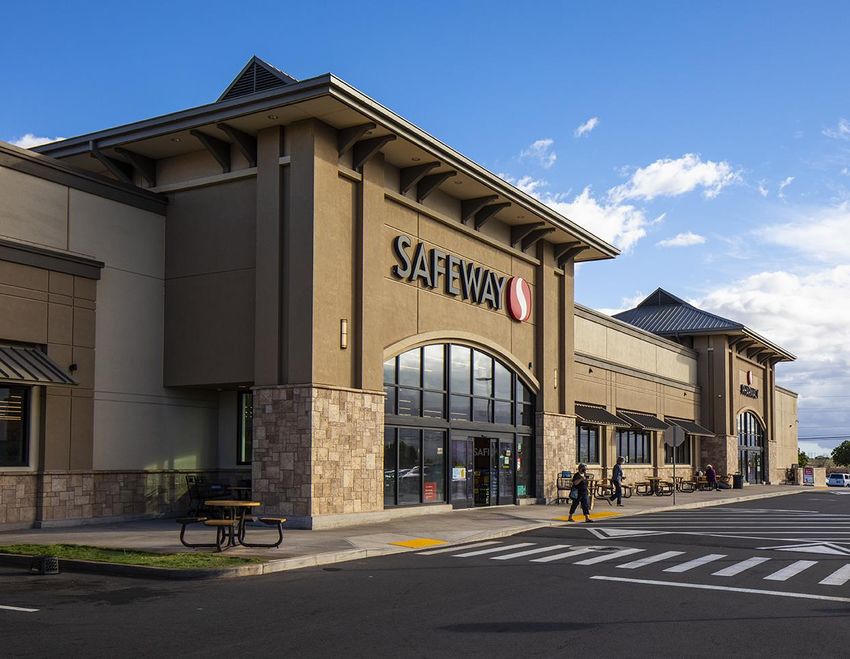
IMPROVING HAWAI‘I’S COMMUNITIES AND CREATING VALUE FOR STAKEHOLDERS AS PARTNERS FOR HAWAI‘I

 COMMITMENT
 T O CO RP O RAT E                                 ENVIRONMENTAL              SOCIAL                                   GOVERNANCE

                                                   • Lau Hala Shops           • Supported 230 local                    • Increased Board
 RE SP O N SIBILIT Y                                 redevelopment in
                                                     Kailua won two awards,
                                                                                organizations and non-
                                                                                profits during 2020
                                                                                                                         independence, and
                                                                                                                         enhanced gender and
                                                     including prestigious                                               ethnic diversity
 Proactive ESG agenda implemented over                                        • Recognized by Nareit as
                                                     national gold award
 past several years, consistent with                                            Silver Award winner for                • Board refresh adds new
                                                     from ICSC
 Company’s DNA and local commitment                                             Diversity, Equity and                    perspectives and keeps
                                                                                Inclusion                                the CEO and Chairman
 Published second Corporate Responsibility                                                                               roles separate
 Report with enhanced GHG and SASB                                            • Recognized by Pacific
 disclosures                                                                    Business News as
                                                                                Corporate Award winner
 2020 Nareit Diversity, Equity & Inclusion (DEI)                                at Business of Pride
 Silver Award Winner; other local and national                                  Awards
 awards for ESG efforts
                                                   RECENT ESG
                                                   RECOGNITIONS
                       LINK   TO   VIDEO

Partners for Hawai‘i                                                                                      Alexander & Baldwin I NYSE: ALEX   10
Number of Properties 86
Retail (“Needs-Based”) 22
Industrial 10
Ground Lease 50
Office 4
Total GLA (Sq. Ft.)1 3.9 M
Retail 2.5M
Industrial 1.2M
Office 0.1M
Ground Leases 146 acres
Alexander & Baldwin Portfolio Leased Occupancy % 94.6%
BUSINESS OVERVIEW* Portfolio Economic Occupancy % 92.0%
Total Portfolio Rent Spread 2.3%
Total portfolio rent spread for trailing four quarters 6.1%
Annualized Base Rent (ABR) Per Sq. Ft. $27.07
Retail $33.09
Industrial $15.13
Office $33.61
% of Retail ABR from Anchored Properties
89%
(Grocery/Pharmacy/Warehouse Club)
Equity Market Cap $1.7B
Net Debt to TTM Consolidated Adjusted EBITDA 5.5x
Total Liquidity $383.4M
*As of September 30, 2021
1: Due to rounding, Total GLA does not foot to portfolio segments.
Hawai’i
Partners for Hawai‘i Alexander & Baldwin I NYSE: ALEX 11CRE PORTFOLIO CONTINUES
TO PERFORM VERY WELL
NOI up nearly 30% year-over-year due to greatly improved
tenant performance, including impact of reversals of reserves
STRONG LEASING ACTIVITY
WITH RECORD NEW LEASE VOLUME
Outstanding leasing demand, with another consecutive
quarter of record new lease volume
OVERALL & SAME-STORE LEASED
OCCUPANCY OF 94.6%
Solid overall leased and Same-Store leased occupancy
ST RO N G Q 3 2 02 1 realizes positive incremental movement of 60 basis points
over prior quarter
CRE RESULT S
Partners for Hawai‘i Alexander & Baldwin I NYSE: ALEX 12REVISED
GUIDANCE
The Company increased its annual 2021 guidance ORGANIC SAME-STORE NOI GROWTH
to reflect its improved outlook Significant contractual rent step-ups across Same-Store
portfolio, including $1+ million in ground lease growth
INCREMENTAL NOI GROWTH FROM
• Core FFO per diluted share DEVELOPMENT AND REDEVELOPMENT
New economic occupancy at Ho‘okele Shopping Center and
• CRE Same-Store NOI Aikahi Park Shopping Center: high-six-figure incremental NOI in
2021 and additional upside beyond this year
COLLECTIONS
REVISED PRIOR
AND BAD DEBT RESERVES
Cash recoveries related to reserves established in 2020 may
$0.88 to $0.92 $0.81 to $0.87
continue to provide an upside opportunity in 2021, though
10% to 12% 7% to 10% expect lower such collections in the fourth quarter compared to
the first nine months of 2021
Note: See appendix for a statement on management’s use of
non-GAAP financial measures and reconciliations.
Partners for Hawai‘i Alexander & Baldwin I NYSE: ALEX 13• Strong progress made in advancing strategic simplification efforts,
SIMPLIFICATION with total proceeds of $203M in 2021
EFFORTS • Monetization of non-core assets has strengthened balance sheet
and enabled a renewed focus on CRE growth
Non-Core Asset Monetization • Expectation of continued simplification progress in 2022,
nearing goal of becoming a pure-play Hawai‘i CRE company
Status Non-Core Asset Type Quantity Total Proceeds ($M)
Landholdings 1,968 acres $40.2M
Maui Business Park II 9 acres $9.2M
Closed in 2021
Kukui‘ula (YTD until sale of project) 42 units & 2 bulk parcels $41M
Kukui‘ula Sale of Project $113M
Possible Q4 2021 Closing Landholdings Closed As Expected – Included in Full Year Total
Land Operations, $230.6 M As of Land Operations, $121.0 M As of
Identified 9/30/2021 Materials and Construction
11/30/2021
Asset
24% 21%
Materials and Construction
Value Other Non-CRE Assets Value
Other
Non-CRE Assets Value
CRE
$627.7M $26.5M $534.7M $53.1M
CRE Total Debt Cash on Hand
Total Debt Cash on Hand
Partners for Hawai’i Alexander & Baldwin I NYSE: ALEX 14Backlog And Contracted Work By Quarter1
Q1 2019 – Q3 2021
1: Excludes backlog for GPRM Prestress, sold as of Jan. 1, 2020.
• Generated positive Adjusted EBITDA in Q3 2021,
reflecting progression of improving results each
quarter in 2021 as paving projects commence
MAT E RIALS & • Optimistic outlook supported by significant uptick
CO N ST RUCTIO N in trend of backlog turning to contracted work
• Strong contracted backlog enhances productivity
and should drive greater earnings in quarters ahead
Partners for Hawai‘i Alexander & Baldwin I NYSE: ALEX 15COMMERCIAL
REAL ESTATE
Partners for Hawai’i Alexander & Baldwin I NYSE: ALEX 16ABR EXPOSURE BY CATEGORY AS OF Q3 2021
PORTFOLIO Strategically diversified portfolio of primarily grocery-
CO MP O SITIO N O F anchored, community-based retail and services well
positioned for an evolving market as people’s lives
increasingly are centered around their neighborhoods.
IRRE P LACE ABLE ASSE T S
Portfolio Composition ABR Exposure by Category
% of ABR
Ground/Industrial/Office Essential Retail Non- Essential Retail
18%
Non-Essential 16%
Retail 14%
12%
19% 10%
Essential 8%
Retail/Restaurants 6%
Ground Leases, 4%
Industrial and 48% 2%
Office 0%
33%
Partners for Hawai‘i
Hawai’i Alexander & Baldwin I NYSE: ALEX 17ABR BY ANCHORED PROPERTY TYPE
HIGH -Q UAL I T Y ASSE T S
Total Portfolio ABR by Anchored Property Type Retail ABR by Anchored Property Type
Office
Strip Retail
4%
Industrial 11%
16%
Grocer/ Warehouse
Pharmacy Club
45%1 20%
Ground Lease
15% Grocer/Pharmacy
69%
Strip Retail
Warehouse
7%
Club
13%
1: Includes Shadow-Anchored
89% of Retail ABR is derived from centers anchored
by Grocery, Pharmacy or Warehouse Clubs
Partners for Hawai’i Alexander & Baldwin I NYSE: ALEX 18H IGH -Q UALIT Y T E N AN T S
Top Ten Tenants
Tenant1 # of Leases ABR2 Status3 Category
7 $7,425 Paying
Grocery –
National
Low Exposure to Green Street
1 $3,308 Paying
Warehouse – “National Watchlist” Tenants
National
Drugstore –
6 $2,752 Paying
National
Strip Center REITs - Watchlist & Bankruptcy Tenants
Grocery –
7 $2,088 Paying
Local (Estimated % of Pro-Rata Rent)
Discount – 9%
2 $1,992 Paying
National
8%
Moving – 7%
2 $1,889 Paying
National
6%
Materials &
1 $1,636 Paying Construction 5%
– Local 4%
Fitness – 3%
1 $1,513 Paying
National
2%
Beauty – 1%
3 $1,508 Paying
National
0%
Pet –
3 $1,358 Paying
National
SITC RPAI KIM UE BRX AKR WRI FRT ROIC REG ALEX
Total 33 $25,469 BK Tenants Watchlist Tenants
1: Excludes ground leases. The leased premises in the GP/RM Prestress, LLC lease is yard space and
Source: Green Street Advisors Strip Center Sector Report, August 2020.
therefore, not included in GLA.
2: Dollars in thousands.
3: Current status as of September 30, 2021.
Partners for Hawai’i Alexander & Baldwin I NYSE: ALEX 19SECURE, WITH UPSIDE 2020
KAIMUKI
GROUND SHOPPING CENTER
Kaimuki Shopping Center
LEASES ground
resulted
lease FMV reset
in a 29% ABR
increase with additional
contract steps in years 3
and 7.
1 Tenant leases land and operates property for
lease term
2021
A&B collects ground rent, including FMV and HART
2 contractual escalations and/or percentage rent Honolulu County ground
during the lease term lease contractual step-up
resulted in a 34% ABR
3 Building and other tenant improvements revert
to A&B upon expiration or tenant default
increase.
BENEFITS • Ground lease payment is senior to all other
financial obligations FUTURE OPPORTUNITY
• Costs of ownership are passed to tenant; WINDWARD CITY
minimal landlord ownership and operating SHOPPING CENTER
expenses Windward City Shopping
• No capital expenditure or tenant Center ground lease FMV
improvement costs reset upcoming in 2023,
• Minimal property management required
with similar recent FMV
resets resulting in 30% to
• Significant value creation upside at lease 70% ABR increases.
reversion and FMV reset
Partners for Hawai’i Alexander & Baldwin I NYSE: ALEX 20REDEVELOPMENT & REPOSITIONING
EMBEDDED GRO WT H
AIKAH I P AR K M AN O A
SHOPPING CE N T E R MARKETPLACE
• Reached substantial completion of central shops • Next property in repositioning pipeline
• Tenant build-out and additional refresh work continues, • Well-located community center, with target
with target stabilization in Q4 2022 stabilization in 2023
8.2% to 9% $1.5M to $1.7M $8M Low Double Digits
ESTIMATED RETURN ANTICIPATED EXPECTED ESTIMATED RETURN
ON INVESTMENT INCREMENTAL INVESTMENT ON INVESTMENT
ANNUAL NOI UPLIFT
Partners for Hawai’i
Hawai‘i Alexander & Baldwin I NYSE: ALEX 21C O M P E T I T I V E A D V A N T A G E A T M A U I B U S I N E S S P A R K I I
GRO UN D -UP D E VE LO P ME NT
O F CO M M E RCIAL ASSE T S
MAUI BUSINESS PARK II
RETAIL
Ho’okele Shopping Center
• Phase one development of
71,400-sq. ft. center
complete
• Safeway grocery store, gas
station, and convenience
store anchor property
• Strong phase one leasing
activity continues
• Expected stabilized yield
of approximately 8%
INDUSTRIAL
Highly desirable commercial
and light industrial
development given proximity
to Kahului Airport, Kahului
• 60.3 acres remaining of light industrial lots in Kahului, Maui
Harbor and main Maui
roadways
• Flexible zoning for light industrial, retail and office use
• Strategically developing and offering build-to-suit lease arrangements for tenants,
while monetizing select parcels to owner-users
Partners forHawai‘i
Partners for Hawai‘i Alexander
Alexander & Baldwin
& Baldwin I NYSE:ALEX
I NYSE: ALEX 22GROWTH VEHICLES CRE GROWTH
VIA ACQUISITIONS
CRE P O RT FO LIO Focused on growth via acquisitions as non-core disposition process
continues. Deep market knowledge and long-standing relationships
INVESTMENTS provide an acquisition advantage, with off-market or first look
opportunities.
VIA 1031 EXCHANGES
RECENT ACQUISITIONS (LATE 2018 – EARLY 2019)
Local presence
provides access to $1.0B 90%+ Ag land sale proceeds fully reinvested in A&B’s preferred asset classes
of grocery-anchored, industrial and ground leases; geographically
off-market pipeline: Invested First-look or
since 2013 off-market balanced between Oahu and neighbor islands.
acquisitions
Grocery-Anchored Industrial Ground Lease
Retail Assets Assets Assets
Actively looking to strategically grow CRE portfolio, focused
on industrial and anchored retail assets, with ample future
growth opportunities for both asset classes within Hawai‘i
Target property types
• Anchored & strip retail centers • Sale-leasebacks with
• Industrial/flex warehouses creditworthy businesses Queens’ MarketPlace Kapolei Enterprise Center Kapolei Business Park West Lot 31
• Mixed-use urban with retail • Leased-fee interests
components • Retail/industrial
development opportunities
UPREIT
Structure can provide unique diversification, liquidity and estate
benefits to sellers Waipouli Town Center Opule Street Industrial Home Depot Iwilei
Partners for Hawai’i Alexander &Alexander
Baldwin –&Partners
Alexander for
& Baldwin
Baldwin Hawaii
I NYSE:
I NYSE: ALEX
ALEX 23
23 23P O ST -Q 3 2 02 1
PIVOTING TO ACQ UISIT IO N S:
KALIHI KAI INDUSTRIAL
GROWTH
Shifting Our Attention
to Acquisitions
• Taking advantage of Hawai‘i focus
and decades-long relationships to
uncover the best value in market
• Transaction market is now slowly
reopening, thus prudently reviewing
and restocking pipeline
• Strong balance sheet and cash flows • 42K sf warehouse and • Well-located industrial
from CRE portfolio provide dry 29K sf industrial yard property in Urban Oahu
powder to pursue an active growth • Utilized §1033 funds set • Near airport and harbor
strategy going forward to expire at year end
• Aligns with desire to • Off-market acquisition
expand industrial
footprint, given strong
industrial fundamentals
Partners for Hawai’i Alexander & Baldwin I NYSE: ALEX 24• Two lots totaling approximately 3 acres of industrial land
P O ST -Q 3 2 02 1
• Well-located within Oahu submarket where most new
industrial product is being developed
ACQUISITIO N S: • Utilized §1031 and §1033 funds set to expire at year end
• Offering build-to-suit lease arrangements to tenants to
KAPOLEI BUSINESS PARK WEST LOTS
grow industrial portfolio
Closed As Expected • Aligns with desire to expand industrial footprint, given
strong industrial fundamentals
Partners for Hawai’i Alexander & Baldwin I NYSE: ALEX 25SUSTAINABILITY INITIATIVE
PEARL
HIGHLANDS
CENTER
• Commenced construction of 1.3-megawatt
rooftop photovoltaic system
• Sized to offset 100% of common area energy
and provide additional power to select tenants
• Beginning of broader rooftop solar initiative
across CRE portfolio
Late 2022 $300K
OPERATIONAL TIMING ANTICIPATED
INCREMENTAL
ANNUAL NOI UPLIFT
Partners for Hawai’i Alexander & Baldwin I NYSE: ALEX 26COVID
UPDATE
Partners for Hawai’i Alexander & Baldwin I NYSE: ALEX 27H AWAI‘I CAUT IO USLY Hawai‘i COVID-19 Hospitalization Curve
MAN AGE S CO VID May 2020 – January 2022
• Though case counts are elevated due to Omicron surge, key
metric of hospitalizations are less than half the rate compared
to Delta variant
• Hawai‘i maintains status as a leading state in total population
vaccination rate
• Effective January 10th, large indoor events capacity rule of 50%
• No additional business restrictions imposed
• Dramatic recovery in tourism and employment continues
• Peak summer travel in July at 89% of record 2019 levels,
and strong holiday season at mid-80% of 2019 levels
• State’s unemployment levels sunk to a 20-month low
of 6.0% in November
• State’s strong tourism levels in 2021 are with essentially NO
international travelers, thus a great sign for further growth Source: State of Hawai‘i Emergency Management Agency, data as of 1/6/2022.
Partnersfor
Partners forHawai‘i
Hawai‘i Alexander & Baldwin I NYSE: ALEX 28CRE RE CO VE RY
CRE NOI Growth CRE NOI Growth
As Cash Collections Continue to Trend Upward As Covid-Related NOI Charges Decline
$30.0 $44.0 $29.5 $8.0
Covid-Related NOI Charges, Net ($M)
$42.0 $28.5 $7.0
$28.0
$27.5 $6.0
Cash Collections ($M)
$40.0
$26.5 $5.0
$26.0
NOI ($M)
NOI ($M)
$38.0
$25.5 $4.0
$36.0
$24.0 $24.5 $3.0
$34.0
$23.5 $2.0
$22.0
$32.0 $22.5 $1.0
$20.0 $30.0 $21.5 $-
Q2 2020 Q3 2020 Q4 2020 Q1 2021 Q2 2021 Q3 2021 Q2 2020 Q3 2020 Q4 2020 Q1 2021 Q2 2021 Q3 2021
NOI Collections NOI Covid-Related NOI Charges (Net)
Partners forHawai‘i
Partners for Hawai‘i Alexander & Baldwin I NYSE: ALEX 29Q3 2021
CRE BAD D E BT RE SE RVE
• Resort retail responsible for about one-fifth of reserve, despite being just 5% of portfolio
Office Ground Leases
Industrial 1% 1%
9%
Resort
Retail
Resort Retail Ground Leases
5%
20% 15%
Office
4%
Q3 2021 Q3 2021 Retail
Bad Debt Reserve Industrial ABR - Portfolio Non-
Resort
16%
60%
Retail Non-Resort
69%
Partners for Hawai’i Alexander & Baldwin I NYSE: ALEX 30COMMITMENT TO
CORPORATE
RESPONSIBILITY
Partners for Hawai’i Alexander & Baldwin I NYSE: ALEX 31SUP P O RTIN G O UR COMMUNITI E S A&B allocated 20% of its annual giving budget in 2020 to support non-profits on the frontline of COVID-19 relief and to provide stability to those most affected by the impacts of this pandemic in key communities, working with trusted long-term non-profit partners. Partners for Hawai‘i Alexander & Baldwin I NYSE: ALEX 32
ALIGNED WITH COMMITMENT TO PRINCIPLES OF ESG

 BOARD OF
 D IRE CT ORS
 UP D AT E

  B OA R D OF D I R ECT OR S M ET R I CS
                                         2016                  Now

   CHAIR                         Non-Independent          Independent
                                                                               Eric Yeaman                Doug Pasquale                         John Leong
   INDEPENDENT (NYSE)                    70%*                  86%         Independent Director     Lead Independent Director               Independent Director
                                                                                Since 2012                  Since 2018                      Since October 1, 2020
   FEMALE                                20%                   29%
                                                                           Chairman of the Board                                          Highly respected young
                                                                            since October 1, 2020                                            leader in Hawai‘i
   CURRENT/FORMER
                                           3                     1
   A&B CEO                                                                                                                                    Brings valuable
                                                                                                                                             environmental and
   ETHNICALLY DIVERSE                    50%                   43%                                                                         non-profit perspectives

   REIT EXPERTISE                         10%                  43%

 *Includes a former CEO who was deemed independent under NYSE standards.

Partners for Hawai‘i                                                                                                       Alexander & Baldwin I NYSE: ALEX   33
SUPERIOR
MARKET FUNDAMENTALS
Dynamic, Growing Market with
Structural Limitations on New Supply
HIGH-QUALITY
ADVANCING
PORTFOLIO
Irreplaceable Assets with
Embedded Growth Opportunities
SIMPLIFICATION,
PIVOTING TO SIMPLIFICATION
NEARING COMPLETION
GROWTH Facilitates Pivot Back to CRE Investments
STRONG
BALANCE SHEET
Supports Accelerated Investment Activity
COMMITMENT TO
CORPORATE RESPONSIBILITY
Significant Progress in ESG Initiatives in
Recent Years
Partners for Hawai‘i
Hawai’i Alexander & Baldwin I NYSE: ALEX 34APPENDIX Partners for Hawai’i Alexander & Baldwin I NYSE: ALEX 35
CRE NET O P E RAT I NG I NCOME
            RECONCILIATION OF GAAP TO NON- GAAP MEASURES
            DOLLARS IN MILLIONS

                                                                                             Three Months                  Three Months
                                                                                                Ended                         Ended            Change
                                                                                             Sept. 30, 2021                Sept. 30, 2020
             CRE Operating Profit (Loss)                                                            $19.0                         $11.0         $8.0

                       Plus: Depreciation and amortization                                           9.2                           9.5          (0.3)

                       Less: Straight-line lease adjustments                                         (1.1)                         0.6          (1.7)

                       Less: Favorable/(unfavorable) lease amortization                              (0.1)                         (0.1)          -

                       Less: Termination income                                                      (0.1)                         (1.1)         1.0

                       Plus: Other (income)/expense, net                                            (0.4)                           -           (0.4)

                       Plus: Selling, general, administrative and other expenses                     1.6                           1.7          (0.1)

             NOI                                                                                    $28.1                         $21.6         $6.5
                       Less: NOI from acquisitions, dispositions and other
                                                                                                    (0.7)                         (0.5)         (0.2)
                       adjustments
             Same-Store NOI                                                                         $27.4                         $21.1         $6.3

Partners for Hawai‘i                    Note: Additional information is included in the Company’s quarterly Supplemental Information report,            Alexander & Baldwin I NYSE: ALEX   36
                                        which is furnished to the SEC and available at www.alexanderbaldwin.com.
FUNDS FRO M O P E RAT I ONS
(FFO ) AN D CO RE FFO
RECONCILIATION OF NET INCOME (LOSS) AVAILABLE TO A&B COMMON SHAREHOLDERS TO FFO AND CORE FFO
DOLLARS IN MILLIONS
Three Months Ended Three Months Ended
Sept. 30, 2021 Sept. 30, 2020
Net income (loss) available to A&B common shareholders $6.3 $3.0
Depreciation and amortization of commercial real estate
9.2 9.5
properties
Gain on the disposal of commercial real estate properties,
- -
net
FFO $15.5 $12.5
Exclude items not related to core business:
Land Operations Operating (Profit) (1.7) (3.1)
Materials & Construction Operating (Profit) Loss 0.3 (1.6)
Loss from discontinued operations 0.6 -
Income (loss) attributable to noncontrolling interest 0.1 0.2
Income tax expense (benefit) - -
Non-core business interest expense 3.1 3.6
Core FFO $17.9 $11.6
Partners for Hawai‘i Note: Additional information is included in the Company’s quarterly Supplemental Information report, Alexander & Baldwin I NYSE: ALEX 37
which is furnished to the SEC and available at www.alexanderbaldwin.com.CORE FUN D S FRO M O P ERATIONS
(CO RE FFO )
RECONCILIATION OF CORE FFO STARTING FROM COMMERCIAL REAL ESTATE OPERATING PROFIT
DOLLARS IN MILLIONS
Three Months Ended Three Months Ended
Sept. 30, 2021 Sept. 30, 2020
CRE Operating Profit $19.0 $11.0
Depreciation and amortization of commercial real estate
9.2 9.5
properties
Corporate and other expense (6.8) (5.4)
Core business interest expense (3.5) (3.5)
Core FFO $17.9 $11.6
Partners for Hawai‘i Note: Additional information is included in the Company’s quarterly Supplemental Information report, Alexander & Baldwin I NYSE: ALEX 38
which is furnished to the SEC and available at www.alexanderbaldwin.com.CONSOLID ATE D
AD JUST E D E BIT D A
RECONCILIATION OF CONSOLIDATED NET INCOME TO CONSOLIDATED ADJUSTED EBITDA
DOLLARS IN MILLIONS
TTM TTM
Sept. 30, 2021 Sept. 30, 2020
Net Income (Loss) $30.5 $9.1
Depreciation and amortization 50.5 54.4
Interest expense 27.8 30.4
Income tax expense (benefit) (0.3) (0.9)
Consolidated EBITDA $108.5 $93.0
Asset impairments related to the M&C segment - 5.6
Consolidated Adjusted EBITDA $108.5 $98.6
Partners for Hawai‘i Note: Additional information is included in the Company’s quarterly Supplemental Information report, Alexander & Baldwin I NYSE: ALEX 39
which is furnished to the SEC and available at www.alexanderbaldwin.com.You can also read