IS THE USE OF INFORMAL PUBLIC TRANSPORT MODES IN DEVELOPING COUNTRIES HABITUAL? AN EMPIRICAL STUDY IN DAVAO CITY, PHILIPPINES - WCTRS
←
→
Page content transcription
If your browser does not render page correctly, please read the page content below
Is the Use of Informal Public Transport modes in Developing Countries
             Habitual? An Empirical Study in Davao City, Philippines
       GUILLEN, Marie Danielle; ISHIDA, Haruo and OKAMOTO, Naohisa

   IS THE USE OF INFORMAL PUBLIC
 TRANSPORT MODES IN DEVELOPING
COUNTRIES HABITUAL? AN EMPIRICAL
  STUDY IN DAVAO CITY, PHILIPPINES

Marie Danielle Guillen, Ateneo de Manila University, Katipunan, Quezon City
Philippines 1 Tel +63 Email danielle.guillen@gmail.com

Haruo Ishida, University of Tsukuba, Urban Transportation Lab., Graduate
School of Systems and Information Engineering, University of Tsukuba,
Tennodai1-1-1, Tsukuba Ibaraki, 305-8577 Japan

Naohisa Okamoto, University of Tsukuba, Urban Transportation Lab. Graduate
School of Systems and Information Engineering, University of Tsukuba
Tennodai1-1-1, Tsukuba Ibaraki, 305-8577 Japan

ABSTRACT

Many cities of developing countries are characterized by the presence of its unique
kind of public transportation often described as informal. It is often noted that the lower
income category of people are usually the ones who rely on informal public transport
services. There is an assumption that public transport dependency on certain mode is
due to lack of option. Using Davao City, Philippines as the case study area, the paper
explored the concept of public transport dependency to the different road-based public
transport modes in emerging city, using both concepts of rational behaviour and
planned behaviour. Empirical results using structural analysis shows the strong public
transport dependency to jeepneys and tricycles in the case study area where half of the
household population has vehicles. It confirms the role of rational behaviour such that
one’s socio-economic factors affect modal decision. Likewise, the study also shows
interesting findings wherein the quality of service evaluation played a direct role in the
dependency perspective to formal modes (buses, taxis) and informal mode (“habal-
habal” or motorcycle taxis) but an indirect role in the actual use. The study shows the
relationship of personal dependency assessment or “habit” and the use of indigenous
modes (PUJ, tricycles) and supports theory which suggests t role of habits and “mere
exposure” effect. This indicator is validated by the actual use of public transport modes
especially tricycles and “habal-habal” (motorcycle taxis) for short-distance trips as well
as on the result of how an individual view one’s own dependency vis-à-vis how one

                     12th WCTR, Juli 11-15, 2010-Lisbon, Portugal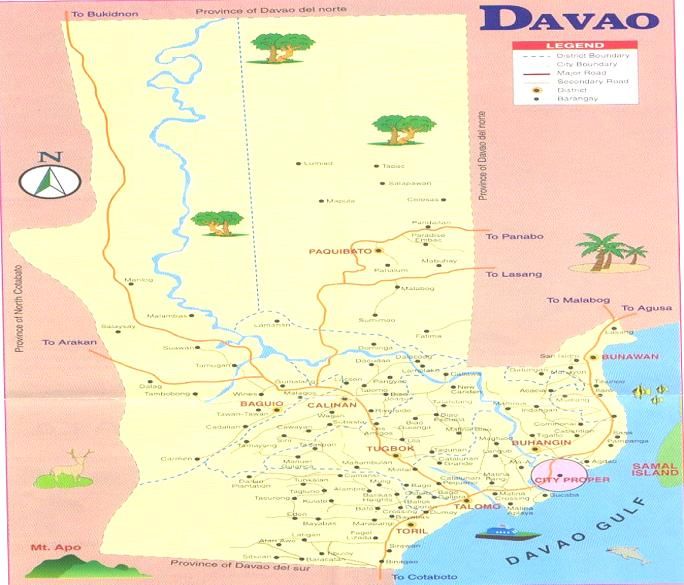
Is the Use of Informal Public Transport modes in Developing Countries
             Habitual? An Empirical Study in Davao City, Philippines
       GUILLEN, Marie Danielle; ISHIDA, Haruo and OKAMOTO, Naohisa

sees his/her household and community dependency to a certain public transport mode.
Habits are not easily altered as shown in many studies, these findings suggest that
careful review of key detailed issues such as the overall quality of service level and the
associated items regarding indigenous and or informal public transport modes is
necessary before suggesting specific policy or planning interventions.

Keywords: habit, modes, informal

INTRODUCTION

Public transportation in developing countries in Asia is usually represented by a unique
type of public transport mode. For instance, “motos” (or motorcycle taxis) are popular in
Viet Nam, “tuktuks” (motorcycle with attached cabs) are quite known in Thailand and
the “public utility jeepneys” (PUJs) are a common sight in the Philippines. The cities
and towns in developing nations are usually heavily dependent on road-based public
transport for their mobility. They are often described as informal public transport modes
and they are known to play a major role in meeting the travel needs of the poor.

In the case of the Philippines, even the government acknowledged that public utility
jeepneys (PUJs) and tricycles compete very effectively with other forms of transport
(DOTC, 2006) or if not, plays a complementary role to other available forms of public
transportation.

The most common assumption is that public transport dependency on a certain mode
(particularly the informal modes) in developing countries is due to the lack of modal
choice and/or very cheap. Such is the case often used in explaining the theory of
rational behaviour by most engineers. The theory of planned behaviour, or habits, as
an alternative explanation is usually provided by psychologists and social scientist. In
this paper, the latter is used as a complementary theoretical basis to understand the
case of public transport dependency in a developing country.

To date, most of the studies in developing nations are usually about the important role
informal public transport services provide for the poor. Some anecdotal references
showed that low-income groups were prepared to pay a premium fare to ride regular
mini-bus when faced with irregular overcrowded bus (Allport, R., 2000). But there is
conflicting evidence as to whether or not the poor spend a higher proportion of their
income on transport than other groups (Kranton, R., 1991). Moreover, it is difficult to
find studies on how other social income groups in developing countries view their
public transport dependency.

Some of the studies that explored the concept of dependency centred on private
vehicle especially automobile and/or car dependency (Wicham, J., 1999) or on the
efforts to shift from automobile dependency to public transport vehicle (Taniguchi, A.

                     12th WCTR, Juli 11-15, 2010-Lisbon, Portugal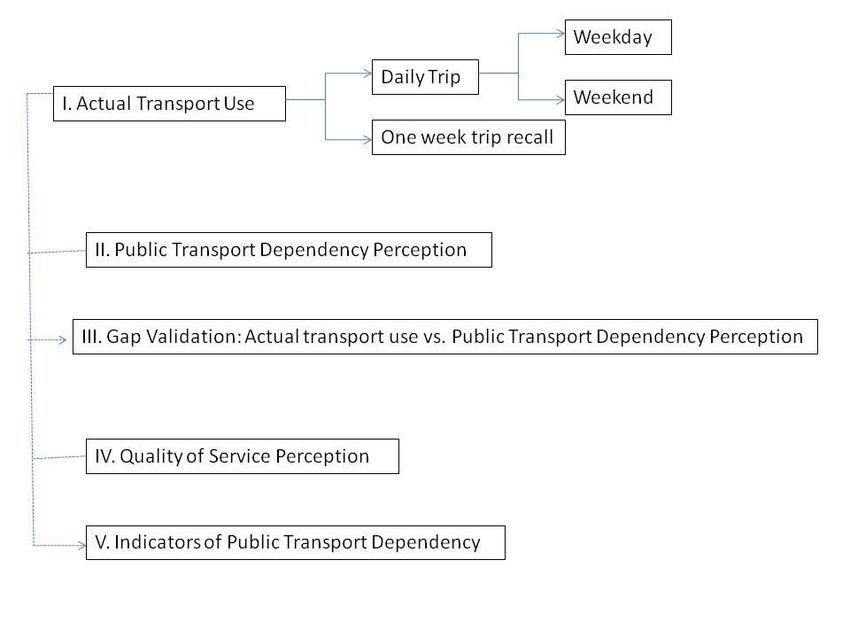
Is the Use of Informal Public Transport modes in Developing Countries
             Habitual? An Empirical Study in Davao City, Philippines
       GUILLEN, Marie Danielle; ISHIDA, Haruo and OKAMOTO, Naohisa

etal., 2005, 2007). Efforts to understand public transport dependency from a subjective
view are also quite limited. Recent pioneers of these this type of studies have been
from the psychological perspective such as the role of habit in behaviour prediction
(Verplanken,B. and Wood, W, 2006, Aarts,H and Dijsterhuis, Ap, 2000, Fujii S and
Garling,T, 2005, and Fujii, S and Taniguchi, A., 2005) and were mostly based from
case studies done in Europe and in Japan. These studies generally assessed
automobile dependency and offered new insights on mobility management. Some of
these studies took account of environmental issues. Others took note of the mobility
needs of the elderly. Many of the studies in the United States are about travel-related
attitudinal, personality and lifestyle cluster studies that characterized individual’s
personalities with their mobility and related the findings to automobile dependency
(Redmond, L., 2000, Mokhtarian,P. and Salomon, I.,2002).

In developing countries, there were various anecdotal studies about informal public
transport modes which try to address issues of public safety and welfare (congestion
and accidents), environmental issues (air pollution) and its role as a complementary
(feeder) mode, low-cost and adaptable market responsiveness (Cervero, R. 1999,
Guillen,2002, Iwata,1989,Ocampo, 1986). In the Philippines, examples include a study
on informal public transport modes like tricycle and motorcycle taxis that concluded its
appropriateness as public transport in some areas of the Philippines like Siquijor
Province (Rahman, M.D., 2007). There were also earlier initiatives on incorporating the
effect of perception and feeling variables on mode choice behaviour. A study in Metro
Manila, Philippines showed that objective explanatory variables are more powerful than
subjective ones and those precise measured level of service (LOS) variables could
yield better model estimations. It suggested that disaggregate logit mode could be
more powerful in explaining mode choice behaviour (Ishida, H. and Kurokawa, T.,
1991). A recent study in Indonesia also showed some important factors and attributes
to explain user’s perceptions and priorities regarding the service and suggested the
likely continuation of using paratransit despite its dissatisfaction with several of its
aspects (Joewono, T., and Kubota,H., 2007).

There is a common assumption that informal public transport exist since the general
public has no other option for mobility and that it is cheaper than other formal public
transport mode. However, there seems to be a consensus that users are generally not
happy with the quality of service of these modes. Previous study that showed that most
of the users are dissatisfied with several of its service aspects and yet there are loyal
users (Tri, J. and Kubota, H., 2007).

The concept of public transport dependency using objective and subjective measures
has never been fully explored and undertaken, more so in the case of different kinds of
informal public transport modes found in many emerging cities of developing countries.
Thus, the study is motivated by the need to understand informal public transport modes,
what really drives people to use it and the need to rationally plan for, and regulate it in

                     12th WCTR, Juli 11-15, 2010-Lisbon, Portugal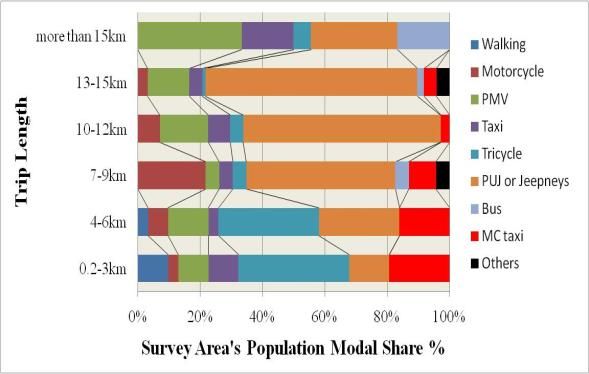
Is the Use of Informal Public Transport modes in Developing Countries
             Habitual? An Empirical Study in Davao City, Philippines
       GUILLEN, Marie Danielle; ISHIDA, Haruo and OKAMOTO, Naohisa

order to maximize its inherent psychosocial and economic advantages vis-à-vis the
formal public transport like buses as well as understand the associated issues.

Objectives of the Study

In general, this paper tries to understand public transport dependency in an emerging
metropolitan city of a developing country. Specifically, it aims to provide additional
insights on how the community view informal public transport modes. It seeks to give
another perspective by looking at the hierarchical classification of public transport
modes from the perspective of the community. The objective (use of mode) and
subjective (dependency perceptions) approaches in understanding public transport
dependency given the assumptions that all types of road-based public transport modes
are available, cheap, accessible and that not all public transport users belong to the
low-income group in the study area.

RESEARCH FRAMEWORK AND METHODOLOGY

In order to assess the public transport dependency, the available road-based public
transport services in the study area were classified into three groups: (1) formal modes
defined as the traditionally, technically and legally accepted modes like the bus and
taxis; (2) indigenous modes described as a domestic innovation, alternative, but legally
accepted modes (PUJs, tricycles) and the informal modes or those that are not
traditionally, technically and legally-accepted modes such as the “habal-habal” or
motorcycle taxis.

Public transport dependency is defined by assuming that the frequency of actual public
transport use (objective measurement) is equal to the perception of public transport
service need.

To understand the public transport dependency concept in the Philippines, a
developing country, the paper utilized the results of the household travel survey case
study conducted by the authors in 2007 in Mintal- Tugbok, Davao City where all types
of road-based public transport modes can be observed.

Public transport dependency is analyzed using a number of statistical tests utilizing the
Statistical Program for Social Sciences (SPSS )software as illustrated in Figure 1.

The first part (I) look at the descriptive analysis of the respondents’ actual transport use
on a daily basis and the one week trip recall from the day of the completion of the trip
diary. The second part (II) is the subjective measurement of public transport
dependency using the results of how respondents view their dependency to the

                      12th WCTR, Juli 11-15, 2010-Lisbon, Portugal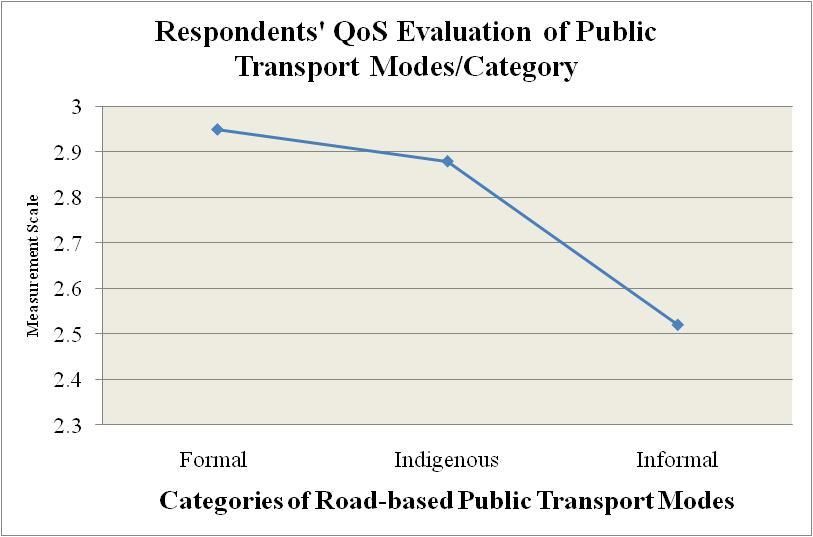
Is the Use of Informal Public Transport modes in Developing Countries
             Habitual? An Empirical Study in Davao City, Philippines
       GUILLEN, Marie Danielle; ISHIDA, Haruo and OKAMOTO, Naohisa

different public transport modes in the area. The public transport dependency scale
ranges from 1 (not dependent) to 4 (very dependent).To check the variability of
responses at the personal, household and community level perceptions across the
modes, the results were tested using the coefficient of variance (CV). CV measures the
consistency of dependency response across all respondents-subjects and shows the
cognitive gap on how individual think of one’s own dependency vis-à-vis to that of
his/her household and community. The third (III) part tries to compare and validate the
gap between actual transport use vis-à-vis public transport dependency perceptions
and uses the statistical t-test of independency. This test was utilized to test the
differences between two means of those who actually use the public transport and
those who didn’t use the public transport, thus understanding whether this affect how
respondents asses their dependency. This is based on the assumption that public
transport use has an effect on how they view their public transport dependency.

           Figure 1. Analytical Framework for Understanding Public Transport Dependency

The fourth (IV) part provides an evaluation on the public transport service quality
shown in Figure 2. The service quality items used were based from previous literature
review and used the measurement scale range from 1 (very bad) to 4 (very good). The
cronbach alpha statistical tool was used to analyze the reliability of these items as an
indicator of the overall quality of public transport service. The fifth (V) and last stage

                      12th WCTR, Juli 11-15, 2010-Lisbon, Portugal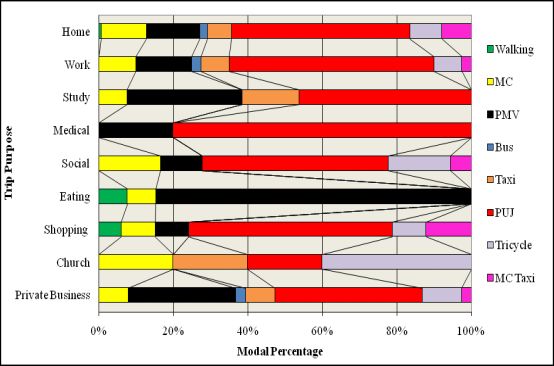
Is the Use of Informal Public Transport modes in Developing Countries
Habitual? An Empirical Study in Davao City, Philippines
GUILLEN, Marie Danielle; ISHIDA, Haruo and OKAMOTO, Naohisa
involves testing for indicators of public transport dependency using SPSS-AMOS
(Analysis of Moment Structures) program to obtain the structural equation model that
capture the causal influences of the exogenous (independent variables) on the
endogenous (dependent) variables and the causal influences of the endogenous
(dependent) variables upon one another as well as identify predictors of the use of
public transport mode.
Figure 2 Service Quality Evaluation Items
THE STUDY AREA: DAVAO CITY, PHILIPPINES
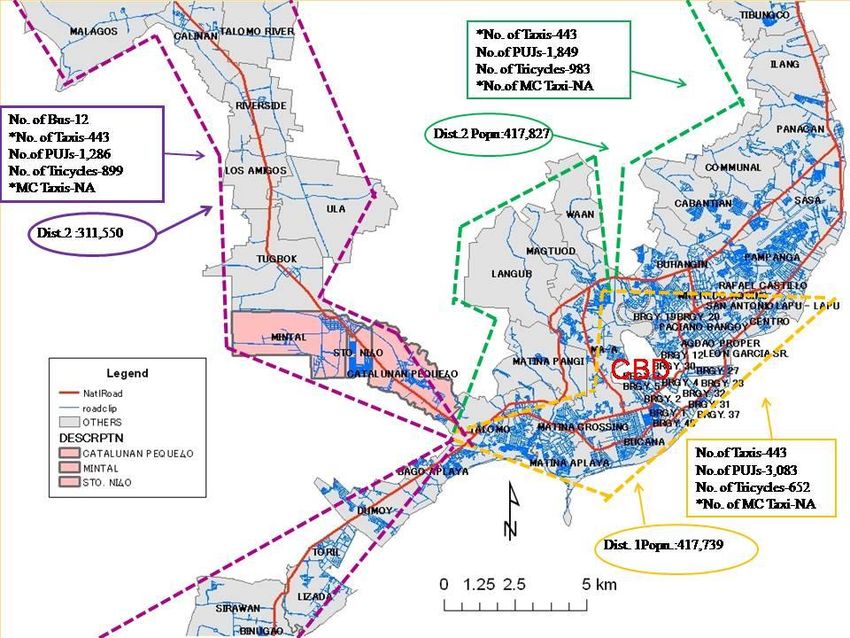
Davao City (Figure 3) is chosen as the study area for this research because of its
significant contribution to the economic development of Mindanao and being one of the
major cities in the Philippines that is highly dependent on road-based public transport
modes. It is strategically located in the Asia-Pacific rim and is a key player in the
flourishing trade hub called the Brunei-Indonesia-Malaysia-Philippines East ASEAN
Growth area or BIMP-EAGA. It is considered as Mindanao’s center of commerce, trade
and services. However, when compared to Metro Manila, the capital of the Philippines
and other metropolitan cities; Davao City is relatively a young city.
12th WCTR, Juli 11-15, 2010-Lisbon, PortugalIs the Use of Informal Public Transport modes in Developing Countries
Habitual? An Empirical Study in Davao City, Philippines
GUILLEN, Marie Danielle; ISHIDA, Haruo and OKAMOTO, Naohisa
1 2
Figure 3. Map of the Philippines and Davao City
1 2
Source: htttp://www.gov.ph; Davao Map and City Guide, 2004
Davao City is the gateway to the Philippine South and has regular air, sea and land
linkages to major points of the country. It is the capital of the Davao Region (Region XI),
one hour and forty minutes by plane from Metro Manila. It is bounded by the province
of Davao del Norte, Davao del Sur and partly in the East. It faces the expanse of the
Davao Gulf and the Island Garden City of Samal. Its boundary line passes through the
peak of the country’s tallest mountain, Mt. Apo (3,142meters above sea level) and is
located outside a storm-free zone. It enjoys good tropical weather all- year round with
climatic elements that are distributed evenly. Temperature ranges from 15C-34C.
Davao City has maintained its competitive position in attracting investments and in
penetrating new foreign markets owing to its resilient exports base, peaceful business
climate, better quality of life and rich pool of skilled workforce. Given these conditions,
Davao City’s population boomed from 850,000 in 1990 to 1.4 million in 20091.In terms
of infrastructure development, aside from a significant number of buildings and
telecommunication facilities, the total road network of the city is stretched at around
1,772kms.Most of the roads connect directly to other provinces and neighbouring cities.
1
Estimates based on the 2.41 average annual growth rate. Available at
http://www.davaocity.gov.ph/Downloads.aspx?cid=2
12th WCTR, Juli 11-15, 2010-Lisbon, PortugalIs the Use of Informal Public Transport modes in Developing Countries
Habitual? An Empirical Study in Davao City, Philippines
GUILLEN, Marie Danielle; ISHIDA, Haruo and OKAMOTO, Naohisa
These and other factors have contributed to the rapid growth of transportation in the
city.
As an emerging metropolitan city, it has both the urban and rural population which
tends to encounter problem ranging from lack of transport services to traffic congestion
at the central business district (CBD). This is attributed to the concentrated population
and increasing motor vehicle ownership in the urban areas. While in rural areas, the
problem is due to poor road condition and road availability. They only have road-based
public transport service modes to rely on.
Davao City’s Transport Infrastructure
Road network and highway in Davao City are classified and maintained according to
the hierarchical classification. The Department of Public Works and Highway (DPWH)
is in charge of national road (260km), the office of the City Engineer (local government
unit) is in-charge of the city roads (626km) and the city government and respective
local units maintain the baranggay roads (840 km.).
Table 1.Road Hierarchy,Road Length, Agencies in charge and MV Speed Limits
Road Hierarchy Road length (km) Agency-in-charge of road Speed Limit (km/hr)
maintenance DC Highway Patrol
Cars/MC Buses/Truck
Taxi
National Road 260 DPWH 80 50
City Road 626 Office of City Engr. 30-40 30
Brgy. Road 839.7 Brgy. & City Govt. 30-40 30
Moreover, there have been an increasing number of utility vehicles (including jeepneys)
and motorcycles as shown in Figure 4:
Figure 4. Number of Motor Vehicles in Davao City from 1990-2008,
Source of Data: DOTC-LTO Region XI, 2009
12th WCTR, Juli 11-15, 2010-Lisbon, PortugalIs the Use of Informal Public Transport modes in Developing Countries
Habitual? An Empirical Study in Davao City, Philippines
GUILLEN, Marie Danielle; ISHIDA, Haruo and OKAMOTO, Naohisa
An Overview of the Past and the Present Development and Transport
Plans of Davao City
An increase of public transport demand by 2.6 times in terms of number of passengers
and 3.8 times using passenger-kilometer was projected for the year 2000.This is to be
attributed to the projected expansion of Davao City’s urban scale. It recommended the
development of city bus service as major means of urban transportation given that the
public transport modal share is expected to be dominated by public utility jeepneys or
PUJs (Fig.5).Such was also expected to be used as the basis for the development of
rail transit in the city. Table 2 shows an overview of the comparative development and
transport studies done in Davao City since 1981.
Table 2. An Overview of the Development & Transport Plans of Davao City
Davao City Urban,Transport Comprehensive Transportation & Traffic
Comprehensive Land Use Study Development Plan of Management Plan for
(JICA,1981) Davao City (1996- Davao City Final Report
2021) (NCTS Foundation, 2000)
Socio-economic Role of Davao City National Framework
Framework Projected Labor Force Plan (1996-2021)
Urban Development Recommendation: Multi-center Urban Settlement
Pattern development plan hierarchy
Land Use Plan Expand urban area from Spatial or multi-
3500hectares to 9700hectares nucleus development
strategy
Transportation Year 2000: increase demand for Road Network Specifically CBD
Demand and Public public transport Improvements
Transport System Recommendation: Issues:
Improvement of public transport Traffic congestion in
terminals, city bus and then rail CBD
Note: CBD-Central business district
Figure 5 shows the predicted public transport modal share per trip length.
Figure 5. Projected Modal Share (%) of Public Transport Mode by Trip Length in 2000
Data Source: Japan International Cooperation Agency (JICA):Davao City Transport Cum Land Use Study
Final Report,1981
12th WCTR, Juli 11-15, 2010-Lisbon, PortugalIs the Use of Informal Public Transport modes in Developing Countries
Habitual? An Empirical Study in Davao City, Philippines
GUILLEN, Marie Danielle; ISHIDA, Haruo and OKAMOTO, Naohisa
In 2000, the transportation study focused mainly on recommending necessary traffic
management schemes and measures to address the existing transportation and traffic
problems. Its main concern was alleviating traffic congestion in city center. It suggested
various options on re-routing of PUJs and signal implementation in the CBDs. Its
recommendation was consistent with Davao City’s development vision of having a
transportation system that is environmentally-friendly and sustainable transportation
network based on an efficient multi-modal transportation system and road network and
could meet the growing urbanization and development of the city (UPNCTS
Foundation, 2000).
Figure 6. The Public Transport Modal Distribution in 3 Districts of Davao City.
Notes:District 1=yellow dotted line; District 2=green dotted line; and District 3= purple dotted line. National
road=red line the secondary and tertiary roads=blue lines. The color pink represents the baranggays along
the national road where the household samples were selected.
* According to newspaper reports (2007) and interview (2008), MC taxis population is estimated to be
14,000 in Davao City
Source: District population statistics is based on Davao City Census 2000 report; number of public
transport mode is based on LTFRB 2005 data.
12th WCTR, Juli 11-15, 2010-Lisbon, PortugalIs the Use of Informal Public Transport modes in Developing Countries
Habitual? An Empirical Study in Davao City, Philippines
GUILLEN, Marie Danielle; ISHIDA, Haruo and OKAMOTO, Naohisa
Figure 6 shows the present public transport modal distribution in Davao City. It shows
that the city of Davao is divided into three administrative political districts (dotted lines).
To date, there is no bus that plies inside the CBD. For Davao City, there is only one
approved route for city buses. This is the route from the CBD (District 1) to Calinan
(District 3) and it uses the Mintal-Tugbok National road. Tricycles only ply within tertiary
routes.
The Survey Area: Mintal-Tugbok-Calinan Route
Interestingly, among the many routes, only Mintal-Tugbok-Calinan National Road is
identified as the only route where all city public transport modes are available. This is
based from the city records provided by Office of the City Planning and Development
and Land Transportation Franchise and Regulatory Board (LTFRB Region XI), in-depth
interviews with local officials and ocular investigation. It is the only route which has a
city bus plying from the central business district (CBD) to other “barangays” (or a
village, the smallest administrative area in the Philippines) considered either rural or
residential and where all other types of public transport modes can be observed. This
area was in the 1996-2021 spatial development plan of Davao City. The plan
suggested that Calinan be built as the new center for agriculture-based industrial
activities and Mintal-Tugbok area as centre for technology, research and development
programs. Based from ocular inspection and Housing and Land Urban Regulatory
Board (HLURB) residential developers list, this is also the area where most of the
middle-class (define as the income group who could afford to own a house and/or
vehicle) private residential areas/villages can be found. There are two PUJ Terminals
(Mintal and Calinan) and one bus terminal in Calinan servicing passengers to and from
CBD. In most entrances of residential villages, tricycles and motorcycle taxis’ waiting
stops can be found.
Davao City’s spatial development strategy categorized the hierarchy of urban
settlements in Davao City into: (1) baranggay urban centers or baranggays mostly
located within the city’s agricultural or production areas; (2) district urban centers or
urban centers wherein the primary role is to act as second level service center for the
city’s rural population; and (3) Main Urban Center (“Poblacion” or the Central Business
District, CBD). Residential areas along this route were selected for conduct of
household and personal trip survey. The three baranggays; Catalunan Pequeno,
Sto.Nino and Mintal were specifically chosen since these three has the highest number
of household residential communities. Moreover, the other criterion for choosing the
survey area is that entrance of each residential area has tricycles and motorcycle taxis
terminal. One of the major issues in administering home visit surveys in a developing
country like the Philippines is the representativeness of the sample due to the absence
of household address records as well as household listings per income level; sampling
estimation of 20% (288 respondents) of the selected study site and questionnaire
design was based from the statistical results of earlier pilot survey research in 2006.
12th WCTR, Juli 11-15, 2010-Lisbon, PortugalIs the Use of Informal Public Transport modes in Developing Countries
Habitual? An Empirical Study in Davao City, Philippines
GUILLEN, Marie Danielle; ISHIDA, Haruo and OKAMOTO, Naohisa
SURVEY RESULTS AND INTERPRETATION
Profile of the Mintal-Tugbok Community
Survey results showed that eighty eight percent (88%) either fully-owned (44%) or are
still paying (44%) their houses (amortization). The rest of the household respondents
either rent or have other arrangements with house owners. Davao City Census
estimates that about twelve percent (12%) owned motorized vehicles (Census of
population and Housing, 2000). Table 3 shows the proportion of vehicle ownership
between non-motorized (bicycles) and motorized vehicles. The motorized vehicles are
classified into motorcycles and cars. 27% owned motorcycles type of vehicles, 20%
have car or four wheel vehicle and only 14% have bicycles.
Table 3. Type and No. of Vehicles in a Respondents’ Household
No. of Units HHs w/Bike % HHs w/MC/Tricycle % HHs w/Car/four %
wheel vehicle
0 332 85.57 282 72.68 308 79.38
1 40 10.31 94 24.23 65 16.75
2 13 3.35 11 2.84 13 3.35
3 1 0.26 1 0.26 2 0.52
4 2 0.52 0 0 0 0
Total 388 100 388 100 388 0
Note: HH-household Source: Guillen, M.D, 2007
Majority of the households belong to the PhP 8,000-15,000 income class category. To
be able to support a family of five for food and other needs in Region XI, the average
poverty threshold is PhP10, 503 (NSCB Technical Paper No.2000-002, 2000). The
survey results show that the average household size is five and this figure is
comparable to that of the Davao City latest census data.
At the individual level, out of 288 respondents aged 13 years old and above, 56 percent
is female and 44 percent is male and the median age is 34 years old. Most of the
respondents interviewed are either household head or spouse and the majority is
married. The survey shows that most of the respondents either completed college or
has college level education and that the majority of the respondents are either
employed on full-time status, followed by students and housewives (Table 4).
Table 4. Respondents’ Schooling/employment Status
Enrolled in School
Employment Status YES NO NR Total %
Full-time 1 132 1 134 34.54
Part-time 1 9 0 10 2.58
Self-employed 3 55 1 59 15.21
Unemployed 1 44 0 45 11.60
Housewife/husband 0 63 0 63 16.24
Student 62 0 4 68 17.01
NR 10 2 0 12 2.84
Total 78 308 6 389
% 20.10 79.38 1.55
Note: NR=No response Source: Guillen,M.D., 2007
12th WCTR, Juli 11-15, 2010-Lisbon, PortugalIs the Use of Informal Public Transport modes in Developing Countries
Habitual? An Empirical Study in Davao City, Philippines
GUILLEN, Marie Danielle; ISHIDA, Haruo and OKAMOTO, Naohisa
Respondents’ Commuting Patterns
Table 5 shows the estimated distance from the residential area of those respondents
who are in school or are employed. Majority of those working full-time and students go
to the CBD of Davao City and the distance varies from 9 to 15 km. The available public
transport modes use to reach the CBD are the taxis, buses or PUJs. Most of the
respondents (78%) are public transport users and that twenty six percent (26%) of the
respondents have driver’s license.
Table 5. On Respondent’s Workplace/School Location
Place of Work/School
nd
Status Mintal CBD 3rd 2 1st Out- NR NAP Total %
Dist Dist Dist side
Km from 3-8km 9- 10- 18- 20- 25 or
Origin 15km 18km 20km 25km more
Full-time 41 52 4 8 3 3 3 10 124 32
Part-time 0 2 0 0 1 2 5 0 10 3
Self- 16 20 3 0 1 1 14 2 57 15
employed
Not 0 0 0 0 0 0 0 45 45 12
employed
Housewife/h 0 0 0 0 0 0 0 63 63 16
usband
Student 32 37 5 0 1 0 1 0 76 20
NR 0 0 0 0 0 0 2 11 13 3
Total 89 111 12 8 6 6 25 131 388
% 23 29 3 2 2 2 6 34
Note: Dist.=:District; NR=No Response;NAP=Not applicable Source:Guillen, M.D., 2007
Respondents’ Transport Use 1 Week Recall
Table 6 presents the respondents’ estimated frequency of vehicle use over the last one
week from date of survey. For private use, motorcycle has the highest percentage
(48%) and for public transportation use, PUJs (89%) and tricycles (77%) have the
highest percentage. This is in terms of respondent’s estimated vehicle use over the last
one week.
Table 6 Estimated Frequency of One week use of Vehicle for Transport,2007
Transport Vehicle Use N % Ave. Gross Transport Net Vehicle Max. estimated
Estimated Use Estimated Transport Use
Use
Motorcycle 48 13.40 0.70 4 20
Car 23 6.40 0.26 8 14
Private Jeep 8 3.10 0.12 4 12
Bus 104 27.00 0.60 2 12
Taxi 164 42.40 0.90 2 13
PUJ 346 89.20 4.95 5 22
Tricycle 299 77.10 4.32 5 18
MC Taxi 127 32.66 1.57 4 14
Source:M.D. Guillen, 2008
12th WCTR, Juli 11-15, 2010-Lisbon, PortugalIs the Use of Informal Public Transport modes in Developing Countries
Habitual? An Empirical Study in Davao City, Philippines
GUILLEN, Marie Danielle; ISHIDA, Haruo and OKAMOTO, Naohisa
Respondents’ Actual Trip Information (Weekday & Weekend)
With regards to actual trip made by the respondents, table shows the weekday
(Wednesday or Thursday) and weekend (Saturday or Sunday) trip rates. Naturally,
there were more trips made on a weekdays than on weekend.
Table 7. Actual Trip Information: Weekday & Weekend, 2007
Weekday Trip Rate Weekend Trip Rate
Net Trip Rate Gross Trip Net Trip Rate Gross Trip Rate
Rate
Mean trip 2.14 1.64 2.1 0.76
Minimum trip 2 0 1 0
Maximum trip 6 6 4 4
Source: M.D.Guillen, 2008
Figure 7 and figure 8 showed the modal split by trip purpose. On both days, PUJs are
usually use for most trips. Motorcycle taxi use increase for “to-home” trips.
Interestingly, it was never use for “to-study” or school trips.
Figure 7. Survey Area’s Weekday Modal Split by Trip Figure 8. Survey Area’s Weekend Modal Split by
Purpose Trip Purpose
Source:M.D.Guillen, 2008
Figure 9 shows estimated trip length made per transport mode. This figure shows that
buses and PUJs are mostly used for long distance trips (10km or more) and tricycle
and MC taxis are usually used for short-distance trips. It is interesting to note that not
many respondents in the study area walked.
12th WCTR, Juli 11-15, 2010-Lisbon, PortugalIs the Use of Informal Public Transport modes in Developing Countries
Habitual? An Empirical Study in Davao City, Philippines
GUILLEN, Marie Danielle; ISHIDA, Haruo and OKAMOTO, Naohisa
Figure 9. Estimated Trip Length made by respondents
Source:M.D.Guillen, 2008
Access modes are also known as feeder-modes or vehicle use for short-distance trips
(1 to 3km) on the way to accessing or reaching major mode of transportation such as
bus or PUJ terminals. In the case of the Philippines, access modes are very common
and they usually service residential areas. Figure 10 shows the response of
respondents when asked if they use access modes to reach their major mode of public
transport.
Figure 10 Use of Access Modes
Source:M.D.Guillen, 2008
More respondents use access modes on weekday than on weekend. Majority of the
respondents walk to their next major mode. In the case of “others” mode, this would
mean that other respondents, may take a private vehicle going to their next major
mode.
Respondents’ Public Transport Quality of Service Evaluation
Respondents were asked to evaluate the quality of service of the different public
transport based on nine (9) items indicators from 1 to 4 (very bad to very good). The
quality of service indicators are 1.) Network coverage; 2.) Convenience;
12th WCTR, Juli 11-15, 2010-Lisbon, PortugalIs the Use of Informal Public Transport modes in Developing Countries
Habitual? An Empirical Study in Davao City, Philippines
GUILLEN, Marie Danielle; ISHIDA, Haruo and OKAMOTO, Naohisa
3.) Affordability; 4.) Riding Comfort; 5.) Speed; 6.) Driver’s Attitude and Personality;
7.)Safety and security; 8.) Vehicle Design and Features and 9.) Vehicle Noise and
Pollution as explained in the methodology.
Public Transport Dependency: Respondents’ Actual Transport Trip Recall
One-week transport use recall as well as actual weekday and weekend transport use
was used in confirming the public transport dependency of the community. Table 8
shows that PUJs and tricycles are the most frequently use public transport service in
the community with the net average use of 5 times a week).
Table 8. Trip Recall:Frequency of One Week Use of Public Transport Mode
Ave. Gross Net Vehicle Max.
Transport Estimated estimated
Public Transport Mode Use N %
Estimated Use Use Transport
Use
2
Bus 104 27.00 0.60 12
2
Taxi 164 42.40 0.90 13
5
PUJ 346 89.20 4.95 22
5
Tricycle 299 77.10 4.32 18
4
MC Taxi 127 32.66 1.57 14
Source: M.D.Guillen, 2008
This result confirms that majority of respondents are public transport users even if
almost half of respondents’ households owned vehicle. This can be explained by the
figures that show that the average household size in the study area is five and that
individual household members make their own trips. In terms of mobility, this could
imply that household members do not car pool or share the vehicle for their trips and
usually rely on the available public transport mode in the area, which would most likely
be the PUJ. It is also important to note that for short-distance trip like 0.2-3 kms., the
survey showed that most respondents take public transport mode unlike in developed
countries such as Japan where the tendency is to use a bicycle or walk.
Public Transport Dependency Perception: Testing Various Relationships to
Understand Public Transport Dependency
Coefficient of Variance (CV): Testing the Consistency of Respondent’s Public
Transport Dependency Perception (Personal, Household and Community)
In testing the consistency of respondents’ public transport dependency perception, the
coefficient of variance test was used to determine if the community have varied or
similar assessment of dependency towards certain public transport mode. CV is used
to check the consistency of dependency response across all respondents-subjects. A
high CV value reflects inconsistency of dependency perception among the samples
within a group. Table 9 shows the CVs among different modes and at different levels
12th WCTR, Juli 11-15, 2010-Lisbon, PortugalIs the Use of Informal Public Transport modes in Developing Countries
Habitual? An Empirical Study in Davao City, Philippines
GUILLEN, Marie Danielle; ISHIDA, Haruo and OKAMOTO, Naohisa
(personal, household and community).CVs consistently decrease from personal, to
household and to community level across modes. This can indicate the consistency of
the measurement that perception of dependency to particular public transport mode
which is higher than the personal level. For example, respondents generally have lower
dependency assessment to formal modes like bus but personal evaluation of how a
respondent think of his/her household members and community dependency increases.
Table 9. Coefficient of Variation Per Public Transport Modal Classification
Respondent's Dependency Perceptions Mean SD CV CV%
Formal Public Transport Personal Dependency 2.27 0.777 0.342 34.23
Formal Public Transport Household
Dependency 2.44 0.750 0.307 30.74
Formal Public Transport Community
Dependency 2.67 0.755 0.283 28.28
Indigenous PT Personal Dependency 3.03 0.826 0.273 27.26
Indigenous PT Household Dependency 3.08 0.787 0.256 25.55
Indigenous PT Community Dependency 3.23 0.754 0.233 23.34
Informal PT Personal Dependency 2.27 1.086 0.478 47.84
Informal PT Household Dependency 2.25 1.051 0.467 46.71
Informal PT Community Dependency 2.49 1.034 0.415 41.53
Note: SD –Standard Deviation, CV-Coefficient of Variance PT- Public Transport Source:M.D.Guillen,2008
As expected based on detailed CV results per public transport mode, indigenous public
transport mode has the lowest CV% of public transport dependency perception
indicating the consistency of how respondents view their dependency to these modes
and confirms the dependency or the habit of using PUJs, and tricycles. Varying
perceptions for informal mode is quite clear given the high CV%. These results imply
the cognitive gap between personal opinions and how an individual think about his/her
household and community needs regarding public transport. The mean or average
results of dependency perception shows that public transport dependency differs but
generally increases as an individual think of community’s dependency. In particular the
result of the informal mode where in the average household dependency is lower than
personal and community dependency indicates the varying perceptions on the
dependency to informal modes like “habal-habal” or motorcycle taxis. This suggests
questionable need at household level but is considered important at community level.
This kind of results indicates the need for policy makers to strongly address this issue.
Actual Public Transport Use vs. Subjective Public Transport Dependency Perception:
Testing the Independency of Personal, Household and Community Public Transport
Dependency with Public Transport Use over the week: t-test
This test shows that the independency of respondents’ perception of dependency and
how this affects his/her household and community perception from the respondent’s
actual use of the available public transport mode in the area. Table 10 shows that
12th WCTR, Juli 11-15, 2010-Lisbon, PortugalIs the Use of Informal Public Transport modes in Developing Countries
Habitual? An Empirical Study in Davao City, Philippines
GUILLEN, Marie Danielle; ISHIDA, Haruo and OKAMOTO, Naohisa
indigenous and informal public transport use has an effect on how an individual
perceive his/her dependency to these modes. Given the significant values (> 0.5) in the
formal modes, it presents that the use of the formal modes (bus and taxis) does not
affect how dependency perception is evaluated. This result suggests that respondents
think that the need for formal modes (bus, taxis) remains even if they do not
necessarily use it. This kind of result has a direct policy implication on how policy
makers considers bus system improvement and or reconsider how to address informal
public transport modes such as MC taxis.
Table 10. Public Transport (PT) Users vs Non-users:PT Category t-test Results
Sig. (2-
N Mean Std. Deviation t-test tailed)
Formal PT Dependency Formal Public Transport (PT) User
Formal PT Personal >= 1 195 2.31 0.6730
Dependency
= 1 195 2.37 0.6950
Formal HH Dependency
= 1 194 2.61 0.6980
Formal Community Dependency
= 1 350 3.11 0.7830
Dependency
= 1 350 3.12 0.7550
Indigenous PT HH Dependency
= 1 348 3.27 0.7280
Dependency
= 1 126 2.79 1.0090
Dependency
= 1 126 2.61 1.0120
Informal PTHH Dependency
= 1 125 2.98 0.8030
Dependency
=1 Public Transport (PT) Mode User;Is the Use of Informal Public Transport modes in Developing Countries
Habitual? An Empirical Study in Davao City, Philippines
GUILLEN, Marie Danielle; ISHIDA, Haruo and OKAMOTO, Naohisa
shows high cronbach’s alpha index that shows the reliability of the items to assess the
quality of service of each category where the public transport mode belongs
Table 11. Test of Reliability for Quality of Service (QoS) Evaluation
Categories of Road-based Public Transport Modes Cronbach’s Alpha
Formal Public Transport modes (Bus, taxi) 0.835
IPTS modes (PUJ, tricycle) 0.901
Informal modes (MC taxis 0.930
Source:M.D.Guillen, 2008
Figure 11 shows how the respondents evaluated the road-based public transport
modes when the modes in each category are combined. As shown, the rating for
informal public transport (mc taxis) is not very favourable.
Figure 11. Respondents QoS Evaluation of Public Transport Modes/Category
Source:M.D.Guillen, 2008
Testing the Hypothetical Framework of Public Transport Dependency Indicators
Testing the relationships in the hypothetical framework proposed is shown by using
AMOS (Analysis of Moment Structures) software for the structural equation modeling
which presents the regression and path analyses.
In this analysis, 1) the overall quality of service scores per category after testing its
reliability, 2) the personal dependency perceptions and the 3) average number of the
one week frequency of use for each public transport mode category were used.
The following variables were used as the independent or exogenous variables:
respondents’ socio-economic variables such as estimated household monthly income,
household size, number of vehicles in a household, age, dummy variables (0,1) such
12th WCTR, Juli 11-15, 2010-Lisbon, PortugalIs the Use of Informal Public Transport modes in Developing Countries
Habitual? An Empirical Study in Davao City, Philippines
GUILLEN, Marie Danielle; ISHIDA, Haruo and OKAMOTO, Naohisa
as gender and driver’s license and the attitude towards the overall-all quality of service
of each public transport modal categories (formal, indigenous, informal). The
endogenous (dependent) variables that this model attempted to explain are the public
transport dependency or “habit” (as considered in this study) of using formal public
transport modes, indigenous public transport modes and informal public transport
modes and that of predicting the actual frequency of use of the formal, indigenous and
informal modes.
This analysis yielded the following path and regression analysis with a model fit
summary of CFI (Comparative Fit Index): 0.755 and RMSEA (Root Mean Square
Error of Approximation): 0.043. These results indicate good model fit. AMOS path
analysis (Figure 12) shows the parameters that estimate the direct affect of one
variable has on the other and the indirect effects or the influence of one variable may
have on another that is mediated through a third variable as shown in the arrows. The
path analysis shows that gender has direct effect (0.12) on the use of formal public
transport mode (bus and taxi) and can be interpreted that women are most likely to use
formal public transport mode like taxis. On the other hand, age has negative direct
effect (-0.11) on the “habit” or of using IPTS or perceived dependency to (PUJ and
tricycle) as well as on the actual use of informal public transport mode (mc taxis). The
older the person, the less likely will he/she have the habit of using IPTS or informal
modes.For the quality of service evaluation, formal (0.15) and informal public transport
modes (0.16) has direct effect on the habit of using it. Positive or negative evaluation
on the quality of service in these modes has an effect on the dependency perception
(habit) of a person towards a particular mode.
12th WCTR, Juli 11-15, 2010-Lisbon, PortugalIs the Use of Informal Public Transport modes in Developing Countries
Habitual? An Empirical Study in Davao City, Philippines
GUILLEN, Marie Danielle; ISHIDA, Haruo and OKAMOTO, Naohisa
.12 .14 -.39
HHIncome HHsize noHHVeh Age Gender DLicense
e1 .12 e4
-.11
.15 .11
Formal PT QoS Eval FPT Dep FM PT Use
.20 Eval
e2 -.10 e5
.25
IPTS Qos Eval IPTS Dep IPTS Use
.27 -.11
e3 e6
.16 .31
Informal QoS Eval INFORMAL Dep Informal PT Use
Figure 12.Analysis of Moment Structures (AMOS) Regression and Path Analysis Result
Source: Guillen, M.D., 2008
The quality of service evaluation has direct effect on how the respondent evaluate
his/her formal and informal public transport habit (dependency) and has an indirect
effect on the frequency of use (may be cause by some item/s positively evaluated by
the respondent, hence make him/her choose the mode regularly).Informal quality of
service evaluation has negative indirect effect (0-.11) on the use of IPTS modes and
which indicates lower QoS evaluation to informal mode and the likelihood of using IPTS
modes
The model also analysed the correlation of socio-economic factors or the strength of
relationships between two variables. In this figure, estimated household monthly
income has a correlation with the number of vehicles a household have (0.12) and that
household size also has a correlation with the number of vehicles in a household
(0.14). The relationship of household income and household size with the number of
vehicles owned by the household has been verified in various studies. Vehicle
ownership is a function of the capability to purchase a vehicle as well as the number of
members in a household. Gender has no relationship (-0.39) on respondents having
driving license. Gender is not an issue in getting a drivers’ license. The quality of
service evaluation on formal modes has a correlation with quality of service evaluation
on indigenous modes attitude (0.20). The correlation of the overall quality of service
12th WCTR, Juli 11-15, 2010-Lisbon, PortugalIs the Use of Informal Public Transport modes in Developing Countries
Habitual? An Empirical Study in Davao City, Philippines
GUILLEN, Marie Danielle; ISHIDA, Haruo and OKAMOTO, Naohisa
attitude between formal public transport mode with indigenous public transport mode
and the overall quality of service attitude between indigenous mode and informal mode
can indicate that respondents regard indigenous modes to have an almost similar
quality of service with that of formal and informal modes. The quality of service
evaluation on indigenous mode has a correlation with the attitude towards informal
modes (0.20). There was no correlation indicated between the formal and informal
public transport mode and this provides an insight on how the respondents regard the
difference between formal and informal mode.
Given that the respondents belong to the middle-class socio-economic strata with the
capability to own a house and/or vehicle and from this analysis, it can be interpreted
that only the respondents’ personal characteristics showed direct relationship in
predicting the use of public transport modes. The path analysis shows that only gender
and age among the socio-economic factors has causal relationships with the use of
formal public transport modes (bus, taxis) ,indigenous public transport dependency
(habit) and informal public transport modes (mc taxis), respectively. Such as women
are most likely to use formal modes and that age is factor in dependency perception
and actual use. Younger population (-11) would mean the likelihood to use informal
modes (mc taxis).
SUMMARY, CONCLUSIONS AND RECOMMENDATIONS
Public transport dependency is defined here as the objective (actual use) and the
subjective (habit-forming definition) reliance to the available road-based public
transport modes in emerging metropolitan cities like Davao City.
The structural equation model confirms the over-all hypothetical framework on the
relationships of socio-economic factors, over-all quality of service evaluation and the
role of personal dependency assessment or “habit” and its likely relationship in the
actual use of public transport mode. However, contrary to the hypothetical framework
which shows that household variables (income, size, no. of vehicles in the household)
as possible factors, only the individual characteristics (age and gender) showed strong
direct relation on the personal dependency (or habit) of using indigenous modes (PUJ,
tricycles) and its direct relation on predicting the use of formal modes and informal
modes. These findings made sense since women are most likely to use formal modes
(bus, taxis) and can be inferred that the mode is considered to be safer. The younger
the respondent is the stronger likelihood of using informal public transport mode such
as tricycles. The findings suggest the role of rational behaviour concept where in the
individual socio-economic factors affect the modal choice decision. Interestingly, quality
of service evaluation played a direct role in the dependency to formal public transport
modes and informal public transport modes and the indirect role in the use of both
modes. The study shows the relationship of personal dependency assessment or
12th WCTR, Juli 11-15, 2010-Lisbon, PortugalIs the Use of Informal Public Transport modes in Developing Countries
Habitual? An Empirical Study in Davao City, Philippines
GUILLEN, Marie Danielle; ISHIDA, Haruo and OKAMOTO, Naohisa
“habit” and the use of indigenous modes (PUJ, tricycles) and confirms the previous
theory suggesting the role of habits and “mere exposure” effect. Moreover, in informal
modes, the quality of service can have indirect relationship to the use of indigenous
modes (PUJs, tricycles) from informal modes (mc taxis).
It also showed indigenous public transport mode’s role in the community, in a sense
that the personal assessment of dependency (habit) has direct relation to the actual
use of indigenous public transport modes more than the associated issues in the
quality of service evaluation. The PUJ or jeepney somehow mirrors the Filipino’s
identity which is said to be a result of the history. It is important to note that PUJs and
tricycles have been existent for a long time and has been part of the everyday life of
average Filipinos such that its use can be habitual.
.
Actual trip characteristics data also show that formal modes esp. buses are use for
long-distance trips competing with PUJs while informal modes like the MC taxi are use
for short-distance trips competing with tricycles. Mostly the latter mode also served as
access modes. This result suggests the existing gap between supply and demand that
need to be addressed. On the other hand, it is important to note the result of overall
quality of public transport service and the t-test with regards to actual use and
dependency perception to bus suggest a positive perception given to bus system.
Policy makers should take into consideration that bus system is generally regarded
highly, regardless of whether the mode is use or not and even if its quality of service is
not highly rated. Interestingly with formal modes, even if the personal dependency
perception is low at personal level, community perception gets higher. The perception
of community dependency indicates that it is needed (community perception).
Interestingly, motorcycle taxis or informal modes are mostly use for very short-distance
trips. This kind of output has an impact how the community could regard the possible
existence of non-motorized policy eg. the importance of non-motorized infrastructure,
promotion of walking and cycling for healthy lifestyle.
Moreover, given study area’s sampling limitation and that half of the household
population own vehicles the structural analysis reveals that the role of habit (public
transport dependency) is quite strong. This indicator can actually be verified by the fact
that most of the respondents use public transport modes even for short-distance trips.
In a way, this result confirm what was proven in other psychological and social science
based studies in developed countries that suggest that habitual actions are cued
without consulting conscious intentions. The case study result has similarities with
previously explained in studies in developed countries where case studies suggest that
drivers repeated their prior actions regularly. In this case study, residents are
dependent to indigenous public transport modes even for very short-distance trips.
These findings suggest that careful review of key detailed issues such as the overall
quality of service level and the associated items regarding indigenous public transport
modes must be done before going into any specific policy or planning interventions. As
12th WCTR, Juli 11-15, 2010-Lisbon, PortugalIs the Use of Informal Public Transport modes in Developing Countries
Habitual? An Empirical Study in Davao City, Philippines
GUILLEN, Marie Danielle; ISHIDA, Haruo and OKAMOTO, Naohisa
proven in many studies, it is important to note that habits are not easily altered. In this
case, improvement on the quality of service of indigenous public transport mode should
be considered.
REFERENCES
Allport, R. (2000) A Review of Transport and the Urban Poor. World Bank, Washington,
D.C.
Ajzen,I.(1988) Attitudes, Personality and Behavior. Dorsey Press, Chicago
Ajzen, I. (1991) The Theory of Planned Behavior. Organizational Behavior and Human
Decision Processess 50. pp.179-211
Aarts, H. and Ap, D.(2000) Habits as Knowledge Structures: Automaticity in Goal-
Directed Behavior.Journal of Personality and Social Psychology Vol.78 No.1
pp.53-63
Arbuckle, J.(2006).Amos 7.0 User’s Guide.SPSS Inc. ,Chicago,IL
Cambridge Systematics Inc. (1996). Travel Survey Manual for US Department of
Transportation and US Environmental Protection Agency. New Jersey
Cervero, R.(2000) Informal Transport in the Developing World . HABITAT, Naorobi
City Government of Davao.(2007).http://www.davaocity.gov.ph
Davao City Census of Population and Housing (2000).Report No.2-36 K Volume 1 –
Demographic and Housing Characteristics. National Statistics Office.Manila
Davao Map and City Guide (2003) Department of Tourism. Davao City
Fujii,S. and Garling,T. (2003) Application of Attitude Theory for Improved Predictive
Accuracy of Stated Preference Methods in Travel Demand Analysis.
Transportation Research Part A 37 pp.389-402
Garling,T. and Fujii,S.(2002) Structural Equation Modeling of Determinants of
Planning.Scandinavian Journal of Psychology 43 pp.1-8
Grava, S.(2002) Urban Transportation Systems: Choices for Communities. Mc Graw
Hill, New York
Guillen,M.D, Ishida, H., Okamoto, N., and Morito, T.(2007) Public Transport Policies
and the Road-based Public Transport Service in Developing Countries: The
Case of Indigenous Public Transport Modes in Davao City, Philippines.
Proceedings of the Eastern Asia Society for Transportation Studies Vol.6
Guillen,M.D. (2008) Understanding the Informal Public Transport: The Case of
Indigenous Public Transport System in Davao City, Philippines.Ph.D.
Dissertation, University of Tsukuba
Ishida,H. , Kurokawa,Takeshi (1991) “The Effects of Perception and Feeling Variables
on Mode Choice Behavior in Metro Manila”. Proceedings of Infrastructure
Planning No.14 (2) pp.125-132
Iwata, S.(1995) Development and Sustainability of Public Transportation in Southeast
Asian Cities, Journal of the Eastern Asia Society for Transportation Studies 1(2)
pp.547-564.
12th WCTR, Juli 11-15, 2010-Lisbon, PortugalIs the Use of Informal Public Transport modes in Developing Countries
Habitual? An Empirical Study in Davao City, Philippines
GUILLEN, Marie Danielle; ISHIDA, Haruo and OKAMOTO, Naohisa
Japan International Cooperation Agency (1981) DCUTCLUS: Davao City Urban
Transport cum Land Use Study. Davao City, Philippines
Loayza, N. (1997). The Economics of the Informal Sector: A simple model and some
empirical evidence from Latin America.The World Bank Policy Research
Working Paper Series,1727,Washington D.C.
Mokhtarian,P.,Salomon,I. and Redmond L.S. (2001) Understanding the Demand for
Travel:It’s not Purely Derived.Innovation Vol.14 No.4 Interdisciplinary Centre for
Comparative Research in Social Sciences.U.S
National Center for Transportation Studies Foundation (2000).Transportation and
Traffic Management Plan for Davao City Final Report. Diliman,Quezon City
Newman, P. and Kenworthy, J. (1999). Sustainability and Cities: Overcoming
Automobile Dependence. Island Press, Washington D.C
Ocampo, R.(1982). Low-cost Transport in Asia: A Comparative Report on Five
Cities.IDRC-183.Canada
Taniguchi, A., Fujii, S. and Hara, F.(2005) Promotion of a Public Transport by Mobility
Management and Verification of its Quantitative Effect:A Case Study for
Community Bus in Obihiro City. Proceedings of the Eastern Asia Society for
Transportation Studies. Vol.5.
Tri,J. B. and Kubota, H. (2007) User satisfaction with paratransit in competition with
motorization in Indonesia: Anticipation of future implications.Transportation 34,
pp.337-354
Rahman, M.S. (2007). Determining Appropriate Public Transport System Given the
Level of Development/Urbanization: The Case of Siquijor Province,
Philippines.Proceedings of 11th World Conference on Transport Research in CD
rom.
Redmond, L.(2000) Attitude, Personality and Lifestyle Characteristics as Related to
Travel. ITS-Davis Publication. NO UCT-ITS-RR-00-15
Rhodes,R.E and Courneya, K.S. (2003) Modelling the Theory of Planned Behavior and
Past Behavior.Psychology, Health and Medicine Vol.8 No.1
Verplanken, B. and Wood, W.,(2006) Interventions to Break and Create Consumer
Habits. Journal of Public Policy and Marketing Vol.25.1 pp.90-103
12th WCTR, Juli 11-15, 2010-Lisbon, PortugalYou can also read