Is rising corporate debt a problem? Not necessarily - Deloitte
←
→
Page content transcription
If your browser does not render page correctly, please read the page content below

CFO Insights
                                                                                                                       August 2021

Is rising corporate debt a problem?
Not necessarily.
Before COVID-19 hit US shores, the country   There is, however, a fair bit of variability in   Assessing the 2020 debt binge
was experiencing the longest economic        debt levels among companies. Analysis of          At the end of 2020, the total debt
expansion on record. As it happens every     company-level data3 reveals that some of          outstanding for nonfinancial5 businesses in
time things go well, many economists and     the largest companies, especially those in        the United States was about $17.7 trillion.
financial analysts began hypothesizing       information technology, communication             Between 2010 and 2019, debt grew at an
about what could go wrong.                   services, and health care, have been              average annual rate6 of 5.5%, but in 2020,
                                             leading the debt binge since 2010.                growth jumped to 9.1%.
One of the suspected triggers for the next
                                             Fortunately, this group appears to be
recession (because no one was predicting                                                       The surge was likely due to at least one of
                                             better placed in its ability to repay debt
a pandemic it seems) was the high level                                                        three factors. First, some businesses were
                                             than its counterparts in other sectors.
of corporate debt.1 Corporate debt has                                                         forced to borrow more to keep operations
been edging up since 2010 as the economy     Rising debt in an expanding economy with          running as large parts of the economy
recovered from the previous recession.       low interest rates may not necessarily be         slowed or shut down. Second, some
And by Q3 2019, outstanding debt of the      a bad thing if companies are increasing           businesses had to invest in technology to
nonfinancial business sector, including      investments as well. And in this issue of CFO     support remote work, while others had to
corporates, had reached new highs            Insights, we’ll explore whether investments       reconfigure workplaces to ensure social
compared to the size of the economy.2        are keeping pace with rising debt4 and why        distancing. Finally, not all businesses were
The pandemic then became a catalyst in       some of those investments may well add to         worse off due to COVID-19. Key businesses
pushing debt even higher.                    productivity growth in the wider economy          in sectors such as information technology,
                                             in the medium- to long-term.                      health care, consumer products, and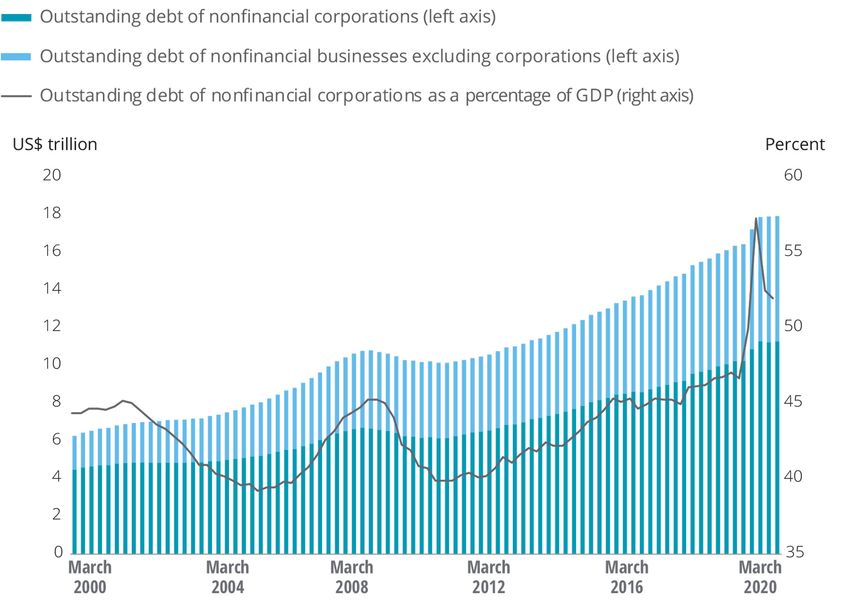
Is rising corporate debt a problem? Not necessarily.

communication services, witnessed                      Figure 1. The nonfinancial corporate-debt-to-GDP ratio is higher than it was before
strong demand, a trend that is likely to be            the pandemic
sustained at least in the near- to medium-
term. Consequently, some of these
businesses likely borrowed more to expand
the size and array of goods and services
they produce.

No matter the reason, rising leverage last
year added to already high levels of debt.
In Q3 2019, for example, nonfinancial
business debt outstanding was about
75% of GDP, the highest ever at that time.
With GDP declining sharply in Q2 2020, the
debt-to-GDP ratio shot up during
the quarter, before going down as an
economic recovery took shape in the
second half of the year. But, at 82.4% at
the end of 2020, overall debt relative to
the size of the economy is still high even by
prepandemic standards.

Of all the debt outstanding of nonfinancial
businesses, corporates account for the
largest share—about 63% in 2020. And just
                                                       Source: United States Federal Reserve (sourced through Haver Analytics); Deloitte Services LP
like total nonfinancial business sector debt,
                                                       economic analysis.
corporate debt—both the level
and size relative to GDP—has been edging
up since 2010. The pandemic has made it a
                                                       by market value as of April 2021 from S&P                 economy, debt for the 1,000 companies
tad worse than what it was in 2019
                                                       Capital IQ.7 We first ranked companies                    in our research universe increased at a
(see Figure 1).
                                                       in descending order of market value and                   faster pace in 2020 (14.5%) compared to
Decoding the drivers of corporate debt                 then created five cohorts: top-10, 11–50,                 the year before (8.5%).
and corporations’ ability to repay                     51–100, 101–500, and 501–1,000. Top-10
                                                                                                                 Analysis of the data by cohorts reveals
Which companies have been driving the                  refers to the 10 highest valued companies,
                                                                                                                 that the top 50 companies by market
debt binge? Which companies are well-                  11–50 refers to the group of 40 companies
                                                                                                                 value are leading the debt surge. Between
placed financially to repay this debt? And             that follow the top-10, and so on. We
                                                                                                                 2010 and 2019, the share of the top-10 in
what has been the effect on investments?               also organized the data by sector and
                                                                                                                 total debt for the 1,000 companies more
                                                       analyzed trends in debt, ability to pay, and
To find out, we looked at key financial data                                                                     than doubled to 5.7%, before declining
                                                       investments for the 10 primary sectors in
for the top 1,000 nonfinancial corporations                                                                      slightly last year. During this period, the
                                                       which these 1,000 companies operate.
                                                                                                                 share of the 11–50 cohort also rose, but
                                                       Here are the three trends we identified:                  at a slower pace than the top-10. This
                                                                                                                 broad trend in rising shares for the 50
                                                       • As the economy changes, so                              largest companies, taken together, has
                                                         do companies that drive debt                            mostly been at the expense of the 51–100
                                                         accumulation. Since 2000, total long-                   cohort (see Figure 2). Figure 2 also reveals
                                                         term debt for these 1,000 companies                     that a mere 5% of these 1,000 companies
                                                         has grown at 9.2% on average per year                   accounted for 30.7% of the group’s total
                                                         to $5.8 trillion in 2020. More debt was                 long-term debt, much higher than what
                                                         accumulated since 2010 compared to                      the share was 10 years ago.
                                                         between 2000 and 2010. For example,
                                                         between 2010 and 2019, long-term debt                   Three sectors—information technology,
                                                         grew at an average annual rate of 9.7%,                 communication services, and health
                                                         higher than the 8.2% rise between 2000                  care—have been leading debt growth
                                                         and 2010. And in line with the trend for                since 2010 , corresponding to these
                                                         total nonfinancial corporate debt in the                sectors’ growing prominence in the wider

2
Is rising corporate debt a problem? Not necessarily.

    business activity. The average annual              Figure 2. Top 5% of the 1,000 companies analyzed accounted for 30.7% of total debt
    growth in long-term debt in 2010–2019              for th group
    for information technology was 20.1%,              Shares in total long-term debt of the top 1,000 nonfinancial corporations (percent)
    while for communication services, it
    was 13.4%. Beyond that, these sectors
    rapidly increased their debt even during
    the pandemic. Rising debt for these
    sectors isn’t surprising given that in
    the top-10 cohort, four companies are
    from information technology, two from
    communication services, and one from
    health care. And in the 11–50 cohort,
    65% of companies are from these three
    sectors.

• Ability to repay debt has deteriorated
  for all companies, except very
  large ones. For most groups of
  companies, rising debt has accompanied               Source: S&P Capital IQ; Deloitte Services LP economic analysis.
  deteriorating ability to repay. The ratio
  of net debt to earnings before interest,
  taxes, depreciation, and amortization                  other than the top-10 in 2020, with the                  debt, it should be a positive trend for the
  (EBITDA) has been increasing since the                 quantum of decline being the highest for                 economy. If not, this high level of debt
  early- and mid-2010s. Worryingly, in                   the 101–500 cohort. While low interest                   may become a problem.
  the pandemic, earnings dropped even                    rates helped in keeping interest expenses
  as debt increased, thereby denting                     in check for all cohorts last year, it was               But data on investments by these 1,000
  companies’ ability to repay debt. For                  the sharp fall in earnings that dented                   companies reveals that overall capital
  example, EBITDA declined by 18.2% for                  some cohorts’ interest coverage ratio.                   expenditure (capex) hasn’t kept up with
  the 501–1,000 cohort and by 16.7% for                  For example, EBIT fell by 40.3% last year                debt growth. Between 2010 and 2019, for
  the 101–500 group in 2020. The top-10                  for the 501–1,000 cohort and by 28.5%                    example, capex grew by 6.7% on average
  cohort, however, appears to be better                  for the 101–500 group. And, as with net-                 per year, lower than the corresponding
  placed than others in its net-debt-to-                 debt-to-EBITDA ratio, larger companies                   growth in long-term debt (9.7%). And even
  EBITDA ratio.                                          as a group seem to be better placed than                 as debt grew in 2020, capex fell by 9.4%—
                                                         their smaller counterparts in terms of                   although there is quite a bit of variation
    In 2020, EBITDA declined the most for                interest coverage. For example, in 2020,                 within company cohorts. The top-10
    energy (42.7%)—most likely due to a                  the interest coverage ratio for the top-10               group, which has led debt expansion,
    sharp drop in oil prices last year—and               was 24.3, much higher than the 1.9 ratio                 has also increased capex faster than
    industrials (33.8%). This, in turn, ensured          for the 501–1000 cohort.                                 others. This group is the only cohort that
    that their net-debt-to-EBITDA ratios                                                                          increased capex amid the pandemic and
    deteriorated sharply, given that net debt            Among key sectors, information                           at a healthy pace. Oddly, the 11–50 group,
    soared. The rise in the ratio for industrials        technology had the highest interest                      which like the top-10 contributed strongly
    reverses the improvement since 2009.                 coverage ratio in 2020, unchanged from                   to overall debt expansion between 2010
    The oil industry witnessed a sharp drop              the previous year. The number, however,                  and 2019 (and 2020), witnessed slower
    in earnings in 2020 due to falling oil prices        has gone down sharply over the years.                    capex growth on average during this
    that year, likely contributing to declining          The energy sector witnessed a similar                    period compared to 2000–2010.
    net-debt-to-EBITDA for the overall                   trend. With earnings being hit in 2020,
    energy sector. Oil also faces medium-                most sectors saw declines in the interest                Capex growth has been the highest since
    to long-term growth challenges due to                coverage ratio. The energy sector was the                2010 for the consumer discretionary,
    climate change and efforts worldwide to              worst hit.                                               information technology, and health
    transition away from fossil fuels.                                                                            care sectors, while it has contracted for
                                                       • Capital expenditure hasn’t kept
                                                                                                                  energy. In fact, capex fell by a staggering
    The pandemic also curbed companies’                  pace with debt, with 2020 being an
                                                                                                                  38.3% last year for energy, a contrast to
    ability to pay interest on their debt.               especially bad year. The question to ask
                                                                                                                  strong growth in long-term debt for the
    The interest coverage ratio, a ratio of              here is whether this debt surge has been
                                                                                                                  sector that year.
    earnings before interest and taxes (EBIT)            matched by an increase in investments.
    to interest expenses, fell for all cohorts           If investments have grown in line with

3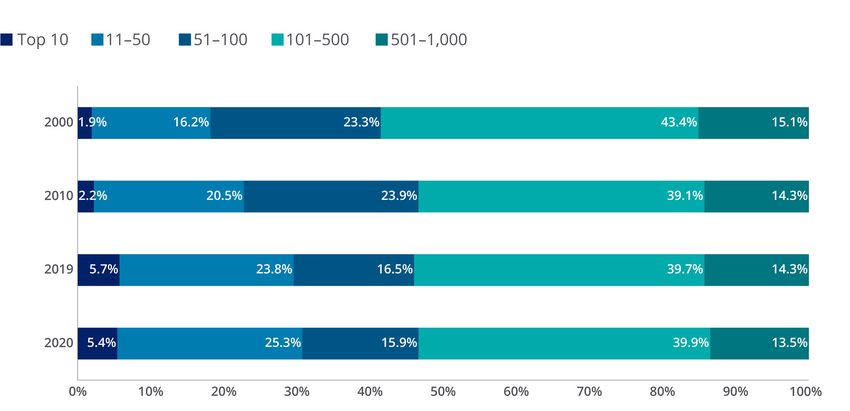
Is rising corporate debt a problem? Not necessarily.
So, is rising debt a problem? Product Accounts data. According to this challenges posed by COVID-19.9 Investment
The capex trend in 2020 could well give government data, investment in structures in software did not see explosive growth,
a misleading impression of the most was particularly hard hit in 2020 and that but after falling in Q2 2020, this investment
important trends in economywide business continued into 2021. Since structures class has been growing faster than its
investment and, therefore, a misleading are not a type of investment closely prepandemic rate.
impression of the direction of future associated with productivity improvements,
In such a low interest-rate environment,
productivity growth. a decline in this type of investment is not
higher debt levels are not necessarily a bad
very concerning from the perspective of
First, capex includes investment in thing, although we are concerned about
potential economic growth.
structures (which are not closely associated a deterioration in the ability to repay. The
with productivity improvements), as well as But two types of investments closely ultimate impact on the economy and the
in maintenance. Second, although business associated with the economy’s productivity businesses themselves hinges on how this
investment fell in the first half of 2020, growth—investment in information debt is used. We know that CFOs continue
the types of business investment most processing equipment (including to be bullish toward debt financing, with
closely tied to productivity growth staged a investment in computers, communications, 92% of them viewing it as “attractive”
remarkable recovery in the second half that medical, and accounting equipment) and in the latest CFO Signals™ survey (see
has continued into the first quarter of 2021. investment in software—expanded rapidly sidebar, “How CFOs view debt and equity
during the pandemic. In fact, after falling financing”). And preliminary data suggests
For a more detailed picture of what new
in Q1 2020, investment in information some of the investments that they and their
investments businesses are making
processing equipment exploded as companies are making are smart ones—
(albeit without the size or sector detail8),
businesses worked to adapt to a host of the kind that will augment productivity in
we turn to the US National Income and
the future.
How CFOs view debt and equity financing
Each quarter, the CFO Signals™ survey asks respondents for At the same time, CFOs continue to maintain a strong risk
their views of both debt and equity financing, as well as risk appetite. In Q2, the percentage of CFOs saying now is a good
appetite. time to be taking greater risk dipped slightly from 66% in Q1
2021 to 65%. Nevertheless, the percentage hovers just slightly
Not surprisingly, given ongoing low interest rates, debt
under the high point of 69% in Q1 2018. The 65% of CFOs who
attractiveness remained high at 92% in Q2 2021. That was just
say now is good time to be taking greater risk far exceeds the
above the 91% reported in Q1 and just below the survey high of
27% of CFOs who said so in Q2 2020. The 35% of CFOs who
92.7% in Q1 2015. The breakdown between public and private
say now is not a good time to be taking greater risk, however,
companies in Q2 was 71% and 29%, respectively.
might reflect some cautiousness toward the ability to resume
As for equity financing, CFOs’ views on its attractiveness moved pre-pandemic levels of operations, as well as concerns over the
up slightly, from 55% in Q1 2021 to 56% in Q2. Among public possibility of inflation, which was often cited as a worrisome risk
companies, 77% of CFOs viewed equity financing as attractive, in the second quarter.
and among private companies, 23% saw it as attractive. There
was little variation among industries.
Figure 3. Both debt and equity financing remain attractive to CFOs; however, equity is viewed as comparatively less attractive.
Percent of CFOs citing debt and equity attractiveness (both public and private companies)
100%
Debt attractive 92%
80%
60%
56%
Equity attractive
40%
20%
0%
4Q14
1Q15
2Q15
3Q15
4Q15
1Q16
2Q16
3Q16
4Q16
1Q17
2Q17
3Q17
4Q17
1Q18
2Q18
3Q18
4Q18
1Q19
2Q19
3Q19
4Q19
1Q20
2Q20
3Q20
4Q20
1Q21
2Q21
Source: CFO Signals, Q2 2021, CFO Program, Deloitte LLP
4Is rising corporate debt a problem? Not necessarily.
End notes
1. Akrur Barua and Patricia Buckley, Rising corporate debt: Should we worry?, Deloitte Insights, April 15, 2019.
2. United States Federal Reserve data, sourced through Haver Analytics in May 2021. Economywide debt data used in this paper is taken from this source.
3. S&P Capital IQ data, sourced in May 2021.
4. Ibid; United States Bureau of Economic Analysis, National Economic Accounts data, sourced in May 2021.
5. Throughout this paper, we only focus on trends for nonfinancial companies.
6. Average annual rate cited here is compound annual growth rate (CAGR). Throughout the paper, CAGR is used to calculate average growth per year.
7. S&P Capital IQ data, sourced in May 2021.
8. The industry detail provided in the S&P Capital IQ data is the industry in which each corporation is categorized. The investment detail provided by the NIPA is by type
of investment irrespective of the industry making the investment. For example, the information technology industry in the S&P data is a grouping of corporations
producing IT goods and services. The information processing equipment investment in the NIPA data describes investment in this particular type of equipment by all
US businesses and nonprofits.
9. United State Bureau of Economic Analysis, National Economic Accounts data, sourced in May 2021.
Contacts
Patricia Buckley Akrur Barua Monali Samaddar
Managing Director Executive Manager/Economist Senior Analyst/Economist
Economic policy and analysis Deloitte Services India Pvt. Ltd. Deloitte Services India Pvt. Ltd.
Deloitte Services LP abarua@deloitte.com msamaddar@deloitte.com
pabuckley@deloitte.com
For more information about Deloitte’s CFO program visit our website at:
www.deloitte.com/us/thecfoprogram.
About Deloitte’s CFO Program
The CFO Program brings together a multidisciplinary team of Deloitte leaders and Follow us @deloittecfo
subject-matter specialists to help CFOs stay ahead in the face of growing
challenges and demands. The program harnesses our organization’s broad Deloitte CFO Insights are developed with the guidance of Dr. Ajit Kambil, Global
capabilities to deliver forward thinking and fresh insights for every stage of a CFO’s Research Director, CFO Program, Deloitte LLP; Lori Calabro, Senior Manager,
career—helping CFOs manage the complexities of their roles, tackle their CFO Education & Events, Deloitte LLP; and Josh Hyatt, Manager/Journalist, CFO
company’s most compelling challenges, and adapt to strategic shifts in the market. Program, Deloitte LLP.
This publication contains general information only and Deloitte is not, by means of this publication, rendering accounting, business, financial, investment, legal, tax, or other
professional advice or services. This publication is not a substitute for such professional advice or services, nor should it be used as a basis for any decision or action that
may affect your business. Before making any decision or taking any action that may affect your business, you should consult a qualified professional advisor.
Deloitte shall not be responsible for any loss sustained by any person who relies on this publication.
About Deloitte
Deloitte refers to one or more of Deloitte Touche Tohmatsu Limited, a UK private company limited by guarantee (DTTL), its network of member firms, and their related
entities. DTTL and each of its member firms are legally separate and independent entities. DTTL (also referred to as “Deloitte Global”) does not provide services to clients. In
the United States, Deloitte refers to one or more of the US member firms of DTTL, their related entities that operate using the “Deloitte” name in the United States and their
respective affiliates. Certain services may not be available to attest clients under the rules and regulations of public accounting. Please see www.deloitte.com/about to learn
more about our global network of member firms.
Copyright © 2021 Deloitte Development LLC. All rights reserved.You can also read