Is photosynthetic enhancement sustained through three years of elevated CO2 exposure in 175-year-old Quercus robur?
←
→
Page content transcription
If your browser does not render page correctly, please read the page content below
Tree Physiology 42, 130–144
https://doi.org/10.1093/treephys/tpab090

Research paper

Is photosynthetic enhancement sustained through three years
of elevated CO2 exposure in 175-year-old Quercus robur?

                                                                                                                                                                        Downloaded from https://academic.oup.com/treephys/article/42/1/130/6326847 by guest on 14 February 2022
A. Gardner           1,2 ,   D.S. Ellsworth           3,   K.Y. Crous         3,   J. Pritchard1,2 and A.R. MacKenzie1,4,5

1
 Birmingham Institute of Forest Research, University of Birmingham, Edgbaston, B15 2TT, UK; 2 School of Biological Sciences, University of Birmingham, Edgbaston, B15
2TT, UK; 3 Hawkesbury Institute for the Environment, Western Sydney University, Locked Bag 1797, Penrith NSW 2751, Australia; 4 School of Geography, Earth &
Environmental Sciences, University of Birmingham, Edgbaston, B15 2TT, UK; 5 Corresponding author (a.r.mackenzie@bham.ac.uk)

Received March 5, 2021; accepted July 7, 2021; handling Editor David Whitehead

Current carbon cycle models attribute rising atmospheric CO2 as the major driver of the increased terrestrial carbon sink,
but with substantial uncertainties. The photosynthetic response of trees to elevated atmospheric CO2 is a necessary step,
but not the only one, for sustaining the terrestrial carbon uptake, but can vary diurnally, seasonally and with duration
of CO2 exposure. Hence, we sought to quantify the photosynthetic response of the canopy-dominant species, Quercus
robur, in a mature deciduous forest to elevated CO2 (eCO2 ) (+150 μmol mol−1 CO2 ) over the first 3 years of a long-
term free air CO2 enrichment facility at the Birmingham Institute of Forest Research in central England (BIFoR FACE).
Over 3000 measurements of leaf gas exchange and related biochemical parameters were conducted in the upper
canopy to assess the diurnal and seasonal responses of photosynthesis during the 2nd and 3rd year of eCO2 exposure.
Measurements of photosynthetic capacity via biochemical parameters, derived from CO2 response curves, (V cmax and
J max ) together with leaf nitrogen concentrations from the pre-treatment year to the 3rd year of eCO2 exposure, were
examined. We hypothesized an initial enhancement in light-saturated net photosynthetic rates (Asat ) with CO2 enrichment
of ≈37% based on theory but also expected photosynthetic capacity would fall over the duration of the study. Over
the 3-year period, Asat of upper-canopy leaves was 33 ± 8% higher (mean and standard error) in trees grown in eCO2
compared with ambient CO2 (aCO2 ), and photosynthetic enhancement decreased with decreasing light. There were no
significant effects of CO2 treatment on V cmax or J max , nor leaf nitrogen. Our results suggest that mature Q. robur may
exhibit a sustained, positive response to eCO2 without photosynthetic downregulation, suggesting that, with adequate
nutrients, there will be sustained enhancement in C assimilated by these mature trees. Further research will be required
to understand the location and role of the additionally assimilated carbon.

    Keywords: CO2 fertilization of photosynthesis, Deciduous forest, downregulation, enriched CO2 , Free-air CO2 enrichment
    (FACE), photosynthetic capacity.

Introduction                                                                          carbon cycle. As the foundational driver of the carbon cycle
Forest ecosystems cover ∼30% of the Earth’s land surface, rep-                        of forests (e.g., Bonan 2008), the photosynthetic response to
resenting ∼50% of terrestrially stored carbon and account for                         changing atmospheric CO2 is a necessary process for forests
close to 60% of total terrestrial CO2 fluxes in the global carbon                     to act as long-standing carbon stores with relatively long-lived
cycle (Luyssaert et al. 2008, Pan et al. 2011). The continual                         carbon (C) pools such as wood (Körner 2017) and soil (Ostle
rise in atmospheric CO2 , overwhelmingly due to anthropogenic                         et al. 2009). The amount of forest C-uptake in the future,
activity (Friedlingstein et al. 2019), increases the need to under-                   and subsequent C sequestration, will be crucial determinants
stand the terrestrial carbon feedbacks of forests in the global                       of future atmospheric CO2 concentrations. So, quantifying the

© The Author(s) 2021. Published by Oxford University Press.
This is an Open Access article distributed under the terms of the Creative Commons Attribution License (https://creativecommons.org/licenses/by/4.0/),
which permits unrestricted reuse, distribution, and reproduction in any medium, provided the original work is properly cited.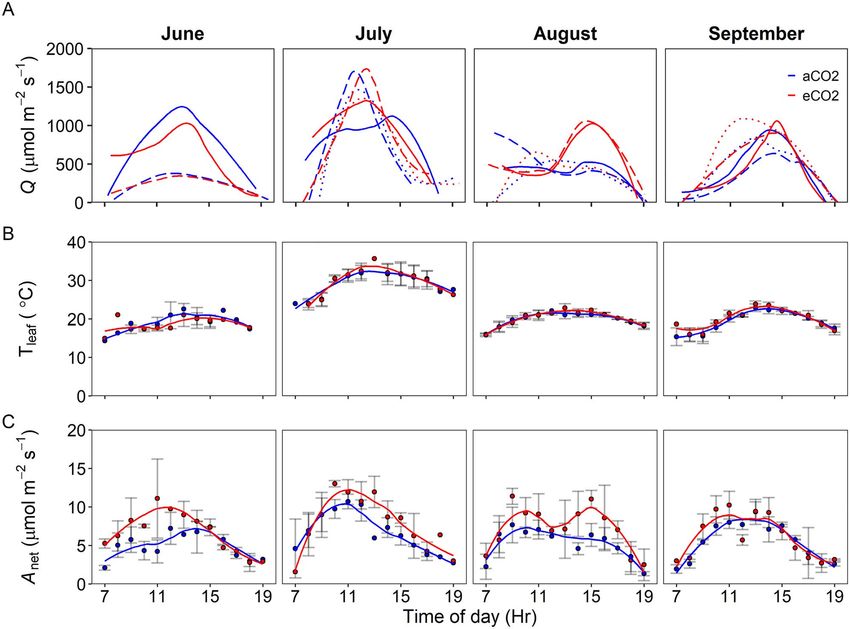
Photosynthesis in mature oak under elevated CO2 131

photosynthetic response under elevated CO2 (eCO2 ), especially       are currently overestimating the photosynthetic responses of
for mature trees, is critical to understanding the carbon uptake     mature forests and, thence, the ‘CO2 fertilization’ effect (Zhu
of forests under changing atmospheric composition.                   et al. 2016). Consequently, uncertainty remains as to the
   It has been widely observed that eCO2 can have a stimula-         magnitude of, and environmental constraints on, photosynthetic
tory effect on plant photosynthesis, known as photosynthetic         enhancement under eCO2 in large, long-standing carbon stores
enhancement, at least in the short-term (weeks–months) with          such as mature forests (Norby et al. 2016, Jiang et al. 2020).
adequate nutrient and water availability permitting (Brodribb           Free-air CO2 enrichment (FACE) facilities are valuable to
et al. 2020). Long-term (years to decades) photosynthetic            understand system-level responses to eCO2 (Ainsworth and
responses to eCO2 are less well understood and lower-than-           Long 2005, Terrer et al. 2019) particularly in forests (Medlyn
expected responses have been observed (Ainsworth and Long            et al. 2015, Norby et al. 2016). The development of second
2005, Ellsworth et al. 2017). Note that, even in studies that        generation forest FACE experiments focuses on tall, mature
report sustained and/or strong stimulation of photosynthesis         trees grown in their own forest soil (Hart et al. 2020). To

                                                                                                                                         Downloaded from https://academic.oup.com/treephys/article/42/1/130/6326847 by guest on 14 February 2022
under eCO2 , the additionally assimilated C does not necessarily     date, forest FACE experiments have observed photosynthetic
translate into increased growth stimulation (Bader et al. 2013,      enhancements ranging from 30 to 60%, depending on tree
Sigurdsson et al. 2013).                                             species and environmental factors (as reviewed in Nowak et al.
   The photosynthetic process and photosynthetic response to         2004, Ainsworth and Rogers 2007). Of the few studies on
eCO2 is sensitive to changes in environmental variables such         closed-canopy-dominant tree species, smaller photosynthetic
as temperature, light, water and availability of nutrients. For      enhancement to eCO2 have been observed (19–49%) than
example, net photosynthesis (Anet ) is expected to increase with     in studies conducted on younger trees (Sholtis et al. 2004,
exposure to eCO2 , with greatest photosynthetic enhancement          Liberloo et al. 2007, Crous et al. 2008), but the reasons behind
expected at maximum photon flux density (Q) if Rubisco car-          this smaller response remain unclear.
boxylation is limiting (Sage et al. 2008). Decreases in Anet have       There is evidence of a reduction in photosynthetic activity
been commonly associated with limitations in water and nutrient      after long-term eCO2 exposure, known as photosynthetic down-
availability (Nowak et al. 2004, Ainsworth and Rogers 2007).         regulation (Ainsworth et al. 2004, Crous and Ellsworth 2004),
For example, water availability has been found to increase           but downregulation is not always observed (Curtis and Wang
the magnitude of eCO2 -induced photosynthetic enhancement            1998, Herrick and Thomas 2001). Commonly photosynthetic
in drier years (Nowak et al. 2004, Ellsworth et al. 2012).           downregulation under eCO2 exposure is the result of decreases,
Thus, interannual differences in eCO2 –induced photosynthetic        either directly or indirectly, in Rubisco carboxylation (V cmax ;
enhancement are to be expected as environmental conditions           Feng et al. 2015, Wujeska-Klause et al. 2019b). However,
vary. Understanding the photosynthetic response to eCO2 under        the stimulatory effect of photosynthesis under eCO2 may be
different, real-world, environmental conditions provides informa-    reduced but is usually not completely removed (Leakey et al.
tion essential, but not in itself sufficient, for modeling forest    2009, Wujeska-Klause et al. 2019b). Photosynthetic downreg-
productivity (Jiang et al. 2020), and predicting carbon-climate      ulation has largely been observed in young plants (Leakey et al.
feedbacks (e.g., Cox et al. 2013, Jones et al. 2016).                2009), with some downregulation observed in two aggrading
   Despite a significant body of research on the photosynthetic      plantation forests (Crous et al. 2008, Warren et al. 2015),
response to eCO2 in tree seedlings and saplings (as reviewed in      commonly as a result of insufficient soil nitrogen supply (Luo
Medlyn et al. 1999, Ainsworth and Long 2005), fewer studies          et al. 2004). However, photosynthetic downregulation has
address the long-term (>1 year) photosynthetic responses in          largely not been observed in mature forests (Bader et al. 2010)
mature plantation trees (Liberloo et al. 2007, Crous et al.          and therefore open questions remain concerning the frequency
2008, Uddling et al. 2009, Warren et al. 2015) and very few          and magnitude of photosynthetic downregulation under eCO2
in mature forest-grown trees (Bader et al. 2010, Klein et al.        exposure in mature forests.
2016, Ellsworth et al. 2017). Currently, the dynamic vegetation         To understand the photosynthetic responses in mature tem-
components of Earth System models, which diagnose vegeta-            perate deciduous forests, we evaluated the photosynthetic
tion responses to environmental change, have commonly been           enhancement and potential downregulation in ca. 175-year-
constructed using data from eCO2 experiments on young and/or         old canopy-dominant trees of Q. robur L. exposed to eCO2
plantation grown trees (Piao et al. 2013). Yet, it is difficult to   for 3 years. Considering that forest FACE experiments aim to
compare, generalize, and scale results from young trees in their     operate for 10 years or more, we refer to these CO2 responses
exponential growth phase to the response of closed-canopy            as ‘early’ (Griffin et al. 2000). This study is among the oldest
mature forests (Norby et al. 2016). For example, previous            trees that have ever been examined under eCO2 . To assess
work from a long-term natural experiment found CO2 stimu-            the photosynthetic enhancement of the trees on daily and
lation declined with tree age in Quercus ilex (Hättenschwiler        interannual timeframes, measurements of gas exchange and
et al. 1997). Therefore, it is plausible that model projections      leaf biochemistry were measured in the upper oak canopy over

                                                                     Tree Physiology Online at http://www.treephys.oxfordjournals.org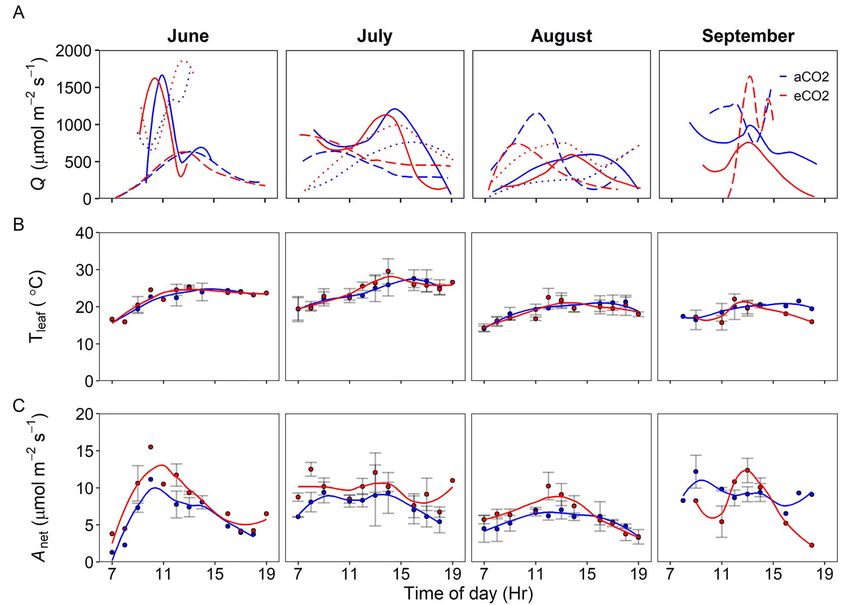
132 Gardner et al.

four growing seasons, that included one pre-treatment year              were 4 and 17 ◦ C, respectively, and the average annual precipi-
(2015) and 3-treatment years (2016–2019). Our aims were                 tation for the region is 720 mm (650, 669, 646 and 818 mm,
to quantify the photosynthetic response to eCO2 (i.e., ambient          in 2015, 2017, 2018 and 2019, respectively, when the study
+150 μmol mol−1 ) for mature Q. robur and how light level               was conducted; see Figure 1). The total N deposition load at the
influences this response, to determine whether photosynthetic           BIFoR FACE site is ∼ 22 Kg N/ha/year (estimate provided by S.
downregulation under eCO2 occurred and to establish whether             Tomlinson at the Centre for Ecology and Hydrology, Edinburgh,
the relationship between leaf N and photosynthetic capacity             UK; MacKenzie et al. 2021), representing ∼15% of the total
changed in eCO2 . We hypothesized that net photosynthetic gas           nitrogen nutrition of temperate deciduous trees (Rennenberg
exchange, Anet, will significantly increase with eCO2 and light         and Dannenmann 2015).
levels (Q). The greatest enhancement was expected with the                 BIFoR FACE consists of nine approximately circular exper-
highest light levels, as a result of reduced limitations in the light   imental plots of woodland 30 m in diameter (Hart et al.
dependent reaction of photosynthesis, and that photosynthetic           2020). Only the six plots with infrastructure were considered

                                                                                                                                            Downloaded from https://academic.oup.com/treephys/article/42/1/130/6326847 by guest on 14 February 2022
enhancement would be ≈37% following theory and reasoning                in the present study. Each ‘infrastructure plot’ is encircled by
in Nowak et al. (2004) (see also Supplemental Appendix 1                steel towers constructed individually to reach 2-m above the
available as Supplementary Data at Tree Physiology Online).             local canopy-top height. The facility uses a paired-plot design
We also hypothesized that leaf nitrogen (N) will be reduced             (Hart et al. 2020): three replicate plots at either ambient CO2
under eCO2 and that photosynthetic downregulation will be               (aCO2 ; ca. 405 μmol mol−1 ) and three plots supplied with
observed under eCO2 as a result of reduced leaf N and/or a              CO2 enriched air, termed elevated CO2 plots (eCO2 ). The
decline in either the maximum rate of photosynthetic Rubisco            latter plots were operated such that they achieved a target
carboxylation (V cmax , μmol m−2 s−1 ); and the maximum rate of         of +150 μmol mol−1 above the minimum measured in the
photosynthetic electron transport (Jmax , μmol m−2 s−1 ), or both       ambient plots (i.e., concentrations in the elevated plots ca.
(Griffin et al. 2000).                                                  555 μmol mol−1 ) as 5-min rolling averages (Hart et al. 2020;
                                                                        see Supplementary Figure 1 available as Supplementary Data
                                                                        at Tree Physiology Online). Elevated CO2 is added from dawn
Methods and materials
                                                                        (solar zenith angle, sza = −6.5◦ ) to dusk (sza = −6.5◦ )
Site description                                                        throughout the growing season. Daytime exposure to eCO2 was
This study was conducted at the Birmingham Institute of Forest          almost continuous throughout the growing season (Hart et al.
Research (BIFoR) Free Air CO2 Enrichment (FACE) facility                2020), with exceptions if the 15-min average wind speed was
located in Staffordshire (52.801◦ N, 2.301◦ W), UK. The BIFoR           >8 m s−1 , or when canopy-top, 1-min average, air temperature
FACE facility is a ‘second generation’ Forest FACE facility,            was < 4 ◦ C. In the latter case, gas release was resumed when
extending the scope of first generation facilities; (see Norby          the air temperature was ≥5 ◦ C. The CO2 fumigation thresholds
et al. 2016), situated within 19 ha of mature northern tem-             for wind speed and temperature were selected because of the
perate broadleaf deciduous woodland having a canopy height              high cost of maintaining eCO2 and the insignificant uptake of
of 24–26 m. The woodland consists of an overstorey canopy               carbon under these conditions, respectively. The operation of
dominated by English oak (Q. robur L.) and a dense under-               the FACE system and statistical performance in terms of meeting
storey comprising mostly of hazel coppice (Corylus avellana L.),        the target CO2 concentration in time and space have been
sycamore (Acer pseudoplatanus L.), and hawthorn (Crataegus              described in Hart et al. (2020).
monogyna Jacq.). Quercus robur (commonly known as pendun-                  In each plot, canopy access was gained through a custom-
culate oak, European oak or English oak) is a common broadleaf          built canopy access system (CAS) (Total Access Ltd, UK) that
species geographically widespread across Europe where it is             was installed from the central towers with canopy measurements
both economically important and ecologically significant for            made from a rigged rope access system (see Supplementary
many biota (Eaton et al. 2016, Mölder et al. 2019). The site            Figure 2 available as Supplementary Data at Tree Physiology
was planted with the existing oak standards in the late 1840s           Online). This facilitated in situ gas exchange measurements by
and has been largely unmanaged for the past 30–40 years. Like           allowing access to the upper oak canopy. The hoisting system
most established forest of the temperate zone, the BIFoR FACE           comprises of an electric winch (Harken Power Seat Compact)
forest is under-managed.                                                that lifts a harnessed (Petzl AVAO BOD 5 point harness) user
   The study site is situated within the temperature-rainfall           vertically through the air at a predetermined fixed point to
climate space occupied by temperate forest (Sommerfeld et al.           a maximum canopy height of 25 m. The system required
2018, Jiang et al. 2020) and is characterized by cool wet               operation from the ground by trained staff and the user is seated
winters and warm dry summers with a frost-free growing season           in a Boatswain’s chair. One oak tree per plot was accessible
from April to October. The mean January and July temperatures           using the CAS system as set up during this study, and all gas

Tree Physiology Volume 42, 2022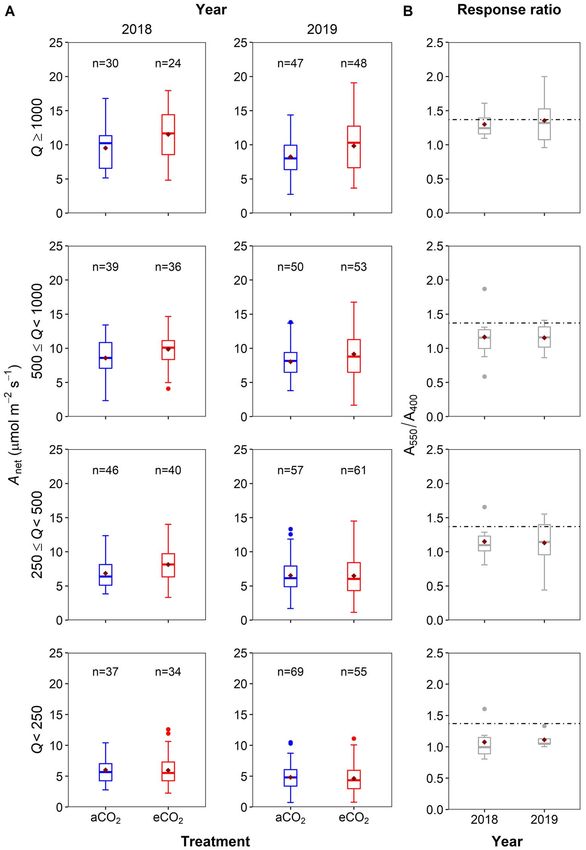
Photosynthesis in mature oak under elevated CO2 133
Downloaded from https://academic.oup.com/treephys/article/42/1/130/6326847 by guest on 14 February 2022
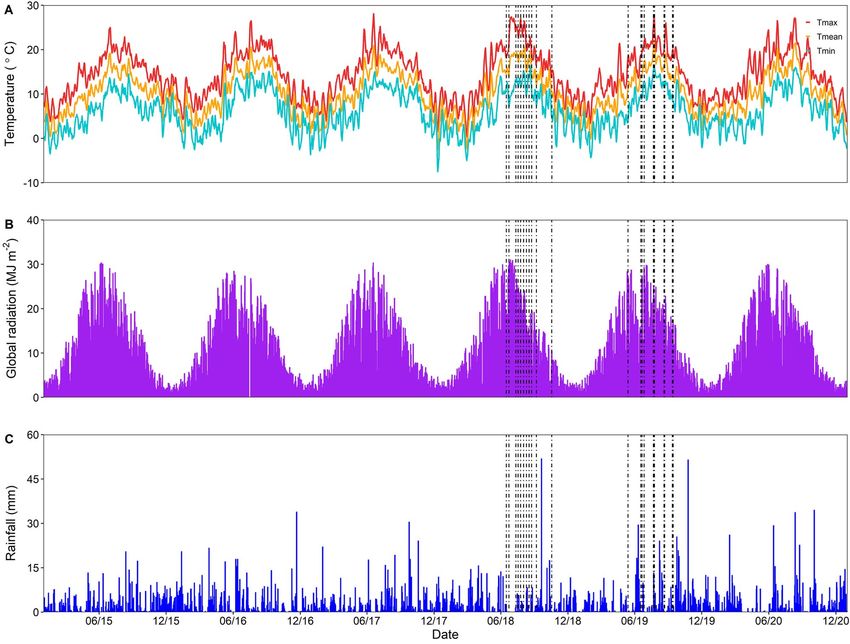
Figure 1. Time series showing the daily meteorological data at the BIFoR FACE facility covering the period of 1 January 2015–1 January 2021.
Subplots are: (A) maximum, (red), mean (orange) and minimum (blue) daily air temperatures (◦ C), (B) global downwelling solar radiation (MJ m−2 )
and (C) total daily precipitation (mm). Vertical dashed lines indicate diurnal sampling days. Clusters of sampling days occurred because different
plots were sampled on different days in the same seasonal timeframe. Meteorological data are from RAF Shawbury, located 20 miles west of the
BIFoR FACE facility, retrieved from the UK Met Office (https://www.metoffice.gov.uk/research/climate/maps-and-data/historic-station-data).
exchange measurements were made on unshaded leaves within environmental conditions (2018 and 2019), and (ii) net assimi-
the top 2 m of each tree canopy on dominant trees. lation rate-intercellular CO2 concentration (A–Ci ) measurements
For this study, the sample size used throughout the study (includes pre-treatment, 2015; 1st year, 2017; and 3rd year,
(n = 3) represents the number of replicate experimental plots 2019, of CO2 fumigation). Measurements were conducted in
at BIFoR FACE and includes within-tree replicates that were all six experimental plots with infrastructure, on one chosen
averaged per plot before analysis. All the three replicates were candidate tree per plot. The target tree remained the same for
sampled for the majority of campaigns, except for September all treatment years (2017, 2018 and 2019) but a different tree
2018 and June 2019 where replicates were reduced to two was measured during the pre-treatment period in 2015. This
due to logistic constraints, weather and safe tree access. change was because the plot infrastructure, which determined
the CAS system, was not constructed until 2016.
Gas exchange measurements When reporting treatment effects from the present study, we
report the mean enhancement or treatment effect:
All gas exchange measurements were conducted in situ on
upper canopy oak leaves using either a Li-6400XT or Li-6800
Ai Ai,e − Ai,a
portable photosynthesis system (LiCOR, Lincoln, NE, USA) to 100 · = 100 (1)
Ai,a Ai,a
quantify photosynthetic performance at BIFoR FACE. Measure-
ment campaigns focused on two different types of measure- where Ai,x is a measure of gas exchange (i = ‘net’ or ‘sat’, see
ments: (i) instantaneous diurnal measurements, at prevailing below) at ambient (a) or elevated (e) CO2 mixing ratios. When
Tree Physiology Online at http://www.treephys.oxfordjournals.org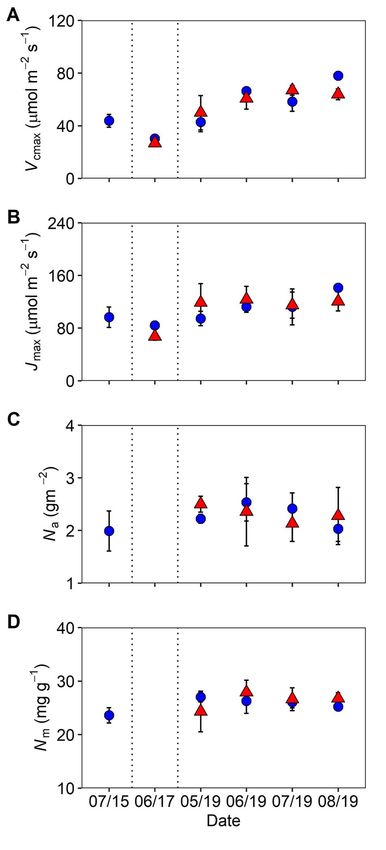
134 Gardner et al.

comparing our results with other studies using different eCO2        head on the measured leaf and to reduce variation across
treatments, we report the sensitivity to eCO2 , following Keenan     the leaf measurements. Measurements were recorded after an
et al. (2016):                                                       initial stabilization period (typically ∼40 seconds to 1 minute),
                                                                     to meet programmed stability parameters. This allowed for
                              ca ∂GPP   Ai ca                       instantaneous steady-state photosynthesis to be captured, yet
             Sensitivity =            ≈     .                 (2)
                             GPP ∂ca    Ai,a ca                     avoided chamber-related increases in leaf temperature (Parsons
                                                                     et al. 1998). Care was taken to ensure conditions matched
where ca is the aCO2 mixing ratio and ca is the treatment size      those outside the chamber before each measurement was taken.
(e.g., +150 μmol mol−1 as in our case). For the conditions of        The daily mean RH inside the leaf chamber was between 50 and
the present study (see ‘Diurnal measurements’ section, below),       77% for all measurements. The mean Ca values in the LiCOR
ca /ca = 392/150 = 2.61, and we use net photosynthesis              chamber head were 390 ± 0.9 and 538 ± 2.7 μmol mol−1 , in
instead of GPP. Hence, our theoretical predicted photosynthetic      2018, and 393 ± 1.0 and 545 ± 4.8 μmol mol−1 , in 2019, for

                                                                                                                                         Downloaded from https://academic.oup.com/treephys/article/42/1/130/6326847 by guest on 14 February 2022
enhancement (Nowak et al. 2004; see Supplemental Appendix            aCO2 and eCO2 , respectively. The mean CO2 treatments were,
1 available as Supplementary Data at Tree Physiology Online)         therefore, +148 ± 2.8 μmol mol−1 in 2018 and +152 ± 4.9
for the +150 μmol mol−1 increase in CO2 (i.e., ≈37%; Hart            in 2019, and were not statistically different. The gas exchange
et al. 2020), is equivalent to expecting a sensitivity to eCO2       systems were calibrated before each growing season.
of unity.
                                                                     A–Ci curves
Diurnal measurements                                                 A–Ci curves were conducted in three growing seasons: pre-
Near the canopy-top, in situ diurnal measurements of gas             treatment year (2015), in the 1st year of CO2 fumigation
exchange were conducted on upper canopy oak leaves on 11             (2017) and third year of CO2 fumigation (2019). Measure-
and 12 separate summer days of 2018 and 2019, respectively.          ments were either conducted on attached branches in situ
Measurements of gas exchange (e.g., net CO2 photosynthetic           (2015 and 2019) or on detached branches harvested by
assimilation rates, Anet ) were made using a Li-6800 equipped        climbers (2017) using a portable open gas exchange system
with the default clear Propafilm (Innovia Films Inc., Atlanta, GA)   that incorporated a controlled environment leaf chamber (Li-
window chamber head, which allowed for natural sunlight to           6400XT and LI-6800, LICOR, Inc., Lincoln, NE, USA). Detached
illuminate the leaf. Measurements were conducted in one pair         branches were transferred to researchers on the ground imme-
of plots (i.e., one eCO2 plot and its paired aCO2 plot) on each      diately after excision, where they were placed in a bucket of
sampling day. Therefore, each full campaign (n = 3) took 3 days      water to minimize desiccation. Branches were re-cut under
to complete, with the exception of September 2018 and June           water and allowed to stabilize, before starting measurements.
2019 where only two replicate plots could be measured. A total       Measurement on detached branches was conducted no longer
of four diurnal campaigns were conducted in both 2018 and            than 45 min after collection. Previous studies investigating mea-
2019, providing a total of 3426 data points. Five to six healthy     surements of gas exchange on severed or attached branches
leaves were randomly selected in the same oak tree per plot,         found no significant differences between the two methods
every 30–40 min across the time course of the day for gas            (Bader et al. 2016, Verryckt et al. 2020). A–Ci curves were
exchange measurements, swapping between aCO2 and eCO2                measured at a Q of 1800 μmol m−2 s−1 (in 2015 and 2019)
plots.                                                               or 1200 μmol m−2 s−1 (in 2017) and at a leaf temperature
    Measurements were made at the respective growth CO2              of 25 ◦ C. Before each curve, a stabilization period of between
of aCO2 (∼405 μmol mol−1 ) or +150 μmol mol−1 aCO2                   5 and 10 min was used depending on the prevailing environ-
(∼555 μmol mol−1 ) for eCO2 plots, along with other environ-         mental conditions and each curve took an average of 40 min.
mental variables such as relative humidity (RH); air temperature     Light-saturated net photosynthesis (Asat ) was estimated from
(T air ) and quanta of photosynthetically active radiation (PAR).    A–Ci curves at growth [CO2 ]. The CO2 concentrations were
Measurements were confined to the youngest fully expanded            changed in 12–14 steps starting at the respective growth [CO2 ];
leaves of the leader branch within reaching distance of the CAS      every 100 μmol mol−1 down to 50 μmol mol−1 (near the
system. Measurements were confined to the first flush of leaves      photosynthetic CO2 compensation point), then increasing to
across the season for consistency in leaf age. Expanding leaves,     1800 μmol mol−1 in roughly 200 μmol mol−1 increment steps.
judged from color and texture, were avoided for measurements,        Five to six replicate A–Ci curves on different leaves per CO2
as they had not matured in terms of chlorophyll and formation        treatment were measured per day. Measurements were taken
of the photosynthetic apparatus. Once a leaf was inside the          between 09:00–11:00 and 14:00–17:00 to avoid potential
chamber, the Li-6800 head was gently positioned and held             midday stomatal closure (Valentini et al. 1995). Measurements
constant at an angle towards the sun. This was to ensure sun         were made using the treatment pair arrangement of one aCO2
exposure on the leaf, to minimize shading of the chamber             and one eCO2 plot per day (n = 3).

Tree Physiology Volume 42, 2022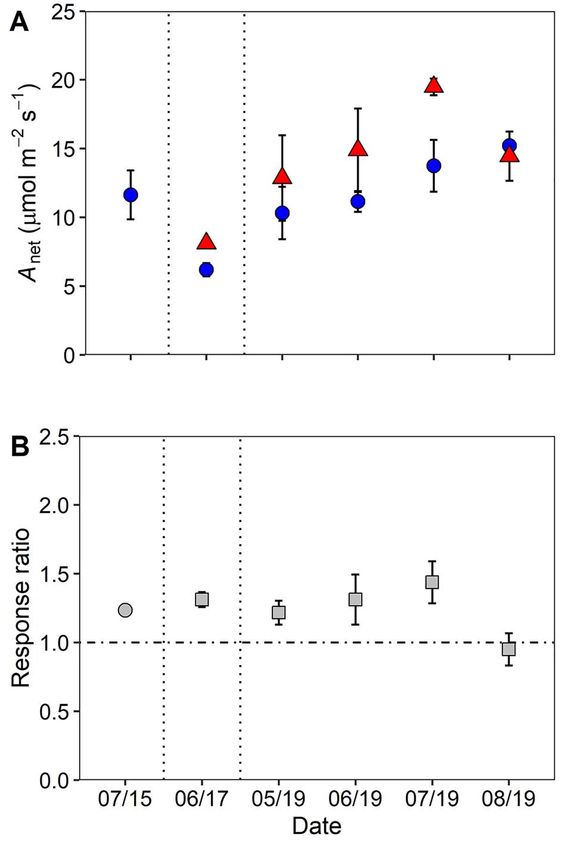
Photosynthesis in mature oak under elevated CO2 135

Leaf carbon and nitrogen                                               [CO2 ] (Rogers and Ellsworth 2002). We tested for outliers
Oak leaves were collected from the top of the canopy in                by examining the Jmax /V cmax ratio, RMSE values and standard
each month, May–November in 2015 and 2019, by arborist                 errors (SE) for fits of Jmax and V cmax , all of which indicate
climbers, and stored immediately at −25 ◦ C. Two upper canopy          violations to the theory for fitting these curves (Sharkey et al.
leaves, from one tree per plot, were selected for elemental            2007). Visual inspection of each A–Ci curve with outliers
analyses, these trees corresponded to the measurement tree             allowed us to identify any incomplete curves and/or mechanical
for leaf gas exchange. Each leaf was photographed on white             failures and those curves were subsequently removed. This
graph paper, with a ruler for reference. Leaf area analysis was        accounted for < 10% of the data, leaving a total of 86 A–Ci
conducted using imaging software Image J (IMAGE J v1.53,               curves across the 3-sampling years in the analysis.
National Institutes of Health, Bethesda, MD, USA) and the fresh
weight was recorded. Each leaf was oven dried at 70 ◦ C for at         Results

                                                                                                                                           Downloaded from https://academic.oup.com/treephys/article/42/1/130/6326847 by guest on 14 February 2022
least 72 h, re-weighed for dry weight and the leaf mass per unit
                                                                       Measurement conditions
area was calculated. Dried leaf fragments were ground and each
sample (∼2 mg) was enclosed in a tin capsule. Samples were             Overall, diurnal measurements were conducted on dry, sunny
analyzed for δ 13 C, total C and total N using an elemental analyzer   days (Figure 1), and environmental conditions (Q and T leaf )
interfaced with an isotope ratio mass spectrometer (Sercon Ltd,        were consistent between aCO2 and eCO2 across the two
Cheshire, UK).                                                         growing seasons of diurnal measurements (Figures 2A, B and
                                                                       3A, B). Q levels were largely comparable between CO2 treat-
Statistical analysis                                                   ments although cloud and temperature conditions were more
All statistical analyses were performed in R version 4.0.3 (R          variable among sampling days and campaigns in 2018 than in
Core Team, 2020). Before statistical analysis, all data were           2019.
checked for normality by inspection of the Q–Q plots and                  Leaf temperature was more stable than Q with lower variabil-
Levene’s test, and residuals from model fitting were checked           ity across the diurnal sampling, high similarity between sampling
for evidence of heteroscedasticity. Hourly averages of diurnal         days, and high consistency between CO2 treatments. There were
measurements were analyzed using a linear mixed effects model          differences of up to 15 ◦ C in midday measurements of T leaf ,
(‘lmer’ package). Fixed categorical factors in this model were         between months, suggesting a seasonal influence as would be
CO2 treatment (i.e., aCO2 or eCO2 ), sampling month and                expected from the site’s mid-latitude location, with differences
sampling year (i.e., 2018 or 2019), in addition to their inter-        more prominent in 2019 than 2018. The highest T leaf values
actions. In addition, ‘time of day’ and ‘plot’ were represented as     were observed in July with a common seasonal decline after this
random factors, the latter as individual trees were nested within      campaign.
each experimental plot. Type III F-statistics associated with the         Analysis of the diurnal dataset showed the range of mean
mixed model analysis (repeated-measures analysis of variance,          daily Anet was similar between years, however the highest
ANOVA) were reported. Statistically significant CO2 treatment          mean daily Anet (12.2 μmol m−2 s−1 ) was reported in 2018.
differences among groups were further tested with Tukey’s post         Contrasting seasonal patterns were observed between the sam-
hoc test using the R package ‘emmeans’ (P < 0.05 reported as           pling years of 2018 and 2019, with decreases in mean daily
significant). To investigate the dependence of photosynthetic          Anet across the growing season observed in 2018 compared
enhancement with variation of light, the diurnal gas exchange          with increases in Anet in 2019. In both sampling years, we
data, with leaf temperature, T leaf >18 ◦ C, and vapor pressure        observed a significant enhancement of Anet when exposed
deficit (D), D < 2.2 kPa, were sub-divided into four light (Q)         to eCO2 (P < 0.05, Table 1 and Figures 2 and 3). Here,
categories, each sampled about equally. The Q classes were             we did not observe any significant effect of either season or
chosen based on the characteristic response of Anet to light as        sampling year on Anet (Table 1). Therefore, from measurements
follows: Q < 250; 250 ≤ Q < 500; 500 ≤ Q < 1000 and                    of Anet collected from the diurnal dataset, a mean eCO2 -driven
Q ≥ 1000 μmol m−2 s−1 . CO2 treatment, year and Q category             photosynthetic enhancement (i.e., 100.Ai /Ai,a ) of 23 ± 4%
were then used as parameters in the ANOVA.                             was observed across the 2-year period of this study.
    The photosynthetic CO2 response (A–Ci ) curves were fit
with the model of Farquhar et al. (1980) to estimate the               Photosynthesis and variation in photon flux density (Q)
apparent maximum rate of photosynthetic Rubisco carboxylation          This study analyzed the role of measurement Q affecting Anet
(V cmax , μmol m−2 s−1 ) and the apparent maximum rate of              and its response to eCO2 in separate growing seasons to inves-
photosynthetic electron transport (Jmax , μmol m−2 s−1 ) using         tigate photosynthetic enhancement values at different light con-
‘Plantecophys’ package in R (Duursma 2015). The model-                 ditions. In each light category (see section Methods, above), the
fitting was undertaken to provide insight into photosynthetic          light conditions between the CO2 treatments were statistically
capacity and its response to long-term exposure to elevated            comparable (Figure 4, see Supplementary Table S1 available as

                                                                       Tree Physiology Online at http://www.treephys.oxfordjournals.org
136 Gardner et al.

                                                                                                                                                          Downloaded from https://academic.oup.com/treephys/article/42/1/130/6326847 by guest on 14 February 2022
Figure 2. In situ diurnal measurements of (A) Q (μmol m−2 s−1 ), (B) hourly mean T leaf (◦ C) and (C) hourly mean Anet (μmol m−2 s−1 ); each fitted
with an LOESS regression, at BIFoR FACE in 2018 from the upper Q. robur canopy. Error bars indicate n = 3, with the exception of September where
only two replicate plots were measured and not all time points were replicated. The line types in (A) represent replicate plot pairings of; plots 1 and
3 (dotted), plots 2 and 4 (solid) and plots 5 and 6 (long-dash) and the two colors represent the CO2 treatments of aCO2 (blue) and eCO2 (red).

Supplementary Data at Tree Physiology Online). Mean, median                   and Q was present in 2019 with enhancement ranging from
and interquartile range of Anet increased with increasing Q class             11 ± 6%, in the lowest Q class, to 35 ± 13%, in the highest
for both sampling years and CO2 treatments (Figure 4A and                     Q class (Figure 4B). There was no significant effect of year
Table 2). We observed no significant effect of year for Anet                  (Table 2) and therefore the mean eCO2 -driven photosynthetic
in this study, but we did observe a larger variation in Anet in               enhancement at light saturation (i.e., in the highest Q class) was
2019, when compared with 2018 (Table 2 and Figure 4A).                        on average 33 ± 8% across the 2-sampling years. Our results
Values of mean Anet ranged from 4.6 ± 0.3 μmol m−2 s−1 ,                      report that the mean eCO2 -driven photosynthetic enhancement
at the lowest Q level with a mean of 150 μmol m−2 s−1 ,                       of light-saturated Anet (Asat ) in both sampling years was con-
to 11.5 ± 0.7 μmol m−2 s−1 at highest Q (mean Q of                            sistent, within error (using 95% confidence intervals), of the
1360 μmol m−2 s−1 ). In addition, in both sampling years Anet                 theoretical predicted enhancement based on proportion of CO2
was significantly higher under eCO2 conditions when compared                  increase (≈37 ± 6%), indicating a sensitivity to eCO2 (Eq. (2),
with aCO2 (P < 0.05, Table 2 and Figure 4A).                                  above) of close to unity for Asat .
   Consistent with our hypothesis, we observed mean eCO2 -
driven photosynthetic enhancement to increase with increasing                 Photosynthetic capacity and foliar nitrogen
Q, with the largest enhancement observed at highest Q in both                 The seasonal and interannual biochemical changes in Q. robur
sampling years, 30 ± 9% and 35 ± 13%, for 2018 and 2019,                      were assessed via differences in leaf apparent maximum CO2
respectively (Figure 4B). In 2018, eCO2 -driven photosynthetic                carboxylation capacity (V cmax ) and apparent maximum electron
enhancement ranged from 7 ± 10%, in the lowest Q class, to                    transport capacity for RuBP regeneration (Jmax ; Figure 5) to
30 ± 9%, in the highest Q class (Figure 4B). A similar positive               assess the photosynthetic capacity in the initial years of the
relationship between eCO2 -driven photosynthetic enhancement                  long-term experiment. Initially, we tested for differences between

Tree Physiology Volume 42, 2022
Photosynthesis in mature oak under elevated CO2 137

                                                                                                                                                             Downloaded from https://academic.oup.com/treephys/article/42/1/130/6326847 by guest on 14 February 2022
Figure 3. In situ diurnal measurements of (A) Q (μmol m−2 s−1 ), (B) hourly mean T leaf (◦ C) and (C) hourly mean Anet (μmol m−2 s−1 ); each fitted
with an LOESS regression, at BIFoR FACE in 2019 from the upper Q. robur canopy. Error bars indicate n = 3, the exception of June where only two
replicate plots were measured and not all time points were replicated. The line types in (A) represent replicate plot pairings of; plots 1 and 3 (dotted),
plots 2 and 4 (solid) and plots 5 and 6 (long-dash) and the two colors represent the CO2 treatments of aCO2 (blue) and eCO2 (red).

the year of sampling and found no statistical difference of either              Table 1. Linear mixed-effects model analysis for photosynthesis with
V cmax or Jmax between the 3-sampling years (2015, 2017                         CO2 treatment (CO2 ) using the diurnal dataset, sampling month
                                                                                (Month) and sampling year (Year) as fixed factors and random effects
and 2019; Figure 5, see Supplementary Table S2 available                        of ‘plot’ and ‘time’. Type III sums of squares computed using restricted
as Supplementary Data at Tree Physiology Online). This study                    maximum likelihood estimates for F-tests. The numerator degrees of
found no significant effects of CO2 enrichment on V cmax or                     freedom (df ) for each F-test are shown. A post-hoc Tukey test was
Jmax across the 2 years of CO2 enrichment, i.e., the 1st and                    used to determine the significance relationships. Significance of CO2
                                                                                treatment is noted in the rightmost column as (∗ = P < 0.05).
3rd years, and no significant effect of season between the
3 measurement years (Figure 5 and Table 3). However, this                       Parameter                         df                        P-value
study did observe a significant effect of month for the variable                CO2                               1                         0.044∗
Vcmax in 2019, whereby an increase in Vcmax was observed with                   Month                             3                         0.14
progression of the growing season (Figure 5A and Table 3).                      Year                              1                         0.31
Thus, this study observed no statistical evidence to suggest                    CO2 ∗ Month                       3                         0.18
                                                                                CO2 ∗ Year                        1                         0.18
photosynthetic downregulation of either V cmax or Jmax under
                                                                                Month ∗ Year                      3                         0.43
eCO2 across the 3 years of eCO2 exposure in Q. robur.                           CO2 ∗ Month ∗ Year                3                         0.079
   Consistent with previous research, this study observed a
strong positive linear relationship between Jmax and V cmax ,
which remained unchanged across CO2 treatments and growing                     Physiology Online). In addition, no eCO2 -induced decreases in
season (r 2 = 0.75 ambient; r 2 = 0.71 elevated; see Sup-                      either area-based foliar nitrogen (Na ) or mass-based foliar nitro-
plementary Figure 3 available as Supplementary Data at Tree                    gen (Nm ) were observed (Figure 5C and D and Table 3) across

                                                                               Tree Physiology Online at http://www.treephys.oxfordjournals.org
138 Gardner et al.

                                                                                                                                                        Downloaded from https://academic.oup.com/treephys/article/42/1/130/6326847 by guest on 14 February 2022

Figure 4. (A) The distribution of net photosynthesis (Anet ; μmol m−2 s−1 ) in each of the four photon flux density (Q) categories (Q < 250;
250 ≥ Q < 500; 500 ≥ Q < 1000 and Q ≥ 1000 μmol m−2 s−1 ) for years 2018 (left) and 2019 (right). Whiskers denote the 5%ile and 95%ile;
outliers are plotted as individual points (filled circles). The box denotes the interquartile range and the bar denotes the median with the number of
data points above each boxplot. The mean is also plotted as a diamond symbol. Data use diurnal gas exchange measurements in the upper canopy
oak trees at the BIFoR FACE facility with T leaf > 18 ◦ C and D < 2.2 kPa, in eCO2 (red) or aCO2 (blue) treatments. Red diamonds indicate the mean
Anet values. (B) Boxplots of the enhancement response ratio (A550 /A400 ) (gray) for each year, and predicted enhancement ratio (dashed line) (1.37)
following Nowak et al. (2004).

the study period. No change in foliar nitrogen is corroborative              photosynthetic downregulation under eCO2 in mature Q. robur
of the results in Figure 5 and also suggests the absence of                  in the first 3 years of the long-term experiment.

Tree Physiology Volume 42, 2022
Photosynthesis in mature oak under elevated CO2 139

Table 2. Linear mixed-effects model parameters for prediction of Anet
with variation in photo flux density (Q). Type III sums of squares
computed using restricted maximum likelihood estimates for F-tests.
The numerator df for each F-test are shown. A post-hoc Tukey’s
test was used to determine the significance relationships. Significance
is noted in bold in the rightmost column as (∗∗∗ = P < 0.001;
∗∗
   = P < 0.01 and ∗ = P < 0.05).

Parameter                        df                      P-value
CO2                              1                       0.016∗
Year                             1                       0.062
Q                                3
140 Gardner et al.

Table 3. Linear mixed-effects model analysis for V cmax , Jmax , net photosynthesis (Anet ), area-based leaf nitrogen (Na) and mass-based leaf nitrogen
(Nm ) with CO2 treatment (CO2 ) and sampling month (month) as fixed factors and random effects of ‘plot’ and ‘time’. Type III sums of squares
computed using restricted maximum likelihood estimates for F-tests. The numerator df for each F-test are shown. Significance is noted in boldface
as (∗ P < 0.05).

Parameter                                     V cmax                  Jmax                   Anet                    Nm                     Na
                       df                     P-value                 P-value                P-value                 P-value                P-value
CO2                    1                      0.70                    0.37                   0.042∗                  0.42                   0.64
Month                  3                      0.02∗                   0.15                   0.034∗                  0.93                   0.052
CO2 ∗ Month            3                      0.20                    0.57                   0.33                    0.69                   0.11

                                                                                After 3 years of eCO2 exposure in mature temperate oak

                                                                                                                                                          Downloaded from https://academic.oup.com/treephys/article/42/1/130/6326847 by guest on 14 February 2022
                                                                                forest, net photosynthetic rates of upper canopy foliage from
                                                                                Q. robur were on average 23 ± 4% higher, based on the
                                                                                diurnal dataset, in the trees exposed to eCO2 when compared
                                                                                with control plots (Figures 2–4; Tables 1 and 3). The eCO2 -
                                                                                driven photosynthetic enhancement observed is substantially
                                                                                lower than the theoretical expected enhancement of 37%, likely
                                                                                due to diurnal and seasonal variation in prevailing environmental
                                                                                conditions such as lower air temperatures, lower light con-
                                                                                ditions and varying vapor pressure deficits. Only considering
                                                                                light-saturated Anet (Asat ) from the diurnal dataset, our mean
                                                                                photosynthetic enhancement is greater than the average diurnal
                                                                                enhancement, at 33 ± 8% rather than 23%. Furthermore,
                                                                                our independent estimate of Asat enhancement based on the
                                                                                A–Ci curve data is 32 ± 11%, which is comparable within
                                                                                error (using 95% confidence intervals) to both the Asat value
                                                                                from the diurnal measurements and the hypothesized enhance-
                                                                                ment of 37%. A slight stomatal closure in eCO2 could have
                                                                                contributed to the slightly lower photosynthetic enhancement
                                                                                than the hypothesized enhancement of 37% (see Supplemental
                                                                                Appendix 1 available as Supplementary Data at Tree Physiology
                                                                                Online). However, our average light-saturated photosynthetic
                                                                                enhancement is generally lower than previously reported values
                                                                                in canopy-dominant trees from other forest FACE experiments
                                                                                (Bader et al. 2010, 42–48%; Crous et al. 2008, 40–68%;
                                                                                Liberloo et al. 2007, 49% and Sholtis et al. 2004, 44%), but
                                                                                is somewhat higher than the value of 19% from the EucFACE
Figure 6. (A) Net photosynthesis (Anet ) at growth CO2 and (B) instan-
                                                                                experiment on mature Eucalyptus trees (Ellsworth et al. 2017).
taneous (2015) and longer-term (2017 and 2019) response ratios in               The lower photosynthetic enhancement observed at EucFACE
the upper oak canopy using the A–Ci curve data. Means (± SD) of                 was likely due to lower nutrient availability compared with BIFoR
the plots per treatment are shown across six sampling campaigns for
                                                                                (Crous et al. 2015), although there were other differences such
aCO2 (blue circles), eCO2 (red triangles) and either the instantaneous
(gray squares) or longer-term response ratio (grey circles). Dashed line        as the tree species and prevailing temperatures that would also
indicate the separation of sampling years with campaigns labelled as            affect the magnitude of the photosynthetic enhancement.
follows; pre-treatment (‘07/15’), 1st year (‘06/17’) and the 3rd year
(‘05/19’–‘08/19’) of CO2 fumigation.
                                                                                The role of environmental conditions
                                                                                for photosynthetic enhancement
2016, Warren et al. 2015, Ellsworth et al. 2017). In this study,                Consistent with our initial hypothesis, we observed signifi-
we predicted a theoretical Anet enhancement of 37% for the                      cantly higher Anet and a 24% higher photosynthetic enhance-
150 μmol mol−1 increase in CO2 at BIFoR FACE following                          ment under the highest light conditions at BIFoR FACE (i.e.,
reasoning in Nowak et al. (2004; see Supplemental Appendix                      Q > 1000 μmol m−2 s−1 ) compared with the lowest light
1 available as Supplementary Data at Tree Physiology Online).                   category. Thus, a negative linear relationship was observed for

Tree Physiology Volume 42, 2022
Photosynthesis in mature oak under elevated CO2 141
both Anet and eCO2 -induced photosynthetic enhancement with the photosynthetic responses of mature forest-grown trees
decreasing light levels. Our results are consistent with previous (Hättenschwiler et al. 1997). The present study provided a
research on mature trees that observed an effect of light on the unique opportunity to assess the eCO2 -driven photosynthetic
magnitude of CO2 -driven stimulation of photosynthesis (Bader responses in 175-year-old canopy-dominant trees and found
et al. 2016), suggesting variation in light should be considered lower photosynthetic stimulation than the many previous studies
when assessing the response to eCO2 . Consequently, the rela- on tree seedlings and younger trees (e.g., Curtis and Wang
tionship of Anet and CO2 treatment effect with light intensity is 1998, Sholtis et al. 2004, Ainsworth and Long 2005, Liberloo
important when scaling upper canopy data both across diurnal et al. 2007, Crous et al. 2008). The age dependency of CO2
periods of light limitation and extending to the whole canopy, of responsiveness to photosynthesis in trees (Turnbull et al. 1998,
shaded and sunlit leaves, to avoid overestimating canopy-scale Wujeska-Klause et al. 2019a), highlights the importance of
photosynthesis by temperate forests. long-term experiments, such as the present study and oth-
It has been previously suggested that larger photosynthetic ers in understanding potential variable responses across the
Downloaded from https://academic.oup.com/treephys/article/42/1/130/6326847 by guest on 14 February 2022
enhancement may be expected in low light environments (Hät- lifetime of a tree, vital for accurate climate-carbon modeling
tenschwiler 2001, Norby and Zak 2011). For example, deep of forests.
shaded tree seedlings displayed greater photosynthetic gains
than those in moderate shade (photosynthetic enhancement
of 97% and 47%, respectively) with exposure to eCO2 (Kitao Did changes to photosynthetic capacity or leaf biochemistry
et al. 2015). In light-limited environments, higher CO2 concen- occur under eCO2 ?
trations can increase the apparent quantum yield and reduce the In some studies, a time-dependent decline in the magnitude of
light compensation point leading to enhanced carbon uptake eCO2 -induced photosynthetic enhancement, i.e., photosynthetic
(Larcher, 2003, Kitao et al. 2015). Hättenschwiler (2001) downregulation, has been observed (Cure and Acock 1986,
found large interspecific variability and, in Quercus, that greater Gunderson and Wullschleger 1994). Here, we hypothesized
photosynthetic responses to CO2 occurred under higher light that there may be reductions in V cmax , Jmax and leaf N, par-
when compared with low light. However, both Kitao et al. ticularly in the 3rd year of eCO2 exposure (Luo et al. 2004).
(2015) and Hättenschwiler (2001) studied tree seedlings in Our analysis of the 86 A–Ci curves collected in this experiment
contrast to upper canopy leaves of a canopy-dominant species revealed no decrease in the rate of V cmax or Jmax , indicating
in the present study. Although shade leaves were not measured that there were no significant changes in the photosynthetic
here, the results here from the top of the tree canopy provide capacity of Q. robur over the first 3 years of exposure to eCO2 .
an important benchmark for the magnitude of photosynthetic A lack of photosynthetic downregulation has also been found
enhancement by eCO2 in a mature oak forest. in similar seasonally deciduous species, including the closely
In addition to light intensity, the photosynthetic response related species Quercus petraea (Bader et al. 2010), in addition
of Q. robur varied across the growing season, as has been to Liquidambar styraciflua, Populus spp. and Betula papyrifera
observed in many other trees (Tissue et al. 1999, Rogers (Herrick and Thomas 2001, Sholtis et al. 2004, Liberloo et al.
and Ellsworth 2002, Sholtis et al. 2004). Here, Asat (derived 2007, Uddling et al. 2009). An apparent lack of downregulation
from the A–Ci dataset) in both CO2 treatments increased about has also been observed in other mature forest-grown species
50% from early in the season (May), to the middle of the (Bader et al. 2010, Ellsworth et al. 2017).
season (July); yet, the relative response ratio to eCO2 was stable As nitrogen is required for the synthesis and maintenance
throughout this period at 32%. In addition, when assessing the of photosynthetic proteins, eCO2 -driven photosynthetic down-
diurnal dataset, we found contrasting seasonal patterns between regulation has been associated with declines in foliar N (as
2018 and 2019, with decreases in Anet across the growing reviewed in Medlyn et al. 1999) and soil N-limitations (e.g.,
season observed in 2018 compared with increases in Anet Rogers and Ellsworth 2002, Crous et al. 2008, Warren et al.
in 2019, likely due to drier and warmer conditions in 2018. 2015). The current study on Q. robur did not find any changes in
Previous research has identified reductions in photosynthesis either mass- or area-based leaf nitrogen across the study period,
across the season is largely associated with drier conditions indicating there are no reductions to photosynthetic capacity
(Gunderson et al. 2002), which support the results observed in (Figure 5). This corroborates the findings from the V cmax and
the present study. This suggests that the influence of soil water Jmax parameters, supporting the suggestion for sustained photo-
availability on the seasonal pattern in oak physiology is critical synthesis in Q. robur over the first 3 years of exposure to eCO2 .
for determining seasonal C-uptake by mature forests and should Hence, there were no changes to the ratio of Jmax to V cmax ,
be further investigated in mature Q. robur to improve longer term indicating that the relationship between carboxylation and light-
carbon-climate models (see Limousin et al. 2013). harvesting processes was not affected by CO2 treatment, as
Previous research has identified eCO2 -driven photosynthetic found in previous studies (Medlyn et al. 1999, Crous et al.
responses observed in seedlings and saplings may not reflect 2008), including the closely related species, Q. petraea (Bader
Tree Physiology Online at http://www.treephys.oxfordjournals.org142 Gardner et al.
et al. 2010). These results may point to soil nutrient availability Conflict of interest
not yet limiting the photosynthetic processes in this forest sys-
None declared.
tem. The BIFoR FACE site receives moderately high atmospheric
N deposition (∼22 Kg N/ha/yr) thought to represent 15% of
the total nitrogen nutrition of temperate deciduous trees, likely
Author contributions
preventing ecosystem N-limitation at present (Rennenberg and
Dannenmann 2015). Therefore, with adequate N deposition in ARMK, JP and AG designed the study; AG, KYC and DSE
the soil, sustained photosynthetic enhancement was observed collected the data. AG organized the datasets under the
in the first 3 years of eCO2 exposure at BIFoR FACE. supervision of DSE, with input from ARMK; AG and DSE
designed and performed the statistical analyses, with input
from KYC and ARMK. AG and DSE wrote the first draft of the
Conclusions paper. All authors contributed to the manuscript revision, and
Downloaded from https://academic.oup.com/treephys/article/42/1/130/6326847 by guest on 14 February 2022
After 3 years of eCO2 exposure in a temperate deciduous read and approved the submitted version.
forest at the BIFoR FACE facility, photosynthetic enhancement of
mature Q. robur leaves at the top of the canopy was sustained
across all years and was 33 ± 8% (mean ± SE) at light References
saturation, close to the theoretical expectation. The magnitude Ainsworth EA, Long SP (2005) What have we learned from 15 years
of photosynthetic enhancement was significantly affected by of free-air CO2 enrichment (FACE)? A meta-analytic review of the
light conditions with higher enhancement at higher light. We responses of photosynthesis, canopy properties and plant production
found no evidence of photosynthetic downregulation under to rising CO2 . New Phytol 165:351–372.
Ainsworth EA, Rogers A (2007) The response of photosynthesis and
eCO2 and no declines in leaf nitrogen in the upper canopy. stomatal conductance to rising [CO2 ]: mechanisms and environmental
The lack of evidence for downregulation suggest there are interactions. Plant Cell Environ 30:258–270.
sufficient soil nutrients for Q. robur to maintain a relatively high Ainsworth EA, Rogers A, Nelson R, Long SP (2004) Testing the
photosynthetic enhancement under eCO2 conditions, at least to “source-sink” hypothesis of down-regulation of photosynthesis in
elevated [CO2 ] in the field with single gene substitutions in Glycine
this point in the eCO2 experiment. Much further work remains max. Agric For Meteorol 122:85–94.
to determine the movement and allocation of this enhanced Bader MKF, Leuzinger S, Keel SG, Siegwolf RTW, Hagedorn F, Schleppi
C-uptake in the forest. Our results are consistent with a sus- P, Körner C (2013) Central european hardwood trees in a high-CO2
tained, positive C-uptake response to rising atmospheric CO2 future: synthesis of an 8-year forest canopy CO2 enrichment project.
J Ecol 101:1509–1519.
in a mature deciduous forest tree species, provided adequate
Bader MKF, Mildner M, Baumann C, Leuzinger S, Körner C (2016)
nutrients are available. Photosynthetic enhancement and diurnal stem and soil carbon fluxes
in a mature Norway spruce stand under elevated CO2 . Environ Exp
Bot 124:110–119.
Supplementary data Bader MKF, Siegwolf R, Körner C (2010) Sustained enhancement of
photosynthesis in mature deciduous forest trees after 8 years of free
Supplementary data for this article are available at Tree Physiol- air CO2 enrichment. Planta 232:1115–1125.
ogy Online. Bonan GB (2008) Forests and climate change: forcings, feedbacks, and
the climate benefits of forests. Science 320:1444–1449.
Brodribb TJ, Powers J, Cochard H, Choat B (2020) Hanging by a
Acknowledgments thread? Forests and drought. Science 368:261–266.
Cox PM, Pearson D, Booth BB, Friedlingstein P, Huntingford C, Jones
We thank the BIFoR technical team for canopy access operations CD, Luke CM (2013) Sensitivity of tropical carbon to climate change
and Ian Boomer for technical support with leaf elemental constrained by carbon dioxide variability. Nature 494:341–344.
analysis. AG gratefully thanks Agnieszka Wujeska-Klause for Crous KY, Ellsworth DS (2004) Canopy position affects photosynthetic
adjustments to long-term elevated CO2 concentration (FACE) in aging
guidance with statistical analysis in the early stages of the needles in a mature Pinus taeda forest. Tree Physiol 24:961–970.
manuscript. AG gratefully acknowledges a studentship provided Crous KY, Ósvaldsson A, Ellsworth DS (2015) Is phosphorus limiting
by the John Horseman Trust and the University of Birmingham. in a mature eucalyptus woodland? Phosphorus fertilisation stimulates
The BIFoR FACE facility is supported by the JABBS foundation, stem growth. Plant and Soil 391:293–305.
Crous KY, Reich PB, Hunter MD, Ellsworth DS (2010) Maintenance
the University of Birmingham and the John Horseman Trust. of leaf N controls the photosynthetic CO2 response of grassland
ARMK acknowledges support from the Natural Environment species exposed to 9 years of free-air CO2 enrichment. Glob Chang
Research Council through grant (NE/S015833/1) which also Biol 16:2076–2088.
facilitated DSE’s participation. We further gratefully acknowl- Crous KY, Walters MB, Ellsworth DS (2008) Elevated CO2 concentra-
tion affects leaf photosynthesis-nitrogen relationships in Pinus taeda
edge advice and field measurement collection in the first CO2
over nine years in FACE. Tree Physiol 28:607–614.
fumigation season from Michael Tausz and Sabine Tausz-Pösch, Cure JD, Acock B (1986) Crop responses to carbon dioxide doubling:
respectively. a literature survey. Agric For Meteorol 38:127–145.
Tree Physiology Volume 42, 2022Photosynthesis in mature oak under elevated CO2 143
Curtis PS, Wang X (1998) A meta-analysis of elevated CO2 effects on Keenan T, Prentice I, Canadell J et al. (2016) Recent pause in the growth
woody plant mass, form, and physiology. Oecologia 113:299–313. rate of atmospheric CO2 due to enhanced terrestrial carbon uptake.
Duursma RA (2015) Plantecophys - an R package for analysing Nat Commun 7:13428. https://doi.org/10.1038/ncomms13428.
and modelling leaf gas exchange data. PLoS One 10:e0143346. Kitao M, Hida T, Eguchi N, Tobita H, Utsugi H, Uemura A, Kitaoka S,
https://doi.org/10.1371/journal.pone.0143346. Koike T (2015) Light compensation points in shade-grown seedlings
Eaton E, Caudullo G, Oliveira S, de Rigo D (2016) Quercus robur and of deciduous broadleaf tree species with different successional traits
Quercus petraea in Europe: distribution, habitat, usage and threats. raised under elevated CO2 . Plant Biology 18:31–42.
In: European Atlas of Forest Tree Species, Joint Research Centre Klein T, Bader MKF, Leuzinger S, Mildner M, Schleppi P, Siegwolf
(European Commission), Brussels, pp. 160–163. ISBN 978-92-79- RTW, Körner C (2016) Growth and carbon relations of mature
36740-3, DOI: 10.2788/4251. Picea abies trees under 5 years of free-air CO2 enrichment. J Ecol
Ellsworth DS, Anderson IC, Crous KY et al. (2017) Elevated CO2 does 104:1720–1733.
not increase eucalypt forest productivity on a low-phosphorus soil. Körner C (2017) A matter of tree longevity. Science 355:130–131.
Nature Climate Change 7:279–282. Körner C, Asshoff R, Bignucolo O, Hättenschwiler S, Keel SG, Peláez-
Ellsworth DS, Thomas R, Crous KY, Palmroth S, Ward E, Maier C, Riedl S, Pepin S, Siegwolf RTW, Zotz G (2005) Ecology: carbon
Downloaded from https://academic.oup.com/treephys/article/42/1/130/6326847 by guest on 14 February 2022
Delucia E, Oren R (2012) Elevated CO2 affects photosynthetic flux and growth in mature deciduous forest trees exposed to elevated
responses in canopy pine and subcanopy deciduous trees over CO2 . Science 309:1360–1362.
10 years: a synthesis from Duke FACE. Glob Chang Biol 18: Larcher W (2003) Physiological Plant Ecology: Ecophysiology and
223–242. Stress Physiology of Functional Groups. Springer-Verlag, New York.
Farquhar GD, von Caemmerer S, Berry JA (1980) A biochemical model https://doi.org/10.1007/978-3-662-05214-3.
of photosynthetic CO2 assimilation in leaves of C3 species. Planta Leakey ADB, Ainsworth EA, Bernacchi CJ, Rogers A, Long SP, Ort DR
149:78–90. (2009) Elevated CO2 effects on plant carbon, nitrogen, and water
Feng Z, Rütting T, Pleijel H, Wallin G, Reich PB, Kammann CI, Newton relations: six important lessons from FACE. J Exp Bot 60:2859–2876.
PCD, Kobayashi K, Luo Y, Uddling J (2015) Constraints to nitrogen Liberloo M, Tulva I, Raïm O, Kull O, Ceulemans R (2007) Photosyn-
acquisition of terrestrial plants under elevated CO2 . Glob Chang Biol thetic stimulation under long-term CO2 enrichment and fertilization is
21:3152–3168. sustained across a closed Populus canopy profile (EUROFACE). New
Friedlingstein P, Betts R, Bopp L et al. (2006) Climate –carbon cycle Phytol 173:537–549.
feedback analysis, results from the C4MIP model intercomparison. J Limousin JM, Bickford CP, Dickman LT, Pangle RE, Hudson PJ, Boutz
Climate 19:3337–3353. AL, Gehres N, Osuna JL, Pockman WT, Mcdowell NG (2013)
Friedlingstein P, Jones MW, O’Sullivan MA et al. (2019) Global carbon Regulation and acclimation of leaf gas exchange in a piñon-juniper
budget 2019. Earth Syst Sci Data 11:1783–1838. woodland exposed to three different precipitation regimes. Plant Cell
Griffin KL, Tissue DT, Turnbull MH, Whitehead D (2000) The onset Environ 36:1812–1825.
of photosynthetic acclimation to elevated CO2 partial pressure in Luo Y, Su B, Currie WS et al. (2004) Progressive nitrogen limitation of
field-grown Pinus radiata D. don. After 4 years. Plant Cell Environ ecosystem responses to rising atmospheric carbon dioxide. Bio Sci
23:1089–1098. 54:731–739.
Gunderson CA, Sholtis JD, Wullschleger SD, Tissue DT, Hanson PJ, Luyssaert S, Schulze ED, Börner A, Knohl A, Hessenmöller D, Law BE,
Norby RJ (2002) Environmental and stomatal control of photo- Ciais P, Grace J (2008) Old-growth forests as global carbon sinks.
synthetic enhancement in the canopy of a sweetgum (Liquidambar Nature 455:213–215.
styraciflua L.) plantation during 3 years of CO2 enrichment. Plant Cell MacKenzie R, Krause S, Hart K et al. (2021) BIFoR FACE: water-
Environ 25:379–393. soil-vegetation-atmosphere research in a temperate deciduous for-
Gunderson CA, Wullschleger SD (1994) Photosynthetic acclimation in est catchment, including under elevated CO2 . Hydrol Process
trees to rising atmospheric CO2 : a broader perspective. Photosynth 35:e14096. https://doi.org/10.1002/hyp.14096.
Res 39:369–388. Medlyn BE, Badeck FW, De Pury DGG et al. (1999) Effects of elevated
Hart KM, Curioni G, Blaen P et al. (2020) Characteristics of free air [CO2 ] on photosynthesis in European forest species: a meta-analysis
carbon dioxide enrichment of a northern temperate mature forest. of model parameters. Plant Cell Environ 22:1475–1495.
Glob Chang Biol 26:1023–1037. Medlyn BE, Zaehle S, De Kauwe MG et al. (2015) Using ecosys-
Hättenschwiler S (2001) Tree seedling growth in natural deep shade: tem experiments to improve vegetation models. Nat Clim Change
functional traits related to interspecific variation in response to 5:528–534.
elevated CO2 . Oecologia 129:31–42. Mölder A, Meyer P, Nagel RV (2019) Integrative management to sustain
Hättenschwiler S, Miglietta F, Raschi A, Körner C (1997) Thirty years biodiversity and ecological continuity in Central European temperate
of in situ tree growth under elevated CO2 : a model for future forest oak (Quercus robur, Q. petraea) forests: an overview. For Ecol Manage
responses? Glob Chang Biol 3:463–471. 437:324–339.
Hendrey G, Ellsworth D, Lewin K, Nagy J (1999) A free-air enrichment Norby RJ, De Kauwe MG, Domingues TF et al. (2016) Model-data
system for exposing tall forest vegetation to elevated atmospheric CO synthesis for the next generation of forest free-air CO2 enrichment
2. Glob Chang Biol 5:293–309. (FACE) experiments. New Phytol 209:17–28.
Herrick JD, Thomas RB (2001) No photosynthetic down-regulation in Norby RJ, Zak DR (2011) Ecological and evolutionary lessons from free
sweetgum trees (Liquidambar styraciflua L.) after three years of CO2 air carbon enhancement (FACE) experiments. Annu Rev Ecol Evol Syst
enrichment at the Duke Forest Face experiment. Plant Cell Environ 42:181–203.
24:53–64. Nowak RS, Ellsworth DS, Smith SD (2004) Functional responses
Jiang M, Medlyn BE, Drake JE et al. (2020) The fate of car- of plants to elevated atmospheric CO2 - do photosynthetic and
bon in a mature forest under carbon dioxide enrichment. Nature productivity data from FACE experiments support early predictions?
580:227–231. New Phytol 162:253–280.
Jones CD, Ciais P, Davis SJ et al. (2016) Simulating the Earth Ostle NJ, Levy PE, Evans CD, Smith P (2009) UK land use
system response to negative emissions. Environ Res Lett 11:095012. and soil carbon sequestration. Land Use Policy 26:S274–S283.
https://doi.org/10.1088/1748-9326/11/9/095012. https://doi.org/10.1016/j.landusepol.2009.08.006.
Tree Physiology Online at http://www.treephys.oxfordjournals.orgYou can also read