Forest Ecology and Management - DORA 4RI
←
→
Page content transcription
If your browser does not render page correctly, please read the page content below

Forest Ecology and Management 504 (2022) 119819

                                                                     Contents lists available at ScienceDirect

                                                          Forest Ecology and Management
                                                           journal homepage: www.elsevier.com/locate/foreco

Temperature effect on size distributions in spruce-fir-beech mixed stands
across Europe
Sonia Condés a, *, Miren del Río b, c, David I. Forrester d, Admir Avdagić e, Kamil Bielak f,
Andrej Bončina g, Michal Bosela h, i, Torben Hilmers j, Aida Ibrahimspahić e,
Stanisław Drozdowski f, Andrzej Jaworski k, Thomas A. Nagel g, Zuzana Sitková h,
Jerzy Skrzyszewski k, Roberto Tognetti l, Giustino Tonon m, Tzvetan Zlatanov n, Hans Pretzsch j
a
  Department of Natural Systems and Resources. School of Forest Engineering and Natural Resources, Universidad Politécnica de Madrid, Madrid, Spain
b
  Centro de Investigación Forestal, INIA, CSIC Ctra A Coruña km 7.5, 28040 Madrid, Spain
c
  iuFOR, Sustainable Forest Management Research Institute University of Valladolid and INIA, Spain
d
  Swiss Federal Institute of Forest, Snow and Landscape Research WSL, Zürcherstrasse 111, 8903 Birmensdorf, Switzerland
e
  Faculty of Forestry, University of Sarajevo, Zagrebačka 20, 71000 Sarajevo, Bosnia and Herzegovina
f
  Department of Silviculture, Institute of Forest Sciences, Warsaw University of Life Sciences, Nowoursynowska 159/34, 02776 Warsaw, Poland
g
  Department of Forestry and Renewable Forest Resources, Biotechnical Faculty, University of Ljubljana, Večna pot 83, 1000 Ljubljana, Slovenia
h
  National Forest Centre – Forest Research Institute Zvolen, T. G. Masaryka 22, 960 01 Zvolen, Slovakia
i
  Technical University in Zvolen, T.G. Masaryka 24, 96001 Zvolen, Slovakia
j
  Chair of Forest Growth and Yield Science, Department of Life Science Systems, TUM School of Life Sciences, Technical University of Munich, Freising, Germany
k
  Department of Ecology and Silviculture, Faculty of Forestry, University of Agriculture in Kraków, al. 29-listopada 46, 31-425 Kraków, Poland
l
  Dipartimento di Agricoltura, Ambiente e Alimenti, Università degli Studi del Molise, Via Francesco De Sanctis, 86100 Campobasso, Italy
m
   Faculty of Science and Technology, Free University of Bolzano-Bozen, Piazza Università 1, 39100 Bolzano, Italy
n
  Institute of Biodiversity and Ecosystem Research, Bulgarian Academy of Sciences, 2 Gagarin Street, 1113 Sofia, Bulgaria

A R T I C L E I N F O                                      A B S T R A C T

Keywords:                                                  Forest composed of Picea abies L., Abies alba Mill. and Fagus sylvatica L. cover a large area in the European
Matrix model                                               mountain regions and have a high ecological and socio-economic importance as they supply many ecosystems
Climate                                                    services. Because of climate change, these forests are exposed to warming, and this effect increases with
Mountain forest
                                                           elevation, which may impact their delivery of goods and services. Previous studies did not find significant
Basal area growth
Diameter distribution
                                                           changes in the overall productivity of these species over the last 30 years, but they observed changes in species
Inter-specific competition                                 competitiveness at the species and tree levels.
                                                              In this study, we aimed to link previous results on tree, species and stand level growth in spruce-fir-beech
                                                           mixed mountain forests by analysing species size distribution dynamics under different climate conditions and
                                                           their effect on stand growth. We developed a matrix model based on data from 76 long-term experimental plots
                                                           distributed throughout Europe. We used the change in stand basal area to explore whether temperature modifies
                                                           species size dominances and proportions, whether the temperature effects on changes in species basal area
                                                           depend on species size dominance, and whether the effect of species size dominance on changes in the stand
                                                           basal area varies with temperature.
                                                              Our results showed that annual mean temperature is an important climatic driver of species dynamics in
                                                           spruce-fir-beech mixed mountain forests, such that stand basal area growth was favored by higher temperatures,
                                                           particularly due to positive responses of silver fir which were greater than negative effects of temperature on
                                                           European beech. The high temperatures also favored the size-dominance of silver fir, while European beech
                                                           tended to have smaller diameters, independent of the temperature. We also found that the identity of the size-
                                                           dominant species also influenced changes in stand basal area, with the highest or the lowest changes when
                                                           Norway spruce and European beech were the size-dominant species, respectively. Silver fir was less influenced by
                                                           the identity of the size-dominant species than by temperature.

    Abbreviations: T, Mean annual temperature.
 * Corresponding author at: Dept. Sistemas y Recursos Naturales. Escuela Técnica Superior de Ingenieros de Montes, Forestal y del Medio Natural. Universidad
Politécnica de Madrid, José Antonio Nováis 10, 28040 Madrid, Spain.
    E-mail address: sonia.condes@upm.es (S. Condés).

https://doi.org/10.1016/j.foreco.2021.119819
Received 26 September 2021; Received in revised form 21 October 2021; Accepted 22 October 2021
Available online 2 November 2021
0378-1127/© 2021 The Authors.              Published by Elsevier B.V. This is an open                                   access     article   under     the       CC   BY-NC-ND   license
(http://creativecommons.org/licenses/by-nc-nd/4.0/).
S. Condés et al. Forest Ecology and Management 504 (2022) 119819
Therefore, although mixed mountain forests of spruce-fir-beech were found to be resilient systems in terms of
stand productivity, we conclude that increasing temperatures may modify species dynamics and consequently
silvicultural interventions will be needed to control species proportions and dominances.
1. Introduction productive stands were spruce-fir-beech mixed stands with lower
evenness, higher skewness, and where spruce occupy the size dominant
In European mountain regions, a large forest area is covered by stratum and beech the suppressed stratum. However, to what extent
mixed mountain forests composed by Norway spruce (Picea abies L.), species size dominance is influenced by climate conditions in these
silver fir (Abies alba Mill.) and European beech (Fagus sylvatica L.) mixed mountain forests has not been examined.
(hereinafter spruce, fir and beech, respectively) (Hilmers et al., 2019). Diameter distributions have long been used in forest biometry to
Their high ecological and socio-economic importance is evidenced by summarise stand structure due their easy estimation from forest in
the large number of ecosystem services (ESs) they supply (e.g. Pretzsch ventories. They are often employed as structure indicators for density
et al., 2015a). As with other forest ecosystems, they are exposed to and species composition control (O’Hara and Gersonde, 2004; del Río
climate change, which may strongly impact their capacity to deliver ESs et al., 2016). Their direct effect on stand growth depends on the rela
(Mina et al., 2018). Although the potential impacts of climate change on tionship between tree size and tree growth, which depends on envi
European mountain forests and their goods and services are considered ronmental and competitive conditions (Forrester, 2019). Size
to vary depending on the local context (Lindner et al., 2010), a generally distributions therefore help to link tree, species and stand level growth
higher exposure to warming with increasing elevation is observed patterns. In this study, we aim to link above mentioned results on tree,
worldwide (Pepin et al., 2015), while the changes in precipitation are species and stand level growth in spruce-fir-beech mixed mountain
still highly uncertain and will depend on the local geomorphological forests by analysing species size distribution dynamics under different
heterogeneity of mountainous landscapes (Maroschek et al., 2009). climate conditions and their effect on stand growth. When summarising
However, at high elevations dominate forest productivity is driven by the effects of important stand structural characteristics and environ
temperature, whereas precipitation would not be such an important mental conditions on growth, it is pertinent to use forest growth models.
factor (Babst et al., 2013). Accordingly, elevation-dependent changes in Matrix models can be particularly useful for examining the influence of
forest dynamics have been recently reported for spruce-fir-beech mixed size distributions (Drozdowski, 2006). When classifying forest dynamics
forests (del Río et al., 2021). models depending on their level of description of the forest, Matrix
Productivity is a key forest feature related directly and indirectly to models, dealing with size classes, can be placed between stand models,
important goods and services such as wood yield, carbon sequestration, which predict the temporal changes of population level attributes, and
nutrient cycling, or water regulation (Biber et al., 2015; Dieler et al., individual tree models (Liang and Picard, 2013). Therefore, we selected
2017; Calama et al., 2021). Although forest productivity has always this modelling approach and developed a matrix model using data from
been an important issue in forest science, more attention is now being 76 long-term experimental plots distributed throughout Europe. We
given to climate change and stand structural effects on stand growth (e. used the change in basal area (i.e., differences between the stand basal
g. Zhang et al., 2012; Pretzsch et al., 2014; Dănescu et al., 2016; For area of alive trees at two inventories, ΔG) to explore species and stand
rester, 2019). Stand volume increment of spruce-fir-beech mixed stands dynamics, since basal area is directly derived from diameter distribu
was found to be influenced by elevation-dependent temperature, but tions obtained from the matrix model and is closely related to species
despite a significant increase in annual mean temperature, the overall and stand productivity.
productivity has not changed significantly over the last 30 years We asked the following specific questions:
(Hilmers et al., 2019). However, changes in species competitiveness Q1. Does temperature modify species size dominances and
were observed at the species and tree levels. At the species level, a proportions?
positive trend was observed in the mixed stands during the last 30 years Q2. Do the temperature effects on changes in spruce, fir, beech basal
only for fir, whereas beech maintained constant productivity and spruce areas depend on species size dominance?
productivity decreased (Hilmers et al., 2019). At the tree level, growth Q3. Does the effect of species size dominance on stand changes in
trend analyses of dominant trees for the last few centuries showed basal area vary with temperature?
positive trends for all three species, which were especially prominent for Our main hypotheses were: H1: Temperature, mediated by site
fir and beech at higher elevations, where their competitiveness increases elevation and climate warming, is an important climatic driver of spe
at the expense of spruce (Bošeľa et al., 2014; Pretzsch et al., 2020b). cies dynamics in spruce-fir-beech mixed mountain forests; H2: Warming
Other studies comparing beech growth in monospecific and mixed temperatures reduce spruce productivity and increase fir productivity,
mountain forests found that dominant beeches were promoted by while the effect on beech productivity depends on size distribution; H3:
mixture, especially at high elevations (Bosela et al., 2015; Pretzsch et al., Stand productivity increases with spruce size dominance.
2021b).
It is well recognised that tree species diversity can significantly in 2. Materials and methods
crease stand productivity (e.g. Liang et al., 2016; Pretzsch and Forrester,
2017). But there is increasing evidence that other stand structural 2.1. Data
characteristics are also important. The most relevant characteristics
include vertical stratification and canopy packing (Riofrío et al., 2017; Data from 76 permanent experimental sample plots located in
Williams et al., 2017), variation in tree sizes (Zeller et al., 2018), the mountain areas of seven countries were used (Table 1). Plots were
partitioning of growth between different sized trees (asymmetry of located in mixed stands dominated by Abies alba Mill. (fir), Fagus syl
competition (Forrester, 2019)), the shapes of size distributions (Dănescu vatica L. (beech) and Picea abies (L.) Karst (spruce), with only small
et al., 2016; Forrester, 2019), and species dominance (Cheng et al., percentages of other species. The mean area of the sample plots was
2018). For spruce-fir-beech mixtures, it was found that stand volume around 0.5 ha, although there was a large variability, ranging from 0.04
increment did not depend on species proportions or species dominance to 2.63 ha. Inside the plots, all trees with diameter at 1.3 m larger than or
in basal area (Hilmers et al., 2019), but species size distributions equal to 7.5 cm were measured and classified as survivors, dead,
(skewness and species size dominance) had an important effect (Torre ingrowth, cut or removed, this last group consisting of trees that dis
san et al., 2020). According to Torresan et al., (2020), the most appeared between two consecutive surveys without registering whether
2
S. Condés et al. Forest Ecology and Management 504 (2022) 119819
Table 1 diameter class between t and t + Δt.
Number of permanent sample plots and number of surveys at the beginning of Transition matrix for the species sp at time t was defined as:
the 10-year growth periods used for the study. For each survey, the data cor ⎛ ⎞
responding to the end of the growth period was also used. asp1,t 0 ⋯ 0
⎜ bsp1,t asp2,t ⋮ ⎟
Country Number of Number of plots Surveys Years ⎜ ⎟
⎜ b ⎟
plots at the initial per plot Trspt = ⎜
⎜
sp2,t ⎟
⎟
surveys ⎜ ⎟
⎝ ⋮ aspn− 1,t ⎠
Bosnia_Herzegovina 5 5 2 2006 to 0 bspn− 1,t aspn,t
2016
Bulgaria 1 1 2 1995 to
2005
where, for the species sp, aspk,t is the probability that a tree in diameter
Germany 38 78 2 to 5 1953 to class k remains alive in the same class between times t and t + Δt, bspk,t is
2016 the probability that the tree remains alive and grows into the next
Poland 10 32 3 to 5 1976 to diameter class, k + 1; n represents the number of diameter classes.
2016
Ingrowth matrix for the species sp at time t, Ispt , was defined as:
Slovakia 6 10 2 to 4 1967 to
2016 ⎛ ⎞
ispt
Slovenia 6 15 2 to 4 1973 to
⎜ 0 ⎟
2012 Ispt = ⎝ ⋮ ⎠
Switzerland 10 66 2 to 14 1912 to
0
2014
TOTAL 76 207 1912 to The ispt is the ingrowth of the species sp, i.e., the number of trees
2016
recruited in the smallest diameter class, while for the greater classes the
ingrowth was assumed to be null.
they were cut or dead. Plots were located mainly in unmanaged or The elements of the transition matrix were calculated as bspk,t =
lightly managed stands. To avoid possible distinct effects of heavy har idspk,t /Δ and aspk,t = 1 − bspk,t − mspk,t , where idspk,t is the annual diameter
vestings or high mortality events on the size distribution dynamics, growth of a tree of species sp in the class k, Δ is the width of the diameter
surveys in which the basal area percentages of cut/removed or dead class, and mspk,t is the probability that a tree of same species and diam
trees were larger than 20% were removed. This resulted in a set of eter class k dies in the time interval t to t + Δt. Both idspk,t and mspk,t were
67,309 sample trees of 207 surveys from the 76 long term experimental estimated for each year and diameter class using the diameter growth
plots, which were measured at approximately 10-year intervals. Table 2 and probability of mortality models respectively (see Section 2.3),
shows the main stand variables of the initial surveys, for a more detailed where the independent variables required for the estimation were
data overview, see Supplementary tables 1–3. calculated at each year t from the vector containing the number of trees
Monthly data for mean temperature and precipitation were collected per diameter class yspt .
from the closest available meteorological stations. If the weather station The ingrowth rate it was obtained as the product of the probability of
was located at a different elevation to the plot, an elevation correction positive ingrowth (recruitment occurrence) and of the expected
was used based on a lapse rate of − 0.38 ◦ C per 100 m for temperature ingrowth amount, conditional on positive recruitment, being both state
and a scaling factor 0f + 61 mm per 100 m for precipitation. Missing and species dependent. The probability of ingrowth and the number of
values were completed using gridded data from the Climatic Research ingrowth trees were obtained for each year t from the two respective
Unit (CRU) Time-Series (TS) Version 3.10 database (Harris et al., 2020). models described in Section 2.3.
The four closest to the plot pixels were selected from CRU and their
climate values were averaged with a weighting by distance. Then, the 2.3. Growth, mortality, and ingrowth models
common period of the two series (observed and CRU series) were used to
adjust the CRU series to local conditions. Diameter growth idk,t and probability of mortality mk,t were obtained
from individual tree models, while the probability of positive ingrowth
and the expected ingrowth amount were obtained from stand level
2.2. Matrix model structure
models. The same competition indicators were used in all the models,
including the basal area, G, and the basal area of trees with diameter
The matrix growth model was formulated as follows:
larger than or equal to the target tree, BAL (Wykoff, 1990), which are
yspt+Δt = Trspt ⋅yspt + Ispt frequently used in growth models (Weiskittel et al., 2011).
For testing the presence of between-species interactions, the
where, for each species, yspt is a column vector representing the number competition status was expressed as the sum of the species’ competition,
of alive trees of this species per diameter classes at time t. Trspt is the i.e., sum of per species G and BAL. In addition, the possible effect of
state-dependent transition matrix, which describes changes, between spatio-temporal variation of temperature was analysed by including
time t and t + Δt, in the number of trees per unit area in diameter classes mean annual temperature T as a single independent variable or as in
according to their growth and mortality. Ispt is a state-dependent column teractions with G terms, which was decided after a preliminary explo
vector representing the recruitment of this species in the smallest ration and in order to maintain the model as parsimonious as possible.
Table 2
Summary of main characteristics of the initial surveys, at the plot level and by species. N is the number of trees per ha, G is basal area, dg the quadratic mean diameter,
T annual mean temperature, sd is the standard deviation, min and max are minimum and maximum values, respectively.
Abies alba Fagus sylvatica Picea abies
N G dg T N G dg N G dg N G dg
stems/ha m2/ha cm ◦
C stems/ha m2/ha cm stems/ha m2/ha cm stems/ha m2/ha cm
Mean 524 38.7 32.6 6.3 157 13.5 36.9 158 7.8 25.0 185 16.3 36.5
Sd 230 11.9 9.0 1.0 151 11.5 14.9 165 8.6 10.7 141 12.8 13.1
Min 152 15.6 17.7 3.0 2 0.0 9.8 1 0.0 8.5 1 0.0 7.6
Max 1341 79.8 63.2 8.5 565 56.0 90.7 754 41.8 63.2 572 68.1 84.9
3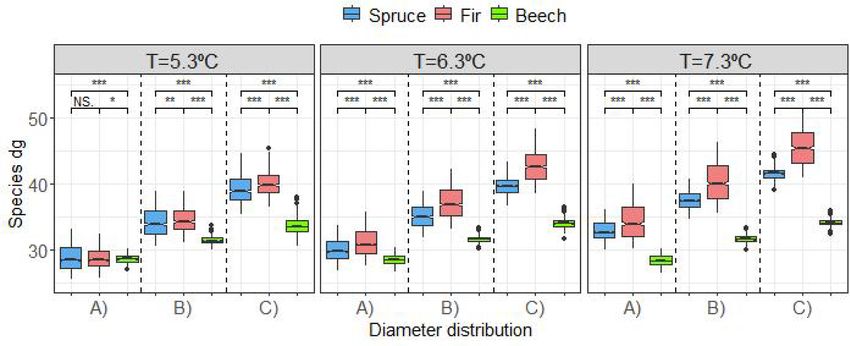
S. Condés et al. Forest Ecology and Management 504 (2022) 119819
Tree-level diameter growth models were formulated for each species ingrowth occurrence models were fitted using the function “glmer” of
including a size effect according to the model of Hugershoff (1936), the “lme4” library (Bates et al., 2015). Conditional and marginal R2 were
together with competition measures and T, as well as interaction terms: used as goodness-of-fit measures, and were obtained using the “r.
( ) ( ) ( ) ( ) ∑ ∑ ∑
log idijt = a0 + a0j + a1 + a1j ⋅dijt + a2 ⋅log dijt + a3 ⋅Tjt + bsp ⋅Gspjt + csp ⋅Gspjt ⋅Tjt + esp ⋅BALspijt + εijt
sp sp sp
squaredGLMM” function in the “MuMIn” library (Barton, 2020). For all
where idijt represents the annual diameter increment of the tree i in the the models a level of p = 0.05 was used for significance testing of the
plot j at the survey t. dijt is the diameter at 1.3 m of that tree. Gspjt is the variables, and Akaike’s information criterion (AIC) was used to compare
basal area of the species sp in the plot j, survey t. BALspijt the basal area of results and to select among different model’s structures, for instance
trees of the species sp larger or equal than the tree i, and T the mean those where the competition variables were not split up by species.
annual temperature, in the same plot and survey. Finally, sp is each one
of the species studied, ie. fir, beech, spruce, and other minor species
grouped together. Since the data came from a hierarchical structure, 2.4. Projection of diameter distributions
with several trees measured in the same plot j, mixed models were fit
including random effects in both intercept and diameter terms with the To answer the specific questions stated in the introduction, different
plot as the grouping structure. species diameter distributions were set up to further simulate their dy
Similarly, tree-level mortality models for each species were devel namics. Three initial diameter distributions with similar basal area but
oped. As tree mortality is a discrete event and, considering the possible different quadratic mean diameters were used (Fig. 1).
correlation between trees measured in the same plot, a generalized To analyse whether temperature modifies the species size domi
linear mixed model approach following a binomial family, i.e., logistic nances and proportions (Q1), three different mixed stands of the studied
regression, was used. Tree size was described by d and the second power species were considered, representing different stages of stand devel
of this variable, transformation frequently included in mortality models opment (quadratic mean diameter, dg, around 22.4, 27.4 and 32.5
to get the characteristic U-shape (Monserud and Sterba, 1999; Jutras respectively). These figures were defined according to the values in the
et al., 2003; Zhao et al., 2004). The general expression of the logit dataset (Supplementary table 4), ensuring that after projecting the
function was: initial distributions the resulting values were inside the data range.
Within each stand the three species, fir, beech and spruce, had the same
( ) ( ) ∑ ∑
2
logit mijt = a0 + a0j + a1 ⋅dijt + a2 ⋅dijt + a3 ⋅Tjt + bsp ⋅BALspijt + csp ⋅BALspijt ⋅Tjt + εijt
sp sp
diameter distribution (Fig. 1A–C). Therefore, each species contributed a
where mijt is the probability that the tree i with dijt dies in the plot j, third of the total stand basal area and they had the same degree of size
survey t, and BALspijt are the basal area of larger trees of each studies dominance.
species in the same plot and survey, respectively. Tjt is the mean annual To analyse the interactive effects of temperature and size dominance
temperature. Mortality models were fit as mixed models, including on species and stand growth (Q2 and Q3), three mixed stands composed
random effects in the intercept, and using the plot as the grouping of the three species were considered. However, in these cases, each
structure. species contributed a third of the total stand basal area, although they
Two different ingrowth plot-level models were developed for each had a different degree of size dominance, meaning a different dg. So, for
species, first one for the probability of ingrowth in each survey, rjt , and these stands there was one size dominant species (Fig. 1C) while the
therefore formulated as a generalized linear mixed model approach other two had smaller but similar sizes (Fig. 1A).
following a binomial family, and a second one for the expected number For each one of the 3 + 3 scenarios, 1000 initial diameter distribu
of ingrowth stems, Nijt , in the plots with positive recruitment formulated tions were randomly simulated. The distributions were truncated at the
as a mixed model, both of them with plot as grouping structure. After a lower limit of the diameters of the study plots, i.e. 7.5 cm, and the width
preliminary test of models’ structure, the general expression for the of the diameter classes was always 10 cm because the ingrowth trees in
models was: the study plots had diameters between 7.5 and 17.5 cm. Moreover,
( ) ( ) ∑ ∑ variability in the initial distributions was allowed, so the total stand
logit rjt = a0 + a0j + a1 ⋅Tjt + bsp ⋅Gspjt + csp ⋅Gspjt ⋅Tjt + εjt basal area average was around 33 m2/ha but ranged between approxi
sp sp
mately 20 and 45 m2/ha. For the dominance in size, the dg was set so
( ) ( ) that the dominant species dg ranged from 29 to 36 cm, while the other
log Nijt = a0 + a0j + b1 ⋅Gjt + b2 ⋅Gjt ⋅Tjt + εjt
two dg ranged from 20 to 25 cm.
The Gspjt was the basal areas of each species in the plot j at survey t From each initial distribution both the state-dependent transition
and Gjt the total basal area for same plot and survey. Note that due to the matrix and the state-dependent ingrowth matrix were obtained, and
reduced number of plots with positive recruitment, total basal area was then projected 10 years into the future. The obtained distributions were
used instead of separating it by species. projected two more times to obtain the final distribution of alive trees
The diameter growth and the expected number of ingrowth models per diameter classes 30 years later. The time interval was set to 10 years
were fitted using the “lme” function while probability of mortality and because it was approximately the time elapsed between surveys in the
studied data. The projections considered three different temperature
4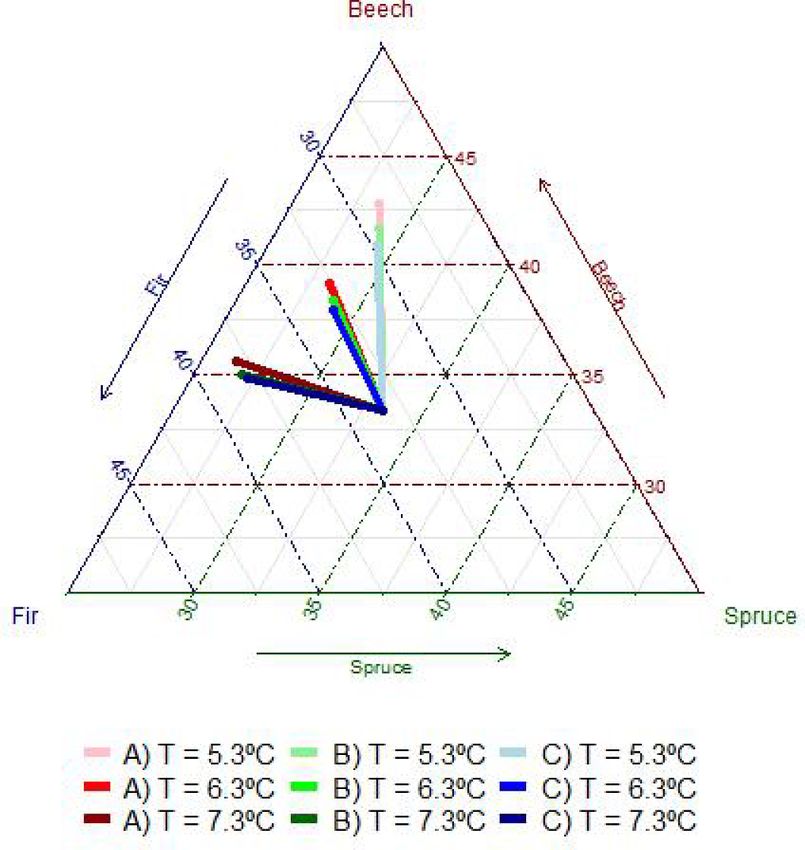
S. Condés et al. Forest Ecology and Management 504 (2022) 119819
Fig. 1. Histogram and empirical distribution functions of the averaged initial diameter distributions used as starting point simulations; dg is quadratic mean diameter
in cm and G is basal area in m2/ha.
Table 3 Table 4
Parameter estimates and standard errors (StdE) for the diameter growth models. Parameter estimates and standard errors (StdE) for the mortality models. StdRnd
StdRnd represents the standard deviation of the random effects associated with represents the standard deviation of the random effects associated to the inter
the intercept, the initial diameter, or the residual, R2m and R2c are respectively cept, R2m and R2c are respectively the marginal and conditional R2.
the marginal and conditional R2. logit(m) Fir Beech Spruce
log(id) Fir Beech Spruce Value StdE Value StdE Value StdE
Value StdE Value StdE Value StdE
Intercept − 3.6930 0.3381 2.6239 1.1092 0.1282 0.7179
Intercept − 8.3983 0.1877 − 4.0845 0.3733 − 5.8706 0.3364 d − 0.0278 0.0048 − 0.0846 0.0094 − 0.0782 0.0065
d − 0.0345 0.0023 − 0.0295 0.0041 − 0.0397 0.0028 d2 0.0003 0.0000 0.0012 0.0001 0.0010 0.0001
log(d) 1.5923 0.0342 1.1717 0.0558 1.5706 0.0368 T − 0.9671 0.1793 − 0.5376 0.1033
T 0.7405 0.0289 0.2004 0.0558 0.4453 0.0492 BAL.Fir − 0.4662 0.0513 − 0.4622 0.0868 − 0.7334 0.0690
G.Fir BAL.Fir*T 0.0782 0.0077 0.0763 0.0131 0.1165 0.0104
G.Fir*T − 0.0060 0.0005 − 0.0061 0.0006 − 0.0082 0.0008 BAL.Beech 0.2614 0.0673 0.0713 0.0120 0.3801 0.0941
G.Beech 0.0742 0.0191 − 0.0473 0.0087 BAL.Beech*T − 0.0331 0.0089 − 0.0447 0.0139
G.Beech*T − 0.0091 0.0009 − 0.0138 0.0026 BAL.Spruce 0.2591 0.0410
G.Spruce − 0.0837 0.0128 0.0325 0.0107 BAL. − 0.0390 0.0065 0.0067 0.0013
G.Spruce*T − 0.0081 0.0005 0.0045 0.0018 − 0.0117 0.0019 Spruce*T
G.Other BAL.Other 0.2952 0.0616
BAL.Fir − 0.0163 0.0028 − 0.0224 0.0049 BAL.Other*T
BAL.Beech − 0.0404 0.0048 − 0.0780 0.0075 StdRnd. 1.1770 1.0600 1.6420
BAL.Spruce 0.0220 0.0074 − 0.0105 0.0026 Intercept
BAL.Other − 0.0834 0.0244 − 0.1304 0.0197 AIC 9828 5304 9567
StdRnd. 0.7419 0.6560 1.0836 R2m 0.1426 0.1859 0.1369
Intercept R2c 0.3966 0.3931 0.5257
StdRnd d 0.0126 0.0177 0.0137
StdRnd 0.7659 0.7040 0.7617
Residual temperatures. Similarly, the competition from larger trees was in gen
AIC 42,552 23,690 49,390 eral negative. The exception was the effect of spruce on beech diameter
R2m 0.3304 0.3417 0.3078
growth, with the largest trees having a positive effect and the compe
R2c 0.6664 0.5560 0.7124
tition effect being less negative when the temperature increased. Inter
estingly, there was a positive effect of intra-specific competition in
scenarios, with constant temperatures of 5.3, 6.3 and 7.3 ◦ C maintained beech, and of inter-specific competition of fir in spruce, which only
throughout the 30 years. The diameter distributions obtained after the occurred at lower temperatures.
30-year projections were analysed by looking for differences in species Temperature did not directly affect the probability of mortality
size distributions and basal area change (ΔG, the basal area at the end of although it modified the effects of competition (Table 4). As for diameter
30 years of projection minus the initial basal area divided by the time growth, the effects of intra- and inter-specific competition terms on the
interval) under different temperatures. mortality varied among species. Generally, the greater the competition,
the greater the probability of mortality (Table 4). Temperature
3. Results increased the intraspecific competition effect of fir and spruce. It also
modified the interspecific effect of spruce on fir, and of fir on spruce, but
3.1. Growth, mortality, and ingrowth models with opposing effects, resulting in a reduction in mortality for high
temperatures in fir and for low temperatures in spruce. For fir and
There was a positive effect of mean annual temperature, T, on tree spruce, high temperature also influenced mortality by reducing the ef
growth for all species (Table 3). In general, both inter- and intra-specific fect of competition with beech. The mortality of beech was affected by
basal area had a negative effect on diameter growth; however, the ef interspecific competition with fir so that the higher the temperature the
fects of competition were species specific, and consequently the higher the effect of competition.
parameter values differed from each other (Table 3). Furthermore, these The results of species ingrowth probability models show that tem
negative effects of competition were generally magnified at higher perature had a positive effect on the probability of ingrowth except for
5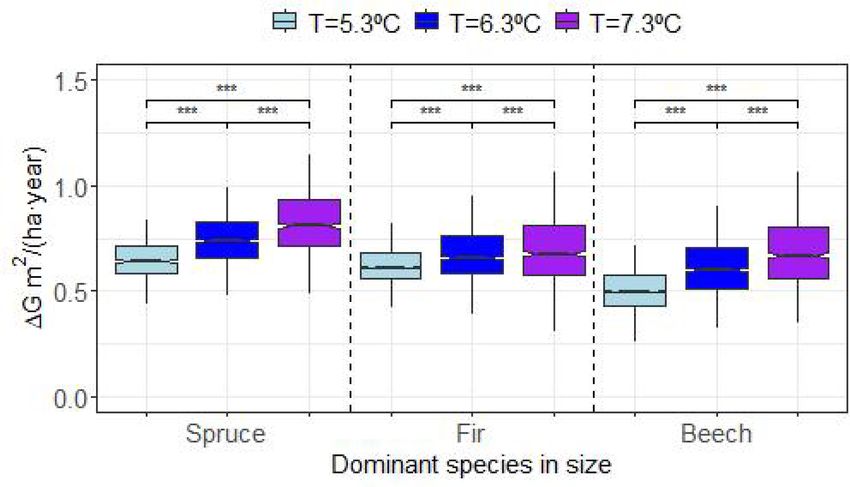
S. Condés et al. Forest Ecology and Management 504 (2022) 119819
Table 5
Parameter estimates and standard errors (StdE) for the ingrowth probability models. StdRnd represents the standard deviation of the random effects associated with the
intercept, R2m and R2c are the marginal and conditional R2, respectively.
logit(r) Fir Beech Spruce
Value StdE Value StdE Value StdE
Intercept − 14.0103 4.2830 18.6932 6.4795 − 18.8724 6.0440
T 2.5072 0.6839 − 2.3336 0.9534 3.2974 0.9776
G.Fir − 0.7104 0.3085
G.Fir*T 0.1023 0.0464
G.Beech − 0.1134 0.0492
G.Beech*T − 0.0371 0.0097
G.Spruce − 0.6687 0.2331 0.6043 0.2285
G.Spruce*T − 0.0197 0.0072 0.0862 0.0351 − 0.1024 0.0372
G.Other
G.Other*T
StdRnd intercept 2.5780 1.9930 2.5820
AIC 170 201 186
R2m 0.4800 0.3719 0.4140
R2c 0.8278 0.7154 0.8063
3.2. Influence of temperature on the species size dominances and
Table 6
proportions
Parameter estimates and standard errors (StdE) of the number of ingrowth trees
for ingrowth models. StdRnd represents the standard deviation of the random
Fig. 2 shows the diameter distribution obtained for each stage of
effects associated to the intercept and residuals, R2m and R2c are respectively
the marginal and conditional R2. stand development after 30 years of projecting initial diameter distri
butions (Fig. 1) using the three mean annual temperatures as possible
log(Ni) Fir Beech Spruce
scenarios. The species size distribution development was affected by the
Value StdE Value StdE Value StdE
temperature (Fig. 2). In general, beech had a greater number of stems in
Intercept 3.8893 0.6024 3.8663 0.2787 5.2913 0.7168
the lowest diameter classes. The diameter distributions of fir and spruce
T
G.Fir 0.1970 0.0830 were more similar to each other, although fir had more trees in the
G.Fir*T − 0.0323 0.0120 − 0.0082 0.0032 lowest diameter classes, and the differences increased with temperature,
G.Beech − 0.4574 0.1186 especially for the distribution A at the highest temperature scenario
G.Beech*T 0.0554 0.0156 − 0.0183 0.0050 (7.3 ◦ C), where fir tended to have a larger number of stems in all the size
G.Spruce − 0.0698 0.0236 − 0.0702 0.0215
classes.
G.Spruce*T − 0.0074 0.0025
G.Other − 0.2235 0.0837 After the projection the stand structure generally tended to be
G.Other*T organized so that beech was the smaller species in terms of dg, while the
StdRnd 0.9145 0.9515 1.0075 dominance of fir and spruce was similar at the coldest scenario (T =
Intercept
5.3 ◦ C) but at the warmest scenario (T = 7.3 ◦ C) fir became the dominant
StdRnd 0.6513 0.9140 0.9788
Residual species (Fig. 3). The stage of stand development also influenced the size
AIC 275 451 362 distribution, enhancing the effect T. That is, for the youngest stands,
R2m 0.2186 0.1564 0.1936 differences among dg were not so clear, especially at the coldest sce
R2c 0.7370 0.5952 0.6084 narios, increasing the differences for mature stands (initial distribution
C). Moreover, the dg of the resulting diameter distributions had more
beech (Table 5). Competition, on the other hand, had a negative effect, variability for fir than for beech or spruce, especially at the highest
which was generally stronger at high temperatures. However, temper temperature scenario (Fig. 3).
ature did not affect the interspecific effect of beech on fir. Also, the In addition, high temperatures clearly favored fir and hindered beech
higher the competition the lower the number of ingrowth trees, but this and spruce basal area development, with a much greater negative effect
number was not directly affected by temperature (Table 6). on spruce. That is, independently of the stage of stand development, at
In summary, T directly affected the three studied species, such that the coldest scenarios the proportion of fir was reduced, and the pro
the higher the T the greater the diameter growth. It also directly affected portion of beech was increased, while for the temperature of 7.3 ◦ C it
beech and spruce so that the greater the temperature the lower the was the proportion of spruce which was clearly reduced (Fig. 4).
probability of mortality, and for fir and spruce T also increased the
probability of ingrowth. In addition, T modulated the competition ef 3.3. Influence of the temperature and species size dominance in species
fects. Intraspecific competition reduced the diameter growth and basal area changes
increased the probability of mortality, this last effect was enhanced with
temperature except for beech. Interspecific competition reduced the Fig. 5 shows the diameter distribution obtained for each case of size
diameter growth and increased the mortality, except for the interaction dominance after 30 years of projecting distributions using the three
between fir and spruce, which at high temperatures reduced the mor mean annual temperatures as possible scenarios. The species size
tality of fir and at low temperatures reduced the mortality of spruce. dominance determined the final diameter distributions. When spruce or
Interspecific competition also reduced the probability of recruitment fir were dominant, in general they maintain their dominance, with the
although this effect could be more important or milder depending on the other species, especially beech, developing larger number of trees in the
species and temperatures. lower diameter classes. In contrast, when beech was the size dominant
Parameter estimates for the other minor species models have been species the three diameter distributions tended to equalize.
included as supplementary Table 5. The species basal area derived from the diameter distributions
showed that the change in basal area of fir was much less influenced by
the identity of the size dominant species (Fig. 6b) than by temperature,
which strongly increased fir basal area. Beech was also affected by
6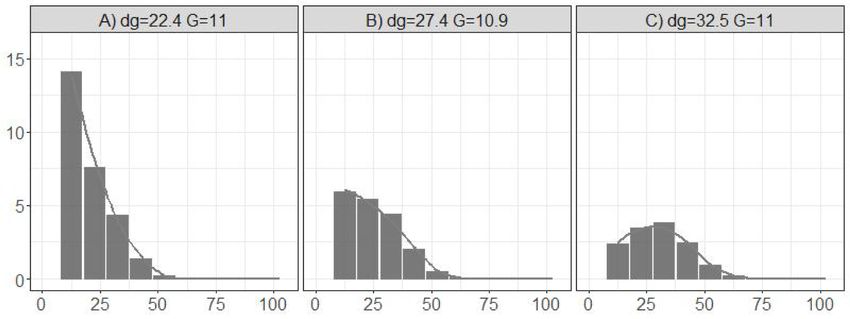
S. Condés et al. Forest Ecology and Management 504 (2022) 119819
Fig. 2. Diameter distributions obtained after 30 years of development for different mean annual temperatures T (◦ C) and different initial diameter distributions (A, B
and C according to Fig. 1).
temperature, although in the opposite way, whereas the effect of T on 3.4. Influence of temperature and species size dominance on the stand
spruce basal area was slight. Beech was the species reaching the highest basal area change
basal area after 30 years (i.e., greater basal area change) at the coldest
temperature (Fig. 6c), however for the mild and warmest scenarios fir Total stand basal area changes derived from the analysed diameter
showed a similar increment in basal area. Furthermore, independently distributions (Fig. 5) can be seen in Fig. 7. In general, there were sig
of the temperature, the basal area growth of beech was lower when it nificant differences in stand basal area changes among temperatures for
was the size dominant species. The opposite occurred for spruce, which a given size dominance, with a positive effect of temperature, but they
for a given temperature showed the highest basal area change when it were less evident when fir was the dominant species (Fig. 5b). For a
was the dominant species (Fig. 6a) although the differences were not as given temperature scenario, the highest changes in the stand basal area
evident as for beech. were obtained when the size dominant species was spruce, while when
beech was the size dominant species the change in basal area was the
lowest. Temperature was also important, such that the higher the tem
perature the greater the variability among simulations for the same size
dominance case.
7
S. Condés et al. Forest Ecology and Management 504 (2022) 119819
Fig. 3. Quadratic mean diameter by species (dg cm) obtained for different mean annual temperatures T (◦ C) and different initial diameter distributions (A, B and C
according to Fig. 1). P value for significant differences “NS”=non– significant, “***”=0.001, “**”=0.01, “*”=0.05.
4.1. Methodological approach
Matrix models have been used for decades (Usher, 1966; Usher,
1969) to study the dynamics of uneven-aged or all-aged stands or mixed
stands (Liang et al., 2005; Liang and Picard, 2013; Ficko et al., 2016),
and have been developed to examine climate effects using climate var
iables for transition matrix calculation (Liang and Picard, 2013; Du
et al., 2021), as in this study. The design of matrix models requires
careful consideration of two important characteristics: the time step and
the width of size classes. It is recommended that the timestep for
empirical matrix models is consistent with the measurement interval
between surveys (Liang and Picard, 2013), and therefore we used 10
years. The width of size classes should be selected accordingly to the
time step, such that the trees do not move up more than one class (Usher,
1966). Based on Usher’s assumption we selected a class interval of 10
cm, which was also consistent with the diameter range observed for the
ingrowth trees, although the wider the class interval the higher the
variation inside classes, which could increase the prediction bias (Liang
and Picard, 2013; Pyy et al., 2020).
The model developed is based on a state-dependent transition ma
trix, which assumes that trees compete for resources so that growth,
mortality and ingrowth is determined by inter-tree competition (e.g.,
Buongiorno and Michie, 1980; Picard and Franc, 2001; Zhao et al.,
2004), and potentially even considers inter- and intra-specific compe
tition, i.e., species specific requirements (e.g. Namaalwa et al., 2005;
Martin Bollandsås et al., 2008). This allows the modelling of mixed
Fig. 4. Changes in the stand species proportion in basal area for different cases forests and the scaling up of inter-specific interactions, observed at tree
of mean annual temperature (T) and diameter distributions (A, B and C initial level in both growth and mortality (Pretzsch et al., 2015b), to the size
diameter distributions, with dg 22.4, 27.4 and 32.5 cm respectively, according distribution level and, therefore, of the relationship between stand
to Fig. 1,). structure and stand production, in a similarly detailed way as the
individual-tree models but simpler and often more efficiently (Martin
4. Discussion Bollandsås et al., 2008; Liang and Picard, 2013).
We used stand basal area as a measure of density and as a proxy for
We developed a matrix model that allowed us to identify the com competition for resources. However, different species can have very
bined effects of interspecific competition and temperature on the species different growing area requirements and basal area maxima per hectare.
size dynamics in mountain spruce-fir-beech forests. Our results showed This means that their species-specific basal area values have different
that temperature influenced species specific dynamics modifying species density effects, e.g. 40 m2/ha is dense for beech but not for spruce. It
size dominances and proportions. High temperatures favored stand would be preferable to use relative stand density indices, which consider
basal area growth, especially increasing the basal area of fir, while species specific site occupancy (Sterba et al., 2014), however there is a
reducing that of beech. However, the temperature effect on changes in lack of specific maximum size density lines at large scales suitable for the
stand basal area was weaker than the identity of the size-dominant study area.
species, such that the highest or the lowest changes occurred when Size-asymmetric competition among trees influences the spatial
spruce and beech were the size-dominant species, respectively (Torresan arrangement of diameters and this results in interactions at the indi
et al., 2020). vidual level that can shape the size distribution (Picard, 2019). Although
8
S. Condés et al. Forest Ecology and Management 504 (2022) 119819
Fig. 5. Diameter distributions obtained after 30 years of development for different mean annual temperatures T (◦ C) and different species size dominances (dominant
species with initial distribution C, and the other species with an initial distribution according to Fig. 1).
we used BAL as a measure of size-asymmetric competition (Wykoff, that take into account vertical structure, for instance through crown
1990; Weiskittel et al., 2011; Cordonnier and Kunstler, 2015; Mina et al., variables (Pretzsch et al., 2015b). In our results we implicitly consider a
2018a), many studies have shown that this assumption is often unreal positive relationship between tree diameter and tree height and there
istic. For example, competition from larger trees can be size-symmetric, fore we extrapolate the interpretation of results in terms of basal area to
and competition from smaller trees can be size-asymmetric, regardless of productivities.
whether the competition is for light or belowground resources (e.g. see One of the major challenges in forest dynamics models in general,
review by Forrester, (2019)). Therefore, linking BAL with asymmetric and in matrix models in particular, is the difficulty of estimating mor
competition could be considered an oversimplification and there may be tality and recruitment (e.g., Buongiorno and Michie, 1980; Liang et al.,
alternative variables that more directly quantify a specific type of 2005; Picard et al., 2008), In our study the models for probability of
interaction and could therefore aid interpretation of future studies. mortality and for the number of ingrowth trees showed low r-squared
A weakness of matrix models in general, and of our model in values. Mortality models also address the added difficulty of differen
particular, is that it does not consider the variation within classes, for tiating between dead and thinned trees, being in some cases indistin
instance by adding the height variation of the trees (Pyy et al., 2020). guishable and therefore grouped as removed and excluded from models.
Thus, the model could be improved by including competition indices In general, the data source heterogeneity, arising from permanent plots
9S. Condés et al. Forest Ecology and Management 504 (2022) 119819
Fig. 6. species basal area change (ΔG m2/(ha⋅year)) obtained for different size dominance cases and mean annual temperatures T (◦ C). P value for significant
differences “NS”=non– significant, “***”=0.001, “**”=0.01, “*”=0.05.
Fig. 7. Total stand basal area change (ΔG m2/(ha⋅year)) obtained for different dominance cases and mean annual temperatures T (◦ C). P value for significant
differences “NS”=non– significant, “***”=0.001, “**”=0.01, “*”=0.05.
in different countries established for different purposes, different mea previously reported for these species in central Europe (Čavlović et al.,
surement protocols, etc., made it difficult to improve estimations. 2015; Mina et al., 2018b), although climate warming is recently
Therefore, much higher variability was explained when random effects inducing growth decline in some areas of their distribution range (Gazol
were included in the models, resulting in important differences between et al., 2015; Knutzen et al., 2017; Bosela et al. 2021). Temperature ef
marginal and conditional R2. Despite this, there was a clear advantage of fects on mortality seem to be more dependent on site water conditions
using a database consisting mostly of long-term permanent sample plots (Etzold et al., 2019; Pretzsch et al., 2020a). Temperature also influenced
that are distributed widely through Europe, and therefore established competition, increasing the effect of intra-specific competition on tree
along productivity and ecological gradients, capable of providing in growth for the three species, and on mortality for fir and spruce, which
formation of forest stand dynamics which cannot be derived from forest suggests less self-tolerance at warmer sites (Zeide, 1985). Interestingly,
inventories or small temporary plots (Pretzsch et al., 2019). temperature had an important effect on species interactions, changing
species specific competitiveness in mixed stands. Interspecific compe
4.2. Temperature and competition effects on species dynamics tition generally reduced competition pressure on tree growth in this
mixture (Mina et al., 2018a), and this effect mainly increased with
Temperature is often the main limiting factor of forest growth in temperature. A similar temperature effect was reported for spruce
mountain regions (Ettinger et al., 2011; Babst et al., 2013). Our results (Forrester et al., 2013) and for several mixtures in Central Europe by
showed that higher temperatures are linked to greater tree growth rates, Mina et al. (2017), although they did not find a significant effect on
lower probabilities of mortality and greater probabilities of ingrowth. species complementarity for spruce-fir-beech mixed stands. Tempera
Positive effects of temperature on tree growth rates have been ture also modified the inter-specific competition effect on tree mortality
10S. Condés et al. Forest Ecology and Management 504 (2022) 119819
and stand ingrowth, but with distinct effects for the three species, as 4.4. Implications for forest management
found for climate effects on mortality in other mixtures (Condés and del
Río, 2015; Hülsmann et al., 2018). The stand structure is the key element for silvicultural planning in
The different inter-specific competition × temperature effects on tree mixed, multiaged stands (O’Hara, 2014). The use of different types of
growth, mortality and ingrowth reveal the complexity of species in diameter distributions determining target size structure for complex
teractions, whose net effects cannot be easily up-scaled from the tree to forest stands has been used in forest management for a long time.
the stand level (Forrester and Pretzsch, 2015; Uhl et al., 2021). Our Changing stand structure through tree removals is the main tool in forest
modelling approach allowed us to illustrate the temperature effects on management, thereby interfering in the loop of stand
species size distributions dynamics, which clearly enhances fir size structure-growth-tree size-stand structure (Pretzsch, 2009). The effects
dominance and proportion and hinders spruce proportion (Uhl et al., of stand structure on stand growth are difficult to determine using single
2021). Beech was less affected by temperature than by the dominating stand structural variables (e.g., tree size inequality, stems per ha, basal
species in terms of species proportion, which probably resulted from its area, size distributions…) because none are strongly correlated with
greater presence in lower size classes. Climate warming and increasing growth unless all the others are relatively constant. In contrast, many of
drought events modify within and between species growth partitioning, the effects of stand structure on stand growth can be explained by
having stronger effects on large than small trees in these stands (Pretzsch considering two or three of the more influential stand structural vari
et al., 2018) and on more vulnerable species (spruce and beech more ables, such as the shape of size distributions, size-growth relationships,
vulnerable than fir) (Vitasse et al., 2019; Gillerot et al., 2021). Never and stand density (Forrester, 2019). These were directly quantified in
theless, other environmental factors could influence species size domi this study to tease apart the causes of species composition and temper
nances. Many of these mixed mountain forests were strongly affected by ature on stand structure and hence stand growth.
acidic rain in the 1960–1990, which may have co-determined the Matrix models have been widely applied since their appearance
growth and especially the growth partitioning within and among spe (Usher, 1969) to understand and predict the effects of forest manage
cies. As for drought, mainly the dominant trees were affected by the SO2- ment, for instance looking for sustainable harvest rates (Drozdowski,
emissions, but in this case, fir was much more vulnerable than spruce 2006; López et al., 2007), optimizing economic outcomes (Rämö and
and beech (Vitasse et al., 2019). However, our data show greater Tahvonen, 2014) or anticipating changes in stand structure and
representativeness in the post acidic rain period (1990–2016). In sum composition (Favrichon, 1998). In our model, the inclusion of the
mary, fir may benefit from warming due to an extension of the growing climate variable provides an additional tool that could allow analyses of
season (Leuschner and Ellenberg, 2017) and from the reduction of SO2 management strategies under different climate scenarios. Our results
emissions (Uhl et al., 2013); beech may benefit from warming due to an suggest that increasing temperatures may modify species dynamics and
extension of the growing season (Leuschner et al., 2006), but can suffer interactions, resulting in different species proportions and dominances,
from late frost (Zohner et al., 2020); and spruce, on the other hand, is which are crucial for silvicultural planning and should be considered in
more vulnerable to extreme droughts (Vitasse et al., 2019; Bottero et al., forest management and silvicultural prescriptions (Pretzsch et al.,
2021) and other risks linked to climate change such as bark beetle at 2021a). The reviving vitality of fir following a reduction in the acid rain
tacks (Marini et al., 2017). Moreover, spruce often shows decreases in may be on expense of the mixing proportion and growth of spruce and
regeneration due to closed canopies (Pretzsch et al., 2015a), which may beech. The essential contribution of fir to the stand productivity may
explain predicted changes in species size distributions. reduce the species diversity and risk distribution (Jactel et al., 2017), so
that silvicultural management might balance the proportions of the
three species. The presently high productivity is an insufficient indicator
4.3. Influence of temperature and species size dominance on stand for sustainable productivity and system stability (Bowditch et al., 2020;
productivity Uhl et al., 2021). Although mixed mountain forests of spruce-fir-beech
were found to be resilient systems in terms of stand productivity
Our results confirmed the importance of tree species size dominances (Hilmers et al., 2019; Uhl et al., 2021), specific silvicultural in
on stand productivity, with greater productivity when spruce is the size terventions in favour of Norway spruce and European beech are needed
dominant species and lower when it is beech (Torresan et al., 2020). The to control species compositions to keep the demographic stability of
species size distribution simulations indicate that this effect is mediated mixed complex mountain forest stands, especially under climate
by temperature, which always had a positive effect on productivity, but warming (Pretzsch et al., 2015a).
greater when spruce was the dominant species. These results fit the
conceptual framework proposed by Forrester (2019), which highlights 5. Conclusions
the influence of environmental conditions on growth partitioning
among trees, and the relevance of size distributions and growth parti The international project community and cross-regional compilation
tioning on stand growth. of growth, structure and climate data of long-term experiments in mixed
The weak effect of temperature on stand level productivity is mountain forests enabled new insights into the growth trends and
consistent with the results reported by Hilmers et al. (2019) for this functioning of uneven-aged and multi-species stands of Norway spruce,
mixture, who did not find any temporal changes in stand productivity silver fir and European beech. Here we used a newly developed matrix
despite the climate warming. However, Hilmers et al. (2019) found a model mainly for describing and analysing the relationship between
significant elevation and temperature joint effect, with greater produc species size distribution and growth, and how it is modulated by
tivity at lower elevations, in accordance with our positive effect of temperature.
temperature and with the findings of Torresan et al. (2020). At the Our results indicate that temperature is not only related to the
species level, our results agree with the positive growth trends linked to growth rate of trees, the probability of mortality and the probability of
climate warming found for fir (Hilmers et al., 2019), but not for beech ingrowth, but influences the effect of intra-and inter-specific competi
and spruce which showed neutral and negative trends. As for the stand tion, changing species-specific competitiveness in mixed stands. Tem
productivity, the results are not directly comparable, as Hilmers et al. perature shapes the species size distributions, such that warming
(2019) analysed temporal trends after removing the elevation and enhances fir size dominance and proportion and hinders spruce pro
temperature site effects. Moreover, in this study we used species and portion, whereas beech is less affected. All these patterns are in agree
stand basal area change as an indicator of species and stand pro ment with our first hypothesis H1.
ductivities, which presents some drawbacks as species height growth is In addition, tree species size dominance influences species and stand
not considered. productivity, with greater stand productivity when spruce is the size
11S. Condés et al. Forest Ecology and Management 504 (2022) 119819
dominant species (in accordance with our hypothesis H3). This effect of Appendix A. Supplementary material
species size dominance is, however, modulated by temperature. That is,
warming temperatures increased the productivity of fir more than the Supplementary data to this article can be found online at https://doi.
identity of the size dominant species. On the other hand, the effect of org/10.1016/j.foreco.2021.119819.
warming on beech, which is the opposite to the effect of fir, was less
important than the effect of the species dominance. Spruce was only References
slightly affected by warming and the positive or negative effect depends
on which species was dominant, and therefore only partially confirms Babst, F., Poulter, B., Trouet, V., Tan, K., Neuwirth, B., Wilson, R., Carrer, M.,
Grabner, M., Tegel, W., Levanic, T., Panayotov, M., Urbinati, C., Bouriaud, O.,
our hypothesis H2. Ciais, P., Frank, D., 2013. Site-and species-specific responses of forest growth to
The species-specific growth trends show that silvicultural pre climate across the European continent. Global Ecology and Biogeography 22 (6),
scriptions and interventions are essential for keeping mountain forests of 706–717.
Barton, K., 2020. MuMIn: multi-model inference. R package version 1. 43, 17.
spruce-fir-beech in a steady state even under external disturbances such Bates, D., Mächler, M., Bolker, B., Walker, S., 2015. Fitting linear mixed-effects models
as climate change. Scenario analyses may reveal the appropriate regu using lme4. Journal of Statistical Software 67, 1–48.
lation of stand density and species proportion for keeping the triad of Biber, P., Borges, J., Moshammer, R., Barreiro, S., Botequim, B., Brodrechtová, Y.,
Brukas, V., Chirici, G., Cordero-Debets, R., Corrigan, E., Eriksson, L., Favero, M.,
spruce-fir-beech and maintaining their essential provisioning and Galev, E., Garcia-Gonzalo, J., Hengeveld, G., Kavaliauskas, M., Marchetti, M.,
regulating services. Marques, S., Mozgeris, G., Navrátil, R., Nieuwenhuis, M., Orazio, C., Paligorov, I.,
Pettenella, D., Sedmák, R., Smreček, R., Stanislovaitis, A., Tomé, M., Trubins, R.,
Tuček, J., Vizzarri, M., Wallin, I., Pretzsch, H., Sallnäs, O., 2015. How sensitive are
CRediT authorship contribution statement ecosystem services in European forest landscapes to silvicultural treatment? Forests
6 (12), 1666–1695.
Sonia Condés: Conceptualization, Methodology, Validation, Bottero, A., Forrester, D.I., Cailleret, M., Kohnle, U., Gessler, A., Michel, D., Bose, A.K.,
Bauhus, J., Bugmann, H., Cuntz, M., Gillerot, L., Hanewinkel, M., Lévesque, M.,
Writing - original draft, Writing - review & editing. Miren del Río: Ryder, J., Sainte-Marie, J., Schwarz, J., Yousefpour, R., Zamora-Pereira, J.C.,
Conceptualization, Methodology, Validation, Writing - original draft, Rigling, A., 2021. Growth resistance and resilience of mixed silver fir and Norway
Writing - review & editing. David I. Forrester: Writing - review & spruce forests in central Europe: contrasting responses to mild and severe droughts.
Global Change Biology 27 (18), 4403–4419.
editing. Admir Avdagić: Writing - review & editing. Kamil Bielak: Bowditch, E., Santopuoli, G., Binder, F., del Río, M., La Porta, N., Kluvankova, T.,
Writing - review & editing. Andrej Bončina: Writing - review & editing. Lesinski, J., Motta, R., Pach, M., Panzacchi, P., Pretzsch, H., Temperli, C., Tonon, G.,
Michal Bosela: Writing - review & editing. Torben Hilmers: Data Smith, M., Velikova, V., Weatherall, A., Tognetti, R., 2020. What is Climate-Smart
Forestry? A definition from a multinational collaborative process focused on
curation, Writing - review & editing. Aida Ibrahimspahić: Writing -
mountain regions of Europe. Ecosystem Services 43, 101113. https://doi.org/
review & editing. Stanisław Drozdowski: Writing - review & editing. 10.1016/j.ecoser.2020.101113.
Andrzej Jaworski: Writing - review & editing. Thomas A. Nagel: Bošeľa, M., Petráš, R., Sitková, Z., Priwitzer, T., Pajtík, J., Hlavatá, H., Sedmák, R.,
Writing - review & editing. Zuzana Sitková: Writing - review & editing. Tobin, B., 2014. Possible causes of the recent rapid increase in the radial increment
of silver fir in the Western Carpathians. Environmental Pollution 184, 211–221.
Jerzy Skrzyszewski: Writing - review & editing. Roberto Tognetti: Bosela, M., Tobin, B., Šebeň, V., Petráš, R., Larocque, G.R., 2015. Different mixtures of
Funding acquisition, Writing - review & editing. Giustino Tonon: Norway spruce, silver fir, and European beech modify competitive interactions in
Writing - review & editing. Tzvetan Zlatanov: Writing - review & central European mature mixed forests. Canadian Journal of Forest Research 45
(11), 1577–1586.
editing. Hans Pretzsch: Conceptualization, Supervision, Writing - re Bosela, M., Tumajer, J., Cienciala, E., Dobor, L., Kulla, L., Marčiš, P., Popa, I., Sedmák, R.,
view & editing. Sedmáková, D., Sitko, R., Šebeň, V., Štěpánek, P., Büntgen, U., 2021. Climate
warming induced synchronous growth decline in Norway spruce populations across
biogeographical gradients since 2000. Science of the Total Environment 752,
141794. https://doi.org/10.1016/j.scitotenv.2020.141794.
Declaration of Competing Interest
Buongiorno, J., Michie, B.R., 1980. A matrix model of uneven-aged forest management.
Forest Science 26, 609–625.
The authors declare that they have no known competing financial Calama, R., de-Dios-García, J., del Río, M., Madrigal, G., Gordo, J., Pardos, M., 2021.
interests or personal relationships that could have appeared to influence Mixture mitigates the effect of climate change on the provision of relevant ecosystem
services in managed Pinus pinea L. forests. Forest Ecology and Management 481,
the work reported in this paper. 118782. https://doi.org/10.1016/j.foreco.2020.118782.
Cheng, Y., Zhang, C., Zhao, X., von Gadow, K., 2018. Biomass-dominant species shape
the productivity-diversity relationship in two temperate forests. Annals of Forest
Acknowledgements Science 75, 1–9.
Condés, S., del Río, M., 2015. Climate modifies tree interactions in terms of basal area
growth and mortality in monospecific and mixed Fagus sylvatica and Pinus sylvestris
To our late colleague and friend, Prof. Dr. Giustino Tonnon († forests. European Journal of Forest Research 134 (6), 1095–1108.
07.07.2021), who was one of the driving forces of the CLIMO project, Cordonnier, T., Kunstler, G., 2015. The Gini index brings asymmetric competition to
giving rise to this manuscript, but to whom it was not granted to see its light. Perspectives in Plant Ecology, Evolution and Systematics 17 (2), 107–115.
del Río, M., Pretzsch, H., Alberdi, I., Bielak, K., Bravo, F., Brunner, A., Condés, S.,
publication. Ducey, M.J., Fonseca, T., von Lüpke, N., Pach, M., Peric, S., Perot, T., Souidi, Z.,
We thank all colleagues and institutions who kindly provided data of Spathelf, P., Sterba, H., Tijardovic, M., Tomé, M., Vallet, P., Bravo-Oviedo, A., 2016.
their long-term experiments in mixed mountain forests for this study. Characterization of the structure, dynamics, and productivity of mixed-species
stands: review and perspectives. European Journal of Forest Research 135 (1),
23–49.
del Río, M., Vergarechea, M., Hilmers, T., Alday, J.G., Avdagić, A., Binderh, F.,
Funding Bosela, M., Dobor, L., Forrester, D.I., Halilović, V., Ibrahimspahić, A., Klopcic, M.,
Lévesque, M., Nagel, T.A., Sitkova, Z., Schütze, G., Stajić, B., Stojanović, D., Uhl, E.,
Zlatanov, T., Tognetti, R., Pretzsch, H., 2021. Effects of elevation-dependent climate
The authors would like to acknowledge networking support by the
warming on intra-and inter-specific growth synchrony in mixed mountain forests.
COST (European Cooperation in Science and Technology) Action CLIMO Forest Ecology and Management 479, 118587. https://doi.org/10.1016/j.
(Climate-Smart Forestry in Mountain Regions – CA15226) financially foreco.2020.118587.
supported by the EU Framework Programme for Research and Innova Dieler, J., Uhl, E., Biber, P., Müller, J., Rötzer, T., Pretzsch, H., 2017. Effect of forest
stand management on species composition, structural diversity, and productivity in
tion HORIZON 2020. the temperate zone of Europe. European Journal of Forest Research 136 (4),
Michal Bošeľa was supported by the Slovak Research and Develop 739–766.
ment Agency via the projects No. APVV-15-0265 and APVV-19-0183. Drozdowski, S., 2006. Application of a matrix model for projecting the development of
stands with complex structure. Sylwan 3–13.
Thomas A. Nagel received funding from the Slovenian Research Du, X., Chen, X., Zeng, W., Meng, J., 2021. A climate-sensitive transition matrix growth
Agency (Project J4-1765). model for uneven-aged mixed-species oak forests in North China. Forestry: An
Tzvetan Zlatanov received support from the Bulgarian National International Journal of Forest Research 94, 258-277.
Science Fund (BNSF) via the Project No. KP-06-N31/12.
12You can also read