Investor Presentation May 2022 - Mapletree Industrial Trust

Page created by David Beck
 
CONTINUE READING
Investor Presentation May 2022 - Mapletree Industrial Trust
Investor Presentation
May 2022
Investor Presentation May 2022 - Mapletree Industrial Trust
Important Notice
This presentation shall be read in conjunction with Mapletree Industrial Trust’s (“MIT”) financial results for Fourth Quarter
Financial Year 2021/2022 in the SGXNET announcement dated 26 April 2022.

This presentation is for information only and does not constitute an offer or solicitation of an offer to sell or invitation to
subscribe for or acquire any units in Mapletree Industrial Trust (“Units”).

The past performance of the Units and MIT is not indicative of the future performance of MIT or Mapletree Industrial Trust
Management Ltd. (the “Manager”).

The value of Units and the income from them may rise or fall. Units are not obligations of, deposits in or guaranteed by the
Manager or any of its affiliates. An investment in Units is subject to investment risks, including the possible loss of the
principal amount invested. Investors have no right to request the Manager to redeem their Units while the Units are listed. It is
intended that unitholders may only deal in their Units through trading on the Singapore Exchange Securities Trading Limited
(“SGX-ST”). Listing of the Units on the SGX-ST does not guarantee a liquid market for the Units.

This presentation may also contain forward-looking statements that involve risks and uncertainties. Actual future
performance, outcomes and results may differ materially from those expressed in forward-looking statements as a result of
risks, uncertainties and assumptions. Representative examples of these factors include general industry and economic
conditions, interest rate trends, cost of capital, occupancy rate, construction and development risks, changes in operating
expenses (including employees wages, benefits and training costs), governmental and public policy changes and the
continued availability of financing. You are cautioned not to place undue reliance on these forward-looking statements, which
are based on current view of management on future events.

Nothing in this presentation should be construed as financial, investment, business, legal or tax advice and you should
consult your own independent professional advisors.

2
Investor Presentation May 2022 - Mapletree Industrial Trust
Contents

    01   Key Highlights
    02   Overview of Mapletree Industrial Trust
    03   Portfolio Update
    04   4Q & FY21/22 Financial Highlights
    05   Sustainability
    06   Outlook and Strategy

3
Investor Presentation May 2022 - Mapletree Industrial Trust
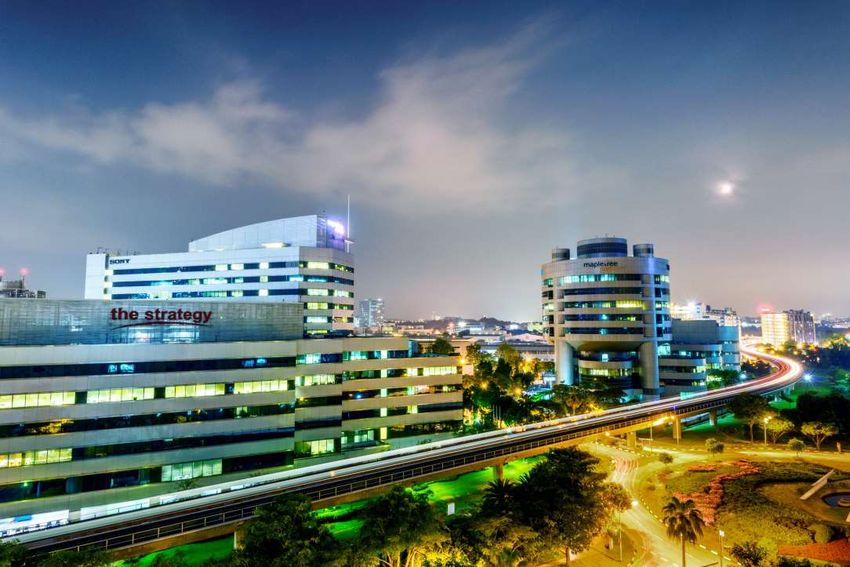
KEY HIGHLIGHTS

Data Centres, 44490 Chilum Place (ACC2), Northern Virginia
Investor Presentation May 2022 - Mapletree Industrial Trust
Sustainable and Growing Returns
   Distributable Income                                                                                                                                                                      DPU
        (S$ million)                                                                                                                                                                        (cents)
                                                                                                                                                                                           3.49
                                                                                                                                                                               3.47 3.49
   100                                                                                                                                                    3.283.30
                                                                                                                                                                        3.35                      3.50
                                                                                                                                 3.16
                                                                                                                      3.103.13                     3.10                               90.3
     90                                                                                                                                                                    88.4 89.5
                                                                                                                                        2.852.87
                                                                                                                                                          81.1
                                                                                                                                                                        82.7                      3.00
     80
                                                                                                                                                   72.9
                                                                                                                                            70.6                 70.7
                                                                                                                                 69.469.2
     70                                                                                                                                                                                           2.50
                                                                                                                      63.263.5

     60
                                                                                                                                                                                                  2.00
     50
                                                                                                                                                                                                  1.50
     40

     30                                                                                                                                                                                           1.00

     20
                                                                                                                                                                                                  0.50
     10

        0                                                                                                                                                                                         0.00
                3Q¹ 4Q 1Q 2Q 3Q 4Q 1Q 2Q 3Q 4Q 1Q 2Q 3Q 4Q 1Q 2Q 3Q 4Q 1Q 2Q 3Q 4Q 1Q 2Q 3Q 4Q 1Q 2Q 3Q 4Q 1Q 2Q 3Q 4Q 1Q 2Q 3Q 4Q 1Q 2Q 3Q 4Q 1Q 2Q 3Q 4Q
                FY10/11   FY11/12   FY12/13     FY13/14     FY14/15     FY15/16     FY16/17     FY17/18     FY18/19      FY19/20               FY20/21                     FY21/22

DPU
                3.45       8.41      9.24        9.92       10.43
                                                          Distributable 11.15
                                                                         Income (S$11.39
                                                                                     million) 11.75         12.16
                                                                                                          DPU (cents) 12.24                        12.55                        13.80
(cents)

            1    MIT was listed on 21 Oct 2010.
    5
Investor Presentation May 2022 - Mapletree Industrial Trust
Evolving MIT Portfolio Profile

            Reshaping and Building a Portfolio of Assets for Higher Value Uses
                    Through Development Projects and Acquisitions

                        70 Properties                                                                                    143 Properties

                                                                                                      AUM by geography
                                                                                                      North America                                                                 50.7%
                                                                                                      Singapore                                                                     49.3%
    1   Based on MIT’s book value of investment properties as well as MIT’s interest of the joint venture with Mapletree Investments Pte Ltd (“MIPL”) in three fully fitted hyperscale
6       data centres and 10 powered shell data centres in North America and included MIT’s right-of-use assets of S$42.5 million as at 31 Mar 2022.
Investor Presentation May 2022 - Mapletree Industrial Trust
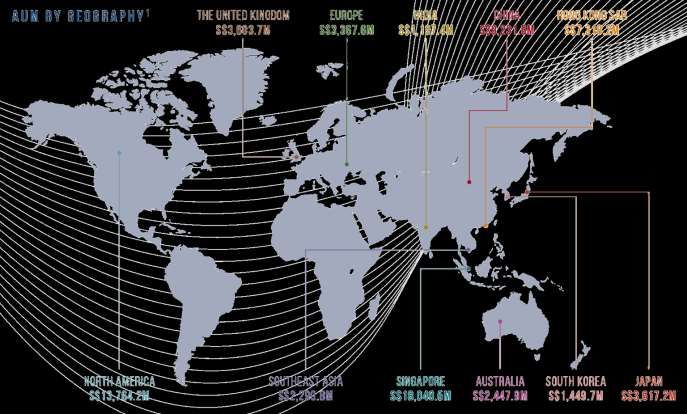
Portfolio Growth since IPO
                                                                                                                                                                      FY21/22
     3 Asset Enhancement                                                                                                                                               S$8.8b

       Initiatives (“AEI”)
     5 Build-to-Suit (“BTS”)                                                                                                                              FY20/21
       Projects                                                                                                                                            S$6.8b

     9 Acquisitions                                                                                                                             FY19/20
                                                                                                                                                S$5.9b
                                                                                                                                                                      Acquisition
                                                                                                                                FY18/19                               29 US DCs
                                                                                                                     FY17/18    S$4.8b                                 US$1.32b

                                                                                                         FY16/17     S$4.3b
                                                                                               FY15/16                                                       Acquisition
                                                                           FY14/15                        S$3.7b
                                                       FY13/14                                  S$3.6b                                                         Remaining
                                                                           S$3.4b                                                                             60% interest
                                   FY12/13             S$3.2b
                FY11/12                                                                                                                                      in 14 US DCs
                                    S$2.9b                                                                                                                    US$494m
FY10/11          S$2.7b
S$2.2b1                                                                                                                          Acquisition                 Acquisition
                                                    AEI                            Acquisition                BTS
                                                                                                                                   Upgraded                      DC in
                                               Woodlands                           2A Changi                 1 & 1A
                                                                                                                                  7 Tai Seng                    Virginia
                                                Central                           North Street 2           Depot Close
                                                                                                                                  Drive to DC
                                                 S$30m                                  S$12m                S$226m                                          US$220.9m
                                                                                                                                   S$95m

                                                                                         BTS                                         BTS
          Acquisition                         BTS                                                           Acquisition                                      BTS
                                                                                  26A Ayer                                         Mapletree
 FY10/11 11 Flatted
              FY11/12                FY12/13K&S Corp
                                                 FY13/14                    FY14/15       FY15/16           40% interest
                                                                                                         FY16/17      FY17/18   FY18/19                      Kolam
                                                                                    Rajah                                           Sunview FY19/20       FY20/21        FY21/22
           Factories                          Headquarters                                                 in14 US DCs²                                      Ayer 2
                                                                                  Crescent                                          Drive 1
            S$400m                                S$50m                                                     US$300m                                         S$300m
                                                                                        S$101m                                      S$76m

                                                    AEI                                                        AEI               Acquisition               Acquisition
                                               Toa Payoh                                                    30A Kallang           18 Tai Seng               13 North
                                                North 1                                                       Place                S$268m                 American DCs3
                                                 S$40m                                                        S$77m                                         US$684m
      1   Valuation of investment properties on 31 Mar at end of each financial year.
      2   Acquired through a 40:60 joint venture with MIPL.
 7    3   Acquired through a 50:50 joint venture with MIPL.
Investor Presentation May 2022 - Mapletree Industrial Trust
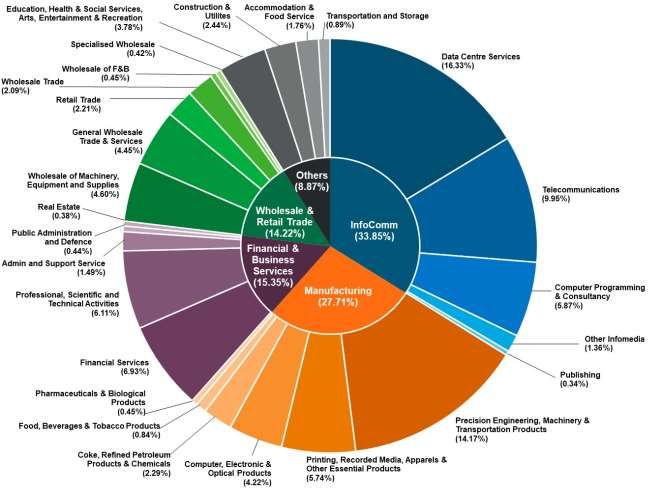
4QFY21/22 Highlights
 Growth driven by contributions from acquisitions of data centres in
  North America
  • FY21/22 Distributable Income: S$350.9 million ( 18.8% y-o-y)
  • FY21/22 DPU: 13.80 cents ( 10.0% y-o-y)
  • 4QFY21/22 Distributable Income and DPU were S$90.3 million
     ( 27.7% y-o-y) and 3.49 cents ( 5.8% y-o-y)

 Portfolio and investment updates
  • Portfolio value increased 28.9% y-o-y to S$8,718.6 million. Recorded
     portfolio revaluation gain of S$87.0 million
  • Average Overall Portfolio occupancy increased q-o-q from 93.6% to 94.0%
  • Completed divestment of 19 Changi South Street 1 for S$13.0 million on
     21 Apr 2022

 Capital management update
  • Healthy distribution reinvestment plan (“DRP”) take-up rate of 42.5% for
    3QFY21/22 Distribution
  • Strong balance sheet with more than S$900 million of committed facilities
    available
8
Investor Presentation May 2022 - Mapletree Industrial Trust
Redevelopment – Kolam Ayer 21
    161, 163 & 165 Kallang Way1                                                                                                  GFA                     Plot Ratio

    Kolam Ayer 2 Cluster                   Two Flatted Factories and an amenity centre                                    506,720 sq ft                      1.5

                                                New Hi-Tech Buildings, including a
    After Redevelopment                                                                                                   865,600 sq ft                      2.5
                                            seven-storey BTS Facility for Anchor Tenant

               Artist’s impression of MIT’s new high-tech industrial precinct          Completed Block 1 super structure and core walls; level 7 floor
               with BTS Facility on the left                                           casting in Block 2; and level 2 casting in Block 3

      Redevelopment of Flatted Factories into a new high-tech industrial precinct at total project cost of S$300 million2
      Secured pre-commitment from a global medical device company headquartered in Germany (the “Anchor Tenant”)
       for about 24.4% of enlarged GFA (~211,000 sq ft)
      BTS Facility is 100% committed by Anchor Tenant for lease term of 15 + 5 + 5 years3 with annual rental escalations
      Expected completions of 163 & 165 Kallang Way in 2H2022 and 161 Kallang Way in 1H2023

    1   Upon commencement of the redevelopment works in Jul 2020, the cluster was renamed after its new address (161, 163 & 165 Kallang Way).
    2   Includes the book value of the Kolam Ayer 2 Cluster at S$70.2 million as at 31 Mar 2019 prior to the commencement of the redevelopment.
9   3   Includes a rent-free period of 6 months distributed over the first six years. Anchor Tenant is responsible for all operating expense and property tax of the BTS Facility.
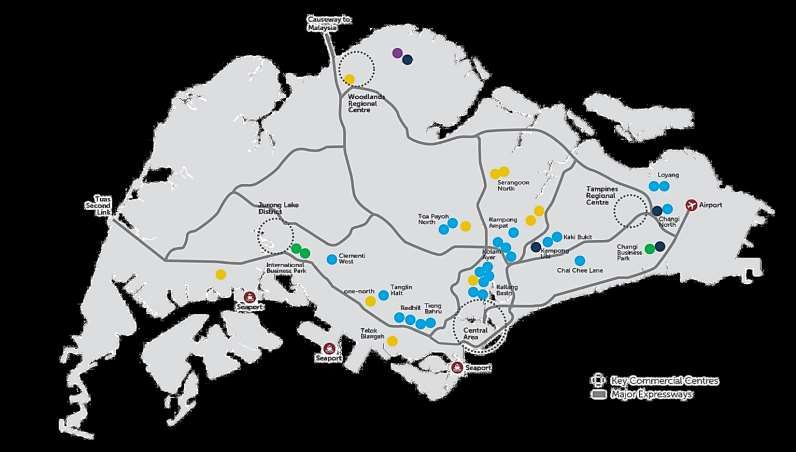
Investor Presentation May 2022 - Mapletree Industrial Trust
OVERVIEW OF
                          MAPLETREE INDUSTRIAL TRUST

Hi-Tech Building, 18 Tai Seng
Overview of Mapletree Industrial Trust
                           Mapletree Investments Pte Ltd                                               Public & Inst
                                                                                                                                       MIPL
Sponsor                    (“MIPL”)                                                                    Unitholders

                                                                                                     74.2%                                25.8%
                           Owns 25.8% of MIT                                                                                                      Trustee

                           Focused on (i) industrial real estate
                           assets in Singapore, excluding                                                                                         Manager
Investment
                           properties primarily used for logistics
mandate
                           purposes and (ii) data centres
                                                                                                                       MIT Portfolio              Property
                           worldwide beyond Singapore                                                                                             Manager

                           143 properties valued at S$8.8 billion1
Portfolio
                           24.2 million2 sq ft NLA

                           Mapletree Industrial Trust
Manager                    Management Ltd.
                           100% owned by the Sponsor
                           Mapletree Facilities Services
Property                   Pte. Ltd. and Mapletree US
Manager                    Management LLC
                           100% owned by the Sponsor

Trustee                    DBS Trustee Limited
     1   Based on MIT’s book value of investment properties as well as MIT’s interest of the joint   AUM by geography
         venture with MIPL in three fully fitted hyperscale data centres and 10 powered shell data
         centres in North America and included MIT’s right-of-use assets of S$42.5 million as at     North America                                    50.7%
         31 Mar 2022.
     2   Excludes the parking decks (150 Carnegie Way and 171 Carnegie Way) at 180 Peachtree.        Singapore                                        49.3%
11
Diverse Portfolio of 143 Properties

       DATA CENTRES                                         FLATTED FACTORIES
       Facilities used primarily for the storage and        High-rise multi-tenanted industrial buildings
       processing of data. These include core-and-shell     with basic common facilities used for light
       to fully-fitted facilities, which include building   manufacturing activities.
       fit-outs as well as mechanical and electrical
       systems.

       HI-TECH BUILDINGS                                    STACK-UP/RAMP-UP
                                                            BUILDINGS
       High-specification industrial buildings with
       higher office content for tenants in technology      Stacked-up factory space with vehicular
       and knowledge-intensive sectors. Usually             access to upper floors. Multi-tenanted space
       fitted with air-conditioned lift lobbies and         suitable for manufacturing and assembly
       common areas.                                        activities.

       BUSINESS PARK BUILDINGS                              LIGHT INDUSTRIAL
                                                            BUILDINGS
       High-rise multi-tenanted buildings in specially
       designated “Business Park zones”. Serve as           Multi-storey developments usually
       regional headquarters for MNCs as well as            occupied by an anchor tenant for light
       spaces for R&D and knowledge-intensive               manufacturing activities.
       enterprises.

12
Healthy Returns since IPO

 COMPARATIVE TRADING PERFORMANCE SINCE IPO¹
                    400                                                                                                       MIT UNIT PRICE
                                                                                                                                 +168.8%

                    350

                    300

                    250

                    200
                                                                                                                       FTSE ST REITS INDEX
                                                                                                                             +21.5%
                    150

                    100

                     50                                                                                          FTSE STRAITS TIMES INDEX
                                                                                                                          +3.0%
                      0
                      Oct 10      Oct 11    Oct 12      Oct 13    Oct 14   Oct 15   Oct 16     Oct 17   Oct 18    Oct 19    Oct 20   Oct 21

                               Rebased MIT Unit Price            Rebased FTSE ST REITS Index            Rebased FTSE Straits Times Index

     MIT’s Return on                                                             Capital                  Distribution                          Total
     Investment                                                             Appreciation                         Yield                         Return
     Listing on 21 Oct 2010 to 9 May 2022                                           168.8%²                      136.0%³                      304.8%4

     ¹   Rebased MIT’s issue price of S$0.930 and opening unit prices of FTSE ST REITs Index and FTSE Straits Times Index on
         21 Oct 2010 to 100. Source: Bloomberg.
     ²   Based on MIT’s closing unit price of S$2.500 on 9 May 2022.
     ³   MIT’s distribution yield is based on DPU of S$1.265 over the issue price of S$0.930.
13   ⁴   Sum of distributions and capital appreciation for the period over the issue price of S$0.930.
Reputable Sponsor with Aligned Interest
About the Sponsor, Mapletree Investments
      Leading real estate development, investment, capital and property management company
      As at 31 Mar 2021, the Sponsor owns and manages S$66.3 billion of assets across Asia Pacific,
       Europe, the United Kingdom and North America, of which S$13.8 billion is located in North America
      Right of first refusal to MIT over future sale of 50% interest in Mapletree Rosewood Data Centre Trust
       (“MRODCT”)

14
PORTFOLIO
Data Centres,                   UPDATE
13831 Katy Freeway, Houston
Portfolio Overview
                                                                      Singapore                     North American                                      Overall
                                                                       Portfolio                           Portfolio                                   Portfolio

         Number of properties                                                      86                                     57                                   143

         NLA (million sq ft)                                                    15.9                                    8.31                                 24.21

         Occupancy (%)
          4QFY21/22                                                             94.4                                   93.3                                  94.02
          3QFY21/22                                                             93.7                                   93.3                                  93.62

SEGMENTAL OCCUPANCY RATES1

               2         2    98.6% 98.6%                                                             97.6% 97.0%
     93.9% 93.9%                                                              92.0% 93.6%                                                            93.6%2 94.0%2
                                                      83.0% 83.3%                                                            78.9% 78.5%

         Data Centres        Hi-Tech Buildings        Business Park         Flatted Factories Stack-up/Ramp-up               Light Industrial           Overall
                                                        Buildings                                 Buildings                     Buildings               Portfolio

                                                Left Bar (3QFY21/22)                                Right Bar (4QFY21/22)

     1    Excludes the parking decks (150 Carnegie Way and 171 Carnegie Way) at 180 Peachtree.
     2    Based on MIT’s 50% interest of the joint venture with MIPL in three fully fitted hyperscale data centres and 10 powered shell data centres in North America
          through Mapletree Rosewood Data Centre Trust (“MRODCT”).
16
Lease Expiry Profile

 EXPIRING LEASES BY GROSS RENTAL INCOME1
 As at 31 March 2022

     WALE based on date of commencement of leases (years)2

     North American Portfolio                                                6.1

     Singapore Portfolio                                                     2.7

     Overall Portfolio1                                                      4.1
                                                                                                                                       34.9%

                                    21.5%

           14.2%                                             13.2%
                                                                                      10.9%
                                                                                                                5.3%

          FY22/23                  FY23/24                  FY24/25                  FY25/26                 FY26/27           FY27/28 & Beyond

      Data Centres (North America)          Data Centres (Singapore)               Hi-Tech Buildings                    Business Park Buildings
      Flatted Factories                     Stack-up / Ramp-up Buildings           Light Industrial Buildings

     1   Based on MIT’s 50% interest of the joint venture with MIPL in three fully fitted hyperscale data centres and 10 powered shell data centres in
         North America through MRODCT.
     2   Refers to leases which commenced prior to and on 31 Mar 2022.
17
Large and Diversified Tenant Base

 TOP 10 TENANTS BY GROSS RENTAL INCOME1
 As at 31 March 2022

          6.1%                                   Over 2,000 tenants
                                                 Largest tenant contributes 6.1% of Portfolio’s Gross Rental Income
                          5.4%                   Top 10 tenants forms about 29.5% of Portfolio’s Gross Rental Income

                                                                                                          Hi-Tech Buildings       Data Centres

                                         3.1%           3.0%
                                                                       2.6%            2.5%

                                                                                                      1.8%           1.8%            1.8%
                                                                                                                                                    1.4%

                                       Global Global Social                                                         NYSE-listed                  IT Solutions
                                     Colocation   Media                                                               Telco2                       Provider2
                                      Provider2 Company2

     1   Based on MIT’s 50% interest of the joint venture with MIPL in three fully fitted hyperscale data centres and 10 powered shell data centres in
         North America through MRODCT.
     2   The identities of the tenants cannot be disclosed due to the strict confidentiality obligations under the lease agreements.
18
Tenant Diversification Across Trade Sectors1
                  No single trade sector accounted >17% of Portfolio’s Gross Rental Income

     By Gross Rental Income
     As at 31 Mar 2022
     1   Based on MIT’s 50% interest of the joint venture with MIPL in three fully fitted hyperscale data centres and 10 powered shell data centres in
19       North America through MRODCT.
57 Data Centres Across North America

Total                                        WALE                                  Weighted Average Unexpired                                              Occupancy
NLA1                                         (By GRI)2                             Lease Term of Underlying Land3                                          Rate4

8.3m sq ft                                   6.1 years                             Freehold                                                                93.3%
                                                                                 Minnesota                             Ontario
                                                                                      2
                                                                                                                            1
                                                                                          Wisconsin
                                                                                               1

                                                                                                                   2
                                                                                                         Michigan                                    Massachusetts
                                                                                                                                                       2
                                                                                                   2
                                                                                                                            Pennsylvania
                                                                                                                                                   1 Connecticut
                                                                                                                       2           2
                                                                                              Illinois     1                                   2 New Jersey
                                                                                                              Ohio
                                                                2                                      Indiana
                                                             Denver                                                                    9    Virginia
                                   6

                            California                                           1                             2                   3       North Carolina
                                                                            Oklahoma                   Tennessee
                                                        3                                                                   1
                                                 Arizona                                                                6
                                                                                                                                South Carolina
                                                                            6
                                                                                                                   Georgia
                                                                         Texas
     MIT’s 57 Data Centres in North America
     *Number of data centres indicated in the circles

     1    Excluded the parking decks (150 Carnegie Way and 171 Carnegie Way) at 180 Peachtree, Atlanta.
     2    As at 31 Mar 2022.
     3    All properties are sited on freehold land, except for the parking deck (150 Carnegie Way) at 180 Peachtree, Atlanta, 2055 East Technology Circle, Phoenix,
          2005 East Technology Circle, Tempe and part of 250 Williams Street NW, Atlanta.
     4    For 4QFY21/22.
20
Diversified Mix of Data Centres (North America)

 90.2% of the North American Portfolio are on triple net lease structures whereby all
  outgoings1 are borne by the tenants
 Good mix of powered shell, fitted hyperscale and fitted data centres

           SPLIT BETWEEN LEASE TYPES FOR THE NORTH AMERICAN PORTFOLIO
                            (BY GROSS RENTAL INCOME)2

                     Fitted                                                                                     Non-Triple
                 Hyperscale Data                                                                                Net Leases
                    Centres                                                                                        9.8%
                     13.7%

 Fitted Data
  Centres
    25.8%

                                                                                                                                                        Triple Net
                                                                Powered Shell                                                                            Leases
                                                                 Data Centres                                                                             90.2%
                                                                    60.5%

     1   Refers to maintenance, tax and insurance charges.
     2   As at 31 Mar 2022. Based on MIT’s 50% interest of the joint venture with MIPL in three fully fitted hyperscale data centres and 10 powered shell data centres
21       in North America through MRODCT.
86 Properties in Singapore

Total                         WALE        Weighted Average Unexpired          Occupancy
NLA                           (By GRI)1   Lease Term of Underlying Land1      Rate2

15.9m sq ft 2.7 years                     34.4 years                          94.4%

                                                                           Data Centres
                                                                           Hi-Tech Buildings
                                                                           Flatted Factories
                                                                           Business Park Buildings
                                                                           Stack-up/Ramp-up Buildings
                                                                           Light Industrial Buildings
     1   As at 31 Mar 2022.
     2   For 4QFY21/22.
22
Singapore Portfolio Performance
Occupancy                                                                                                                                                                       Gross Rental Rate
                                                                                                                                                                                   S$ psf/mth
100%                                                                                                                                                                                                      $2.50
                                                                                                                                                                                                  94.4%
                                                                                                                                                                              93.4% 93.6% 93.7%
                                                                                                                                                                      92.9%
                                                                                                                                                              92.2%
                                                                                                                                                      91.5%
                                                                                                                  90.5% 90.2% 90.5% 90.7% 90.2%

90%

                                                                                                                                                                                  $2.13   $2.13 $2.13
                                                                                                                              $2.12   $2.11                             $2.13
                                                                                                                      $2.10
                                                                                                              $2.10
80%
                                                                                                                                                              $2.11
                                                                                                                                              $2.08

                                                                                                                                                      $2.03
                                                                                                                                                                      $2.05                               $2.00
70%

60%

50%                                                                                                                                                                                                       $1.50

40%

30%
                                                                                                                                                                                                          $1.00
20%

10%

 0%                                                                                                                                                                                                       $0.50
        3Q 4Q 1Q 2Q 3Q 4Q 1Q 2Q 3Q 4Q 1Q 2Q 3Q 4Q 1Q 2Q 3Q 4Q 1Q 2Q 3Q 4Q 1Q 2Q 3Q 4Q 1Q 2Q 3Q 4Q 1Q 2Q 3Q 4Q 1Q 2Q 3Q 4Q 1Q 2Q 3Q 4Q 1Q 2Q 3Q 4Q
       FY10/11   FY11/12    FY12/13     FY13/14     FY14/15     FY15/16     FY16/17     FY17/18     FY18/19             FY19/20                   FY20/21                         FY21/22

   23                                                    Occupancy (LHS)          Rental Rate (RHS)
Rental Revisions (Singapore)

  GROSS RENTAL RATE (S$ PSF/MTH)1                                                                                                                Before Renewal
  For Period 4QFY21/22                                                                                                                           After Renewal
                                                   $3.88    $3.80                                                                                New Leases
                                                                    $3.66
                                                                                                                                                 Passing Rent

                                                           $3.49
                           $3.23
                   $2.44 $2.49

                                                                                           $1.75
                                   $1.90
                                                                                    $1.71 $1.72
                                                                                                   $1.60
                                                                                                                       $1.32 $1.36 $1.27

                                                                                                                                                     $1.40
                                                                                                                             $1.28

                    Hi-Tech Buildings           Business Park Buildings             Flatted Factories              Stack-Up/Ramp-Up        Light Industrial Buildings
                                                                                                                        Buildings

Renewal                  10 Leases                        6 Leases                        83 Leases                         9 Leases
                                                                                                                                                     N.A.2
Leases                 (23,779 sq ft)                   (23,100 sq ft)                  (352,553 sq ft)                  (105,950 sq ft)
New                      8 Leases                         13 Leases                       81 Leases                         4 Leases
                                                                                                                                                     N.A.3
Leases                 (10,181 sq ft)                   (63,404 sq ft)                  (248,733 sq ft)                   (80,310 sq ft)
      1   Gross Rental Rate figures exclude short term leases; except Passing Rent figures which include all leases.
      2   Not applicable as there were no leases due for renewal in the quarter.
      3   Excluded rental rate for the sole new lease at the Light Industrial Buildings for confidentiality.

 24
Healthy Tenant Retention (Singapore)

   LONG STAYING TENANTS                                            RETENTION RATE FOR 4QFY21/22

                                Up to 1 yr
                                 15.0%
   >10 yrs                                                                                                          97.3%
    31.7%
                                                                                84.2%                                                         83.9%
                                                                                                       80.9%
                                                >1 to 2 yrs                                70.5%
                                                   8.0%
                           4 yrs or
                             less
               More than    39.5%
                 4 yrs                              > 2 to 3 yrs
                60.5%                                  8.5%

                                                >3 to 4 yrs          N.A.                                                         N.A.
                                                   8.0%                Data    Hi-Tech     Business     Flatted    Stack-up /     Light      Singapore
>5 to 10 yrs                                                         Centres   Buildings     Park      Factories   Ramp-up      Industrial    Portfolio
   22.8%                              >4 to 5 yrs                  (Singapore)             Buildings               Buildings    Buildings
                                         6.0%
                                                                     Based on NLA.
                                       As at 31 Mar 2022             Not applicable for Data Centres (Singapore) and Light Industrial
                                       By number of tenants.         Buildings as there were no leases due for renewal.

    60.5% of the tenants have leased the properties for more than 4 years
    Tenant retention rate of 83.9% in 4QFY21/22
   25
Divestment – 19 Changi South Street 1
 Sale Price                                                                        GFA                                   Completed

 S$13.0 million                                                               82,737 sq ft                               21 Apr 2022

                                                                                 Completed divestment of a two-storey Light
                                                                                  Industrial Building with a four-storey extension block
                                                                                  located within the Changi South Industrial Estate
                                                                                 30-year land lease commencing from 16 Nov 1996
                                                                                  and an option to extend for another 30 years
                                                                                 Contributed about 0.07% to MIT’s portfolio gross
                                                                                  revenue in FY21/22
                                                                                 Sale Price is higher than valuation of S$11.9 million1
                                                                                  and purchase price of S$12.4 million2
                                                                                 Use of net proceeds to fund committed investments
                                                                                  and working capital requirements and/or reduce
                                                                                  existing debt
 19 Changi South Street 1

     1   Based on the independent valuation by CBRE Pte.Ltd. on 5 Nov 2021.
     2   19 Changi South Street 1 was acquired by MIT on 21 Oct 2010 as part of its initial public offering portfolio.

26
4Q & FY21/22
                                              FINANCIAL HIGHLIGHTS

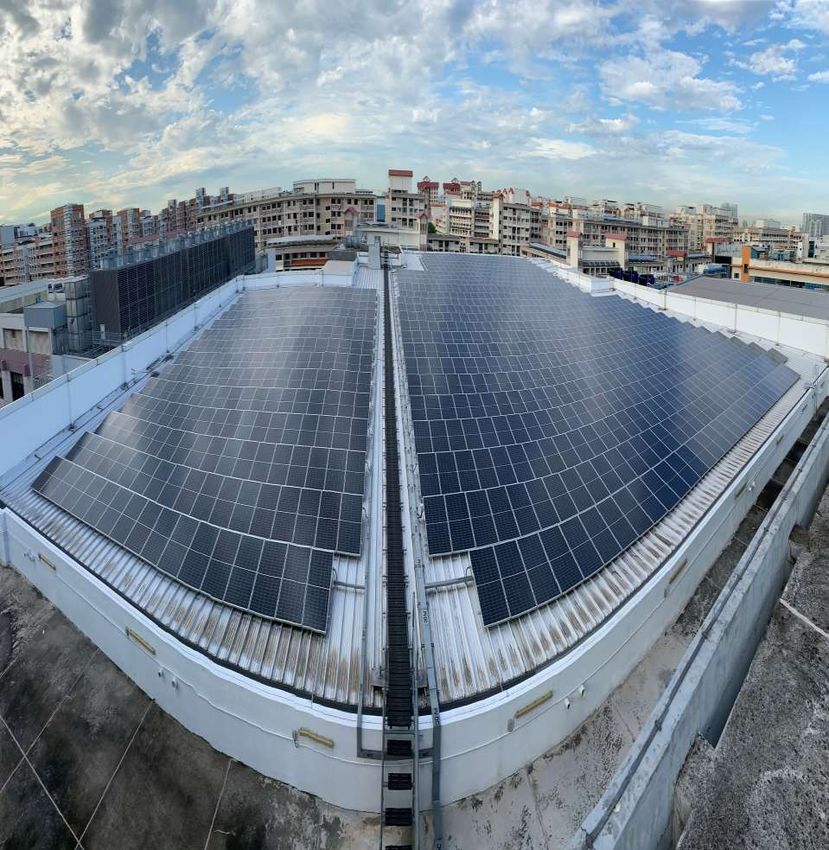
Business Park Buildings, The Strategy and The Synergy
Statement of Profit or Loss (Year-on-Year)
                                                                                                                       4QFY21/22                           4QFY20/21
                                                                                                                                                                                                         / ()
                                                                                                                         (S$’000)                            (S$’000)
  Gross revenue                                                                                                            164,092                               121,062                                35.5%
  Property operating expenses                                                                                              (39,885)                              (29,254)                               36.3%
  Net property income                                                                                                      124,207                                 91,808                               35.3%
  Borrowing costs                                                                                                           (18,979)                             (14,797)                               28.3%
  Trust expenses1                                                                                                           (20,913)                            (12,237)                               70.9%
  Net fair value gain/(loss) on investment properties and investment
                                                                                                                                7,170                            (87,083)                                       *
  property under development2
  Share of joint ventures’ results3                                                                                           88,994                                 9,204                          >100.0%
  Comprising:
  - Net profit after tax                                                                                                        9,150                                9,274                              (1.3%)
  - Net fair value gain/(loss) on investment properties                                                                       79,844                                   (70)                                     *
  Profit before income tax                                                                                                   180,479                             (13,105)                                       *
  Income tax expense                                                                                                        (22,587)                             (32,697)                             (30.9%)
  Profit for the period                                                                                                      157,892                             (45,802)                                       *
  Profit attributable to perpetual securities holders                                                                           2,330                                      -                                    *
  Profit attributable to Unitholders                                                                                        155,562                             (45,802)                                        *
  Net non-tax deductible items                                                                                              (72,556)                             110,426                                        *
  Distributions declared by joint ventures                                                                                      7,322                                6,124                              19.6%
  Amount available for distribution to Unitholders                                                                            90,328                              70,748                                27.7%
  Distribution per Unit (cents)                                                                                                 3.495                                3.304                               5.8%
  * Not meaningful
  1   Other trust expenses include provision for tenant compensation claims.
  2   This relates to the net change in the properties fair values arising form the independent valuation exercise carried out as at 31 Mar 2022.
  3   Share of joint ventures’ results relates to MIT’s equity interest in the joint venture with Mapletree Investments Pte Ltd (“MIPL”). The results of the joint venture were equity accounted at the Group
      level.
  4   Includes tax-exempt income amounting to S$7.1 million (equivalent to distribution per unit of 0.30 cent) which was previously withheld.
285   Includes the distribution of divestment gain from disposal of 26A Ayer Rajah Crescent.
Statement of Profit or Loss (Year-on-Year)
                                                                                                                                                     FY21/22                                  FY20/21
                                                                                                                                                                                                                                             / ()
                                                                                                                                                     (S$’000)                                 (S$’000)

     Gross revenue                                                                                                                                   610,063                                  447,203                                       36.4%

     Property operating expenses                                                                                                                   (138,082)                                  (96,212)                                      43.5%

     Net property income                                                                                                                             471,981                                  350,991                                       34.5%

     Borrowing costs                                                                                                                                  (70,857)                                 (52,888)                                     34.0%

     Trust expenses1                                                                                                                                 (57,868)                                  (42,285)                                    36.9%

     Gain on divestment2                                                                                                                                  2,637                                            -                                        *

     Effects from deemed disposal of investments in joint venture 3                                                                                              -                             (15,662)                                             *

     Net fair value gain/(loss) on investment properties and investment property
                                                                                                                                                          7,170                                (87,083)                                             *
     under development4

     Share of joint ventures’ results5                                                                                                                116,318                                     44,797                                >100.0%

     Comprising:

     - Net profit after tax                                                                                                                             36,474                                    44,867                                  (18.7%)

     - Net fair value gain/(loss) on investment properties                                                                                              79,844                                        (70)                                          *

     Profit before income tax                                                                                                                         469,381                                   197,870                                 >100.0%

     Income tax expense                                                                                                                               (30,165)                                 (33,373)                                     (9.6%)

     Profit for the period                                                                                                                            439,216                                   164,497                                 >100.0%

     Profit attributable to perpetual securities holders                                                                                                 8,414                                            -                                         *

     Profit attributable to Unitholders                                                                                                              430,802                                   164,497                                  >100.0%

     Net non-tax deductible items                                                                                                                   (107,018)                                     94,595                                            *

     Distributions declared by joint ventures                                                                                                           27,122                                    36,172                                  (25.0%)

     Amount available for distribution to Unitholders                                                                                                350,906                                   295,264                                      18.8%

     Distribution per Unit (cents)                                                                                                                      13.807                                    12.556                                    10.0%
     * Not meaningful
     1      Other trust expenses include provision for tenant compensation claims.
     2      Gain on divestment relates to the divestment of 26A Ayer Rajah Crescent, Singapore at the sale price of S$125.0 million and compensation received for the compulsory acquisition of part of the land at 2 and 4 Loyang Lane for public use on
            1 Dec 2021.
     3      Effects from deemed disposal of investments in joint venture refer to remeasurement of the Group’s 40% equity interest in Mapletree Redwood Data Centre Trust (“MRDCT”) to its fair value upon MIT’s acquisition of the remaining 60%
            stake in MRDCT. This is in accordance with the accounting standards where carrying amount of the investment is remeasured to its fair value and amounts previously recognised in other comprehensive income are reclassified to the
            Consolidated Statement of Profit or Loss.
     4      This relates to the net change in the properties fair values arising form the independent valuation exercise carried out as at 31 Mar 2022
     5      Share of joint ventures’ results relates to MIT’s equity interest in the joint venture with MIPL. The results of the joint venture were equity accounted at the Group level. .
29   6      Includes tax-exempt income amounting to S$7.1 million (equivalent to distribution per unit of 0.30 cent) which was previously withheld.
     7      Includes the distribution of divestment gain from disposal of 26A Ayer Rajah Crescent.
Statement of Profit or Loss (Qtr-on-Qtr)
                                                                                                                                   4QFY21/22                            3QFY21/22
                                                                                                                                                                                               / ()
                                                                                                                                     (S$’000)                             (S$’000)

     Gross revenue                                                                                                                     164,092                              162,352            1.1%

     Property operating expenses                                                                                                       (39,885)                            (39,617)            0.7%

     Net property income                                                                                                               124,207                              122,735             1.2%

     Borrowing costs                                                                                                                    (18,979)                             (19,240)         (1.4%)

     Trust expenses1                                                                                                                   (20,913)                             (13,290)          57.4%

     Gain on divestment2                                                                                                                          -                             2,130               *

     Net fair value gain/(loss) on investment properties and investment property
                                                                                                                                           7,170                                         -          *
     under development3

     Share of joint venture’s results4                                                                                                    88,994                                9,399        >100.0%

     Comprising:

     - Net profit after tax                                                                                                                9,150                                9,399           (2.6)

     - Net fair value gain/(loss) on investment properties                                                                                79,844                                         -          *

     Profit before income tax                                                                                                           180,479                              101,734           77.4%
     Income tax expense                                                                                                                 (22,587)                              (2,883)        >100.0%

     Profit for the period                                                                                                              157,892                                98,851          59.7%

     Profit attributable to perpetual securities holders                                                                                   2,330                                2,382         (2.2%)

     Profit attributable to Unitholders                                                                                                155,562                                96,469          61.3%

     Net non-tax deductible items                                                                                                       (72,556)                             (13,862)        >100.0%

     Distributions declared by joint ventures                                                                                              7,322                                6,898          6.1%

     Amount available for distribution to Unitholders                                                                                    90,328                               89,505            0.9%
     Distribution per Unit (cents)                                                                                                         3.495                                3.495              **
 * Not meaningful
 ** Percentage is less than 0.1%
 1      Other trust expenses include provision for tenant compensation claims.
 2      Gain on divestment relates to compensation received for the compulsory acquisition of part of the land at 2 and 4 Loyang Lane for public use on 1 Dec 2021.
 3      This relates to the net change in the properties fair values arising form the independent valuation exercise carried out as at 31 March 2022
 4      Share of joint venture’s results relates to MIT’s equity interest in the joint ventures with MIPL. The results of the joint venture were equity accounted at the Group level..
 5      Includes the distribution of divestment gain from disposal of 26A Ayer Rajah Crescent.
30
Statement of Financial Position

                                                                      31 Mar 2022                 31 Dec 2021                     / ()   31 Mar 2021    / ()

     Total assets (S$’000)                                                8,479,971                    8,336,785                   1.7%      6,391,619   32.7%

     Total liabilities (S$’000)                                            3,201,113                   3,254,186                (1.6%)       2,496,619   28.2%
     Net assets attributable to
                                                                          4,977,056                    4,783,127                   4.1%      3,895,000   27.8%
     Unitholders (S$’000)

     Net asset value per Unit (S$)1                                                 1.86                         1.80              3.3%           1.66   12.0%

     1   Net tangible asset per Unit was the same as net asset value per Unit as there were no intangible assets as at reporting dates.

31
Portfolio Valuation
                                                             Valuation as at 31 Mar 2022                  Valuation as at
     Property segment                                    Local currency                                      31 Mar 2021    Capitalisation rate
                                                                                           S$ million 1     (S$ million)2
                                                                (million)

     Data Centres (Singapore)                                     S$282.0                        282.0              406.8      6.00% to 6.50%

     Hi-Tech Buildings                                          S$1,415.0                      1,415.0            1,374.5      5.25% to 6.75%

     Business Park Buildings                                      S$567.8                        567.8              575.1               5.75%

     Flatted Factories                                          S$1,466.1                      1,466.1            1,474.3      6.00% to 7.25%

     Stack-up/Ramp-up Buildings                                   S$494.0                        494.0              490.5               6.50%

     Light Industrial Buildings                                    S$70.0                         70.0              70.9       6.00% to 6.50%

     Singapore Portfolio                                        S$4,294.9                      4,294.9            4,392.1

     Data Centres (North America) (100%)                      US$4,265.6                       5,820.1            3,633.7      5.00% to 6.75%
     MIT’s Interest in
                                                              US$3,242.2                       4,423.7            2,370.1
     North American Portfolio

     Total Portfolio                                                                           8,718.6            6,762.2

         Total valuation of 143 properties in MIT’s portfolio was S$8,718.6 million
         Increase in portfolio value was mainly due to the portfolio acquisition of 29 data centres in the
          United States. Recorded portfolio revaluation gain of S$87.0 million
         Net asset value per Unit increased from S$1.66 as at 31 Mar 2021 to S$1.86 as at 31 Mar 2022

      1   Based on applicable Mar 2022 month end exchange rate of US$1 to S$1.36444.
      2   Based on applicable Mar 2021 month end exchange rate of US$1 to S$1.34012.
32
Strong Balance Sheet

                                                                31 Mar 2022                                    31 Dec 2021

     Total debt                                             S$2,904.1 million                              S$2,975.5 million

     Weighted average tenor of debt                               3.8 years                                      3.5 years

     Aggregate leverage ratio1                                      38.4%                                          39.9%

     Strong balance sheet to pursue growth opportunities

      ‘BBB+’ rating with Stable Outlook by Fitch Ratings

      100% of loans unsecured with minimal covenants

      Healthy DRP take-up rate of 42.5% for 3QFY21/22 Distribution. DRP will be applied
       for 4QFY21/22 Distribution

 1    In accordance with Property Funds Guidelines, the aggregate leverage ratio includes proportionate share of aggregate leverage as well as
      deposited property values of joint venture. As at 31 Mar 22, aggregate leverage including MIT’s proportionate share of joint venture is
      S$3,467.2 million.
33
Well Diversified Debt Maturity Profile
DEBT MATURITY PROFILE
As at 31 March 2022

                                                        30.8%

                                                                  16.9%
                                           16.2%
        13.3%                                           893.7
                      8.9%       9.6%
                                            411.1                 491.2
        341.1          81.9
                                                                            4.3%
                                 280.1                                        -
                      175.0                                                 125.0
        45.0                                60.0
                                   -                      -         -
       FY22/23       FY23/24    FY24/25   FY25/26      FY26/27   FY27/28   FY28/29
                                    MTN   Bank Loans
        Amounts in S$ million

                       Weighted Average Tenor of Debt = 3.8 years
34
Risk Management
                                                               31 Mar 2022        31 Dec 2021

     Fixed as a % of total debt                                     70.5%           79.7%

     Weighted average hedge tenor                                 3.6 years        3.3 years

     Weighted average all-in funding
                                                                     2.4%            2.3%
     cost for the quarter
     Interest coverage ratio (“ICR”)
                                                                  5.7 times        6.4 times
     for the quarter

     ICR for the trailing 12 months1                              6.4 times        6.5 times

     Adjusted ICR for the trailing 12
                                                                  5.7 times        5.9 times
     months1

 1    Calculated in accordance with Property Funds Guidelines dated 16 Apr 2020
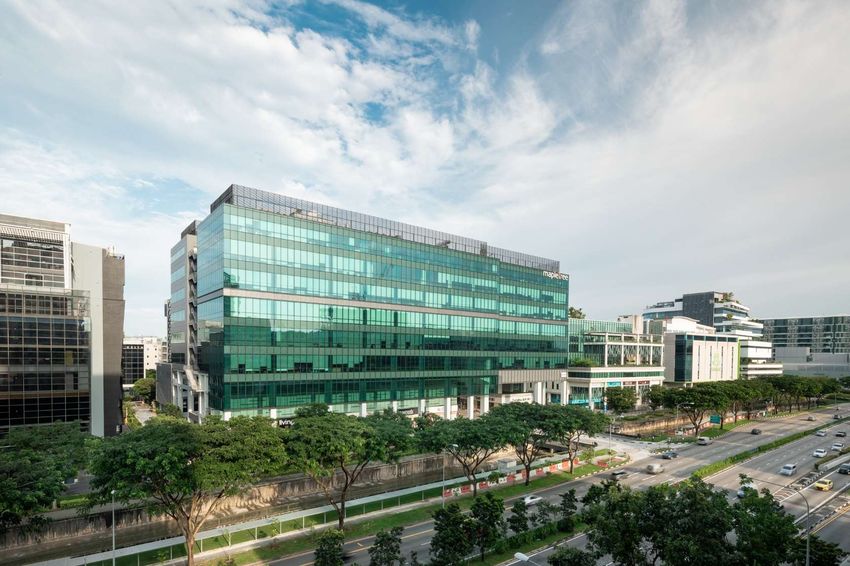
35
SUSTAINABILITY

Solar Panels at the Rooftop of K&S Corporate Headquarters
Building a Climate Resilient Portfolio
                                                 Long-term Targets By FY29/30
             Average Building                               Average Building                                  Total Solar Energy
            Electricity Intensity1                       GHG Emissions Intensity1                            Generating Capacity

               ▼15%                                             ▼17%                                    10,000 kWp
                                         Accelerate Adoption of                                        Attain Green Building
                                           Renewable Energy                                                Certifications
 Achievements             •    Completed installation of solar panels at the           • Re-certified BCA Green Mark accreditations for
                               rooftops of Serangoon North Cluster and                   1 & 1A Depot Close, 30A Kallang Place and
                               K&S Corporate Headquarters in FY20/21                     The Strategy in FY21/22
                                                                                       • Obtained BCA Green Mark GoldPlus certification
                                                                                         for The Synergy
 Plans for                •    To progressively install solar panels at Flatted        • To obtain BCA Green Mark certification for
 FY22/23                       Factories clusters from FY22/23                           Serangoon North Cluster

                                                                                                   The total generating capacity of solar
                                                                                                   panels at Serangoon North Cluster and
                                                                                                   K&S Corporate Headquarters is 848.8 kWp.

     1   For MIT’s properties in Singapore from the base year of FY19/20. FY19/20 was used as the base year as FY19/20 energy performance was more
         representative of operational activities at MIT’s properties prior to the COVID-19 pandemic.
37
OUTLOOK AND
Data Centres, 7337 Trade Street,
San Diego
                                      STRATEGY
Singapore Industrial Property Market
DEMAND AND SUPPLY FOR MULTI-USER FACTORIES            DEMAND AND SUPPLY FOR BUSINESS PARKS

 Total stock for factory and business park space: 39.7 million sq m
 Potential net new supply of 2.2 million sq m in 20221, of which
     •      Multi-user factory space accounts for 0.9 million sq m
     •      Business park space accounts for 0.08 million sq m
     •      Moderation in quantum of industrial land released through Industrial Government Land
            Sales Programme since 2013
 Median rents for industrial real estate for 1Q20221
     •      Multi-user Factory Space: S$1.88 psf/mth (2.7% q-o-q)
     •      Business Park Space: S$4.10 psf/mth (-0.7% q-o-q)
39   1   JTC J-Space, 29 Apr 2022
Outlook
Singapore

 Challenging operating environment in view of uncertainty over trajectory of economic recovery
  from COVID-19 pandemic
     • Singapore economy grew by 3.4% y-o-y in the quarter ended 31 Mar 2022, moderating from the
       6.1% growth in the preceding quarter1
     • Rising energy prices and supply disruptions have resulted in higher and more broad-based inflation.
       Assuming medium-term inflation expectations remain well-anchored, inflation should gradually
       decrease as supply-demand imbalances wane and monetary policy in major economies responds2.
       The United States Federal Reserve had commenced interest rate hikes and the Monetary Authority
       of Singapore had tightened its monetary policy to alleviate inflation pressure
     • Business sentiments dipped slightly in the second quarter of 2022 amid global uncertainties.
       However, growth prospects for domestically-oriented sectors remain strong with the progressive
       easing of safe management measures and travel restrictions3

 Impact on Singapore Portfolio
     • As at 31 Mar 2022, rental arrears of more than one month was 0.8% of previous 12 months’ gross
       revenue, which was lower than 1.0% as at 31 Dec 2021

     1   Source: Ministry of Trade and Industry (Advance Estimates), 14 Apr 2022.
     2   Source: World Economic Outlook Update, International Monetary Fund, Jan 2022.
40   3   Source: Singapore Commercial Credit Bureau, 2Q2022.
Outlook
North America

 Resilient asset class with growth opportunities
     • According to CBRE3, primary market supply grew 17% y-o-y to 3,358.1 megawatts in
       2021. Cloud service providers and social media companies were responsible for the
       bulk of leasing activity in 2021
     • Rental rates held steady in the second half of 2021. Compared with 2020, average
       asking rental rates in primary and secondary data centre markets in North America
       dipped 0.4% and 2.0% in 2021 respectively. As demand grows in power-constrained
       markets like Silicon Valley and Northern Virginia, inventory bottlenecks are likely to result
       in rental rate increases

      3   Source: CBRE, North America Data Center Trends H2 2021, Mar 2022.

41
Diversified and Resilient

                                     Anchored by large and diversified tenant base with low dependence
    Stable and
                                      on any single tenant or trade sector
 Resilient Portfolio
                                     Focus on tenant retention to maintain a stable portfolio occupancy

                                     Application of distribution reinvestment plan to help fund progressive
           Enhanced
                                      needs of development projects
           Financial
                                     Healthy interest coverage ratio of 5.7 times1 and hedged borrowings
           Flexibility
                                      of 70.5%2

        Growth by                    Redevelopment at 161, 163 & 165 Kallang Way to be slated for full
     Acquisitions and                 completion in 1H2023
      Developments                   Completed the proposed divestment of 19 Changi South Street 1

       1   Refers to adjusted interest coverage ratio for the trailing 12 months.
42     2   As at 31 Mar 2022.
End of Presentation
For enquiries, please contact Ms Melissa Tan, Director, Investor Relations,
DID: (65) 6377 6113, Email: melissa.tanhl@mapletree.com.sg
You can also read