INVESTOR PRESENTATION - Grenergy

Page created by Cathy Walsh
 
CONTINUE READING
INVESTOR PRESENTATION - Grenergy
INVESTOR
PRESENTATION

May 2021
INVESTOR PRESENTATION - Grenergy
DISCLAIMER
   By attending this presentation and/or by accepting this presentation you will be                 cial condition or results of operations by the Company and should not be relied upon
   taken to have represented, warranted and undertaken that you have read and                       when making an investment decision. Certain financial and statistical information in this
   agree to comply with the contents of this disclaimer.                                            document has been subject to rounding off adjustments. Accordingly, the sum of
   The information contained in this presentation (“Presentation”) has been prepared by             certain data may not conform to the expressed total.
   Grenergy Renovables S.A. (the “Company”) and has not been independently verified and              Certain statements in this Presentation may be forward-looking. By their nature,
   will not be updated. No representation, warranty or undertaking, express or implied, is          forward-looking statements involve a number of risks, uncertainties and assumptions
   made as to, and no reliance should be placed on, the fairness, accuracy, completeness or         which could cause actual results or events to differ materially from those expressed or
   correctness of the information or opinions contained herein and nothing in this Presenta-        implied by the forward-looking statements. These include, among other factors, chan-
   tion is, or shall be relied upon as, a promise or representation. Neither the the Company        ging economic, business or other market conditions, changing political conditions and
   nor any of its employees, officers, directors, advisers, representatives, agents or affiliates     the prospects for growth anticipated by the Company’s management. These and other
   shall have any liability whatsoever (in negligence or otherwise, whether direct or indirect,     factors could adversely affect the outcome and financial effects of the plans and events
   under contract, tort or otherwise) for any loss howsoever arising from any use of this           described herein. Any forward-looking statements contained in this Presentation and
   Presentation or its contents or otherwise arising in connection with this Presentation.          based upon past trends or activities should not be taken as a representation that such
   This Presentation is for information purposes only and is incomplete without reference           trends or activities will continue in the future. The Company does not undertake any
   to, and should be viewed solely in conjunction with, the Company’s publicly available            obligation to update or revise any forward-looking statements, whether as a result of
   information and, if applicable, the oral briefing provided by the Company. The informa-           new information, future events or otherwise.
   tion and opinions in this presentation are provided as at the date hereof and subject to         The market and industry data and forecasts that may be included in this Presentation
   change without notice. It is not the intention to provide, and you may not rely on these         were obtained from internal surveys, estimates, experts and studies, where appropriate
   materials as providing, a complete or comprehensive analysis of the Company’s finan-              as well as external market research, publicly available information and industry publica-
   cial or trading position or prospects.                                                           tions. The Company, it affiliates, directors, officers, advisors and employees have not
   This Presentation does not constitute investment, legal, accounting, regulatory, taxation or     independently verified the accuracy of any such market and industry data and forecasts
                                                                                                    and make no representations or warranties in relation thereto. Such data and forecasts
   other advice and does not take into account your investment objectives or legal, accoun-
                                                                                                    are included herein for information purposes only. Accordingly, undue reliance should
   ting, regulatory, taxation or financial situation or particular needs. You are solely responsi-
                                                                                                    not be placed on any of the industry or market data contained in this Presentation.
   ble for forming your own opinions and conclusions on such matters and for making your
   own independent assessment of the Company. You are solely responsible for seeking                The distribution of this Presentation in other jurisdictions may be restricted by law and
   independent professional advice in relation to the Company. No responsibility or liability is    persons into whose possession this presentation comes should inform themselves about
   accepted by any person for any of the information or for any action taken by you or any          and observe any such restrictions.
   of your officers, employees, agents or associates on the basis of such information.               NEITHER THIS PRESENTATION NOR ANY OF THE INFORMATION CONTAINED HEREIN
   This Presentation contains financial information regarding the businesses and assets of           CONSTITUTES AN OFFER OF PURCHASE, SALE OR EXCHANGE, NOR A REQUEST FOR
   the Company. Such financial information may not have been audited, reviewed or                    AN OFFER OF PURCHASE, SALE OR EXCHANGE OF SECURITIES, OR ANY ADVICE OR
   verified by any independent accounting firm. The inclusion of such financial information            RECOMMENDATION WITH RESPECT TO SUCH SECURITIES.
   in this Presentation or any related presentation should not be regarded as a representa-         The securities of the Company may not be offered or sold in the United States of Ameri-
   tion or warranty by the Company, its affiliates, advisors or representatives or any other         ca except pursuant to an effective registration statement under the Securities Act of
   person as to the accuracy or completeness of such information’s portrayal of the finan-                            1933 or pursuant to a valid exemption from registration.                   01
INVESTOR PRESENTATION - Grenergy
GRENERGY IN A NUTSHELL

                   INTEGRATED BUSINESS MODEL, present in the entire value chain of our projects

                From a purely Solar PV player to a MULTI-ENERGY company (Solar PV, Wind, Storage)

       MULTI-REGIONAL player, with strong presence in EUROPE (Spain, Italy, UK) and LATAM (Chile, Colombia, Peru)

        Highly contracted 6GW pipeline with dual strategic approach: B2O (build to own) and B2S (build to sell)

           Company focused on ESG matters: ranked 5th out of 575 in the Utilities sector by Sustainalytics

                      FINANCIAL GROWTH & consistent TARGET OUTPERFORMANCE translated
                         into outstanding market cap evolution and volume per day (c.3M€)

                                                                                                                    02
INVESTOR PRESENTATION - Grenergy
INTEGRATED BUSINESS MODEL
Creating the right structure to develop and build >1 GW annually PV from 2023

                                                    Integrated Player
                     Grenergy has the expertise to build and operate large-scale renewable energy plants

                                                                                                    Operation &
                                                                                                    Maintenance

                Development            Construction                Services
                                                                                                       Asset
                                                                                                    Management

                                            Supported by our global teams

                         Energy Generation              Structured                   M&A
                          PPA Origination                Finance                Asset Rotations                   03
INVESTOR PRESENTATION - Grenergy
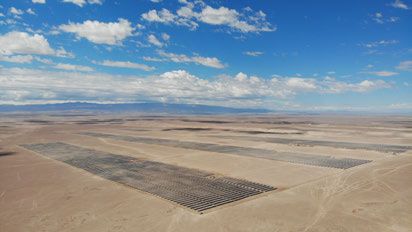
A STORY OF GROWTH WITH A PROVEN TRACK RECORD
   Evolving into a Multitech & Multicountry IPP
                            2007          2012            2015               2021               20231

                           INCEPTION     END FIT2          IPO               TODAY            TOMORROW
                                       OPENING CHILE   MAB GROWTH

           Technology

        Geographical                                                                                    + new
                                                                                                          markets
           Presence

                                                       300 MW Pipeline   6.0 GW Pipeline
                Pipeline                                                                   2.5 GW IPP Target
                                                         50 MW built     >500 MW built

1: Company target                                                                                                   04
2: Feed In Tariff SPAIN
KEY FIGURES

      Key         6.1 GW                  417 MW                  448MW                      2.9GW                +1.6 GW
   operational     Pipeline                 Under                 Backlog                 Advanced          A.D Pipeline increase
     figures                              construction                                    Development           Last 12 months

                                   198MW                     660MW                       1,5GW                  2,5GW
                 B2O                 2020
                                                +500MW
                                                                 2021
                                                                          +800MW
                                                                                          2022
                                                                                                 +1,000MW
                                                                                                                 2023

   Operational
     targets
                                                                                                     100-200 MW/Yr
                 B2S                >45 plants
                              Connected and transferred
                                                                    >470MW
                                                                        built
                                                                                                     2021-2023 period

      2020                     €113M                    €24M                      €15M                   3.1x
    Financial                 Revenues                  EBITDA                  Net Income           1Q21 Leverage
     Figures
                                                                                                                                    05
KEY INVESTMENT HIGHLIGHTS
Attractive equity story

                  1       RENEWABLES REVOLUTION

                  2       PLATFORM WITH OUTSTANDING GROWTH POTENTIAL

                  3       STRATEGY AND OPERATIONAL TARGETS

                  4       STRONG GOVERNANCE STRUCTURE WITH FOCUS ON ESG

                                                                          06
1-RENEWABLES REVOLUTION
        Wind & Solar to represent 30% of installed global capacity by 2040
                          Electrification and Green Hidrogen geneneration to increase global demand of electricity
              Global installed power capacity is projected to rise from c. 6.7TW in 2016 to 12.0TW in 2040, with c. 30% of installed
                                          capacity being renewable (c. 17% Solar PV and c. 14% Wind)

                                      Global Installed Capacity (GW)1                                                                       LCOE3 Evolution – Solar PV and Wind ($/MWh)

                                                      d     3.6x - Other 1.4x                                           400
                                   Solar PV 7.6x - Win                               11,961                             350
                                                                   9,725                                                300
                                                8,647                                                                   250
                              6,677                                                                                     200
                                                                                                                        150
                                                                                                                        100
                                                                                                                         50
                                                                                                                          0
                                                                                                                              2009     2010      2011     2012    2013           2014   2015    2016   2017   2018   2019   2020
                             2016E            2025E           2030E                  2040E
                                         Solar & Wind      Other technologies                                                                                         Wind                Solar PV

                            Global Installed Capacity – By Technology (%)                                                                                LCOE3 – By Technology ($/MWh)
                                                                                4%
                                                                           4%
                                               19%                                                                            Gas Combined Cycled                44               73

                                                                   17%                                                                           Coal                      65                          159
                                                   7%                                          46%
                  62%             2016(2)
                                                   2%
                                                                                2040E                                                         Nuclear                                     129                  198
                                                                   14%
                                                6%                                                                                    Onshore Wind         26               54
                                               4%
                                                                         15%
                                                                                                                              Solar PV (Utility Scale)      29        38
                   Fossil Fuels    Hydro       Wind     Solar PV         Nuclear      Other Renewables

Note: (1) Global Average Annual Capacity Additions under the New Policies Scenario, 2017-2040 (IEA); (2) Latest actual figure for WEO is 2015; (3) Levelized Cost of Energy                                                        07
Slide Source: OECD/IEA 2017 World Energy Outlook, IEA Publishing, Perspectivas 2018-2022 Iberdrola, Lazard’s Levelized Cost of Energy Analysis 2020
1-RENEWABLES REVOLUTION IN EUROPE

                                                   Presence in Europe                                              Grenergy is present in some of the largest
                                                                                                                       renewable markets in Europe...
                                                                                                                       Solar1 & onshore wind installed capacity by country (GW)

                                                                                                                          33.0                                                                                Solar
                                                                                                                                                           26.6                         23.2                  Wind
                                                                                                                          25.2                             10.2                         12.9
                                                                                                                            7.8                            16.4                         10.3
        UK          New Market: UK
     Early stage                                                                                                                …with attractive growth potential…
      388MW                                                                                                Solar & onshore wind installed capacity NECP targets by country (GW)
                                                                                                 Grenergy has presence                                            Potential new markets
                                                                                                    +56GW                 +42GW                    +79GW             +56GW                 +55GW         +11GW
                                                                                                                                                                        146
                   Italy                                                                                  89                                            102          90                            80
                                                                                                                                   69
              Early stage                                                                           33                     27                      23                                      25                 17
                                                                                                                                                                                                          6
              260MW
                                                                                                   2019 2030              2019 2030                2019 20302        2019 2030            2019 2030      2019 2030

                                                                                                            …and some of the vastest solar and wind resources
                                                                                                         European Radiation Map                                       European Wind Resource Map
             Spain                                                                                                                                                      Resources at 50m above
                                                                                                                                                                        ground level, open plain (Watt
     Under            Adv.                                                                                                                                              per sq. meter):
     cons.            Dev.                                                                                                                                                  >500 Wm-2
                                                                                                                                                                            300– Wm-2
    200MW          1.247MW                                                                                                                                                  200–300 Wm-2
                                                                                                                                                                            100–200 Wm-2
1-RENEWABLES REVOLUTION IN LatAm

                                     Presence in LatAm              The need of renewable energy sources in
               Mexico                                                      LatAm will keep growing
              Operating                                             Energy Demand    Renewable Capacity
               35MW                                                      (TWh)         Evolution (GW)
                                                         Chile                                            Renewable energy in Chile is
                                                                     79.9    93.2                         the fastest growing sector of
              Colombia                                                                         23.9        the country’s. The growth is
        Under                                                                          11.5                 attributable to favourable
        cons.       Backlog
                                                                                                           policy, grid interconnection,
        12MW        58MW                                             2019A   2029E    2019A    2029E      and wind and solar resources
         Adv.          Early
         Dev.          stage
        58MW        696MW
                                                         Colombia                                           The Colombian renewable
                                                                             95.1                             market is expected to
                                                                     70.4
                                                                                                4.0          experience rapid growth,
                                                                                                          boosted by investments both
                Peru                                                                   0.2                 from the private and public
        Under           Adv.                                        2020A    2030E    2020A    2030E
        cons.           Dev.                                                                                          sector
        36MW        342MW
                                                         Peru                                                  Despite short term
                                                                     49.7    62.9                                  headwinds,
                                                                                                17.6
                Chile                                                                                       the renewables sector is
                Under
                                                                                       15.6                expected to outperform,
  Operating     cons.      Backlog
                                                                                                          particularly in solar and wind
  103MW        85MW        295MW                                     2019A   2029E    2019A    2029E         due to the outstanding
        Adv.            Early                                                                                       resources.
        Dev.            stage
      1,192MW       1,203MW                              Mexico                                           Mexico is the country with the
                                                                             347.7                          most installed renewable
                                                                    283.9                      49.0
                                                                                                          capacity in LatAm and has a
              Argentina                                                                25.2                high growth potential, but is
              Operating                                                                                   currently in (stand by) due to
                                                                     2019A   2029E    2019A    2029E
               24MW                                                                                          the current Government

                                                                                                                                           09
SOURCE: BNEF, BMI
KEY INVESTMENT HIGHLIGHTS
Attractive equity story

                  1       RENEWABLES REVOLUTION

                  2       PLATFORM WITH OUTSTANDING GROWTH POTENTIAL

                  3       STRATEGY AND OPERATIONAL TARGETS

                  4       STRONG GOVERNANCE STRUCTURE WITH FOCUS ON ESG

                                                                          10
2-PIPELINE UPDATE
            Project portfolio
                                                                                  Highly visible 6.1 GW pipeline

                    Estimated COD2                                                    Project Classification1 1Q21                                                                             6.0GW
                                                                                                                                                                                               FY20
           2025                                        < 50%                                             Early Stage
                                                                                                                                                                                             2,547MW
                                                    Success Rate                                          2,344MW                                                -203MW

           2024
                                                       > 50%                                   Advanced Development
                                                                                                                                                                                             2,839MW
                                                    Success Rate                                     2,869MW                                                     +30MW
           2023
                                                       > 80%                                                Backlog
                                                                                                                                                                                              353MW
                                                    Success Rate                                            448MW                                                +95MW

           2022                                                                                        Ready to Build

                                                                                                   Under Construction
                                                      > 100%                                            417MW                                                    +120MW                       297MW
                                                    Success Rate                                                                                                                              198MW
            2021                                                                                         In operation
                                                                                                            198MW

1
    This classification of the pipeline phases has been made by the company itself on the basis of its previous experience in projects carried out, using its own internal criteria and procedures.    11
2
    Commercial Operation Date
2-PIPELINE UPDATE
  Total pipeline increased by 1.6 GW YoY

                                            >1 GW of projects either in operation, construction or backlog

               SOLAR PV                                                                           WIND
                                                 Under               Advanced Early     Total                                Under             Advanced Early    Total
               MW                                Const     Backlog     Dev    Stage    pipeline   MW                         Const   Backlog     Dev    Stage   pipeline
                                    In                                                                              In
               Probability       Operation                                                        Probability    Operation
                                                  100%       80%       >50%    50%
2-PIPELINE UPDATE
       Projects Under Construction & Backlog

                     865MW to be commissioned in the next months with a strong contracted profile

                      Country                   Project                    Type    MW              B20         Resource        COD
                                                                                                                (Hours)

                      Chile                     Quillagua                  Solar   103             Yes           2,950         4Q20
                      Mexico                    San Miguel de Allende      Solar    35             Yes           2,300         1Q21
                      Peru                      Duna                       Wind     18             Yes           4,900         4Q20
                      Peru                      Huambos                    Wind     18             Yes           4,900         4Q20
                      Argentina                 Kosten                     Wind     24             Yes           5,033         1Q21
                      Total in Operation                                           198
                      España                    Escuderos                  Solar   200             Yes             2,128       3Q21
                      Chile                     PMGD (10 projects)         Solar   103             Yes         1,924-2,442   2Q21-4Q21
                      Chile                     PMGD (4 projects)          Solar    42             No          1,924-2,442   2Q21-4Q21
                      Colombia                  Distribution               Solar    72             Yes             1,957       4Q21
                      Total UC                                                     417    (Vs. 297 previous report)
                      España                    Belinchon                  Solar   150             Yes           2,150         3Q22
                      España                    Jose Cabrera               Solar    50             No            2,156         4Q22
                      Chile                     Quillagua2                 Solar    111            Yes           2,950         4Q21
                      Chile                     PMGD (6 projects)          Solar    61             Yes        2,000-2,734    4Q21-2Q22
                      Chile                     PMGD (6 projects)          Solar    64             No         2,000-2,734    4Q21-2Q22
                      Colombia                  Distribution (1 project)   Solar    12             Yes           1,990         4Q21
                      Total Backlog                                                448    (Vs. 353 previous report)
                                                                                                                                         13
SOURCE: Company ı COD: Commercial Operation Date 19
2-PIPELINE UPDATE
        Projects in Advanced Development

                   On track to deliver solid growth with 2.9 GW of projects in advanced development
                                 with a geographical and technological diversification
                                                                                            Resource
                           Country          Project                     Type     MW                           COD        Offtaker    Negotiation
                                                                                             (Hours)
                           España           Ayora                       Solar    172           2,212          4Q22     PPA 70-80%     Advanced
                           España           Tabernas                    Solar    300           2,358          4Q22     PPA 70-80%     Advanced
                           España           Tres Cantos                 Solar    575           2,000         2Q23      PPA 70-80%      Initial
                           Colombia         Distribution (5 projects)   Solar     58        1,915-1,957      4Q23      PPA 70-80%    Advanced
                           Colombia         Compostela                  Solar    120           2,079         1Q23       PPA 70-80%     Initial
                           Chile            PMGD (12 Projects)          Solar    120       2,200-2,700     4Q22-2Q23   PMGD Regime   Completed
                           Chile            Victor Jara                 Solar    240          2,800           2Q23       PPA 60%        Initial
                           Chile            Algarrobal                  Solar    240          2,800           3Q23       PPA 60%        Initial
                           Chile            Teno                        Solar    240          2,186           1Q23       PPA 60%        Initial
                           Chile            Gabriela                    Solar    264          2,800           4Q22       PPA 60%        Initial
                           Chile            Lawal                       Solar    100          2,200           1Q24       PPA 60%        Initial
                           Chile            Amanita                     Solar     35          2,000           2Q23       PPA 60%        Initial
                           Chile            Tamango                     Solar    45           2,000           2Q23       PPA 60%       Initial
                           Chile            PMGD (2 projects)           Wind     18           4,000           2Q23     PMGD Regime   Completed
                           Peru             Matarani                    Solar    80           2,750           4Q22       PPA 100%      Initial
                           Peru             Lupi                        Solar    150          2,900           4Q22      PPA 100%     In progress
                           Peru             Emma_Bayovar                Wind      72          4,000           4Q22      PPA 100%     In progress
                           Peru             Nairas                      Wind     40           5,100           4Q22      PPA 100%     In progress
                           Total                                                2,869   (Vs. 2,839 previous report)

                                                                                                                                                   14
SOURCE: Company ı COD: Commercial Operation Date
FOCUS - SOLAR PV CAPEX
                                                                Solar PV CAPEX evolution and 2022 estimates

                                     2020 Post Covid                          2021                        2022 Post CNY1           Tiers 1 Module capacities (GW)
                            EUR     Price W  Cost per MW              Price W   Cost per MW             Price W  Cost per MW
             Modules                0,193       193.000                0,20       200.000               0,180       180.000
                                                                                                                                                            2020       2021     2022
             Trackers               0,086        86.000               0,100       100.000               0,090        90.000           Longi                  24         45
             Inverters              0,040        40.000               0,040        40.000               0,038        38.000
                                                                                                                                      Jinko                  19         30
             Cable                  0,035        35.000                0,04        40.000               0,035        35.000
             Logistics              0,009         9.000               0,030        30.000               0,015        15.000           JA Solar               15         30
             Civil works            0,027        27.000               0,027        27.000               0,027        27.000

                                                                                                                                                                                Expected to continue growing in 2022
             Others BoP              0,01        10.000               0,013        13.000                0,01        10.000           Trina Solar            15         35
             Total                              400.000                           450.000                           395.000           Canadian Solar         11,3       20
             Exchage rate                          1,14                              1,21                             1,23
                                                                                                                                      Risen Energy           10         20
       2020 post Covid                                                                                                                Q Cell                 6,5         8
           • Covid affected positively to module prices, moving down from 0.25cts/$ to slightly below 0.20cts/$.
                                                                                                                                      First Solar            5,7        6,7
                    2021
                                                                                                                                      GCL-SI                 3,5         5
           • Module prices move back to 0.23/0.24 $. However, exchange rate moved from 1,14$/€ to current 1,21$/€,
             impacting positively to module cost in euros.                                                                            Rest                   44         44
           • Significant increase in logistics and steel commodity prices is affecting negatively to shipment cost and trackers.
                                                                                                                                                             154        244
         2022 Post CNY  1
                                                                                                                                                                       58%
           • IEA said that despite relatively high commodity and freight prices, it expects module prices to be lower at the
             end of 2021 than the average Chinese price in 2020, which was around 0.205 $ per watt.
           • Steel is expected to trade at 852 USD/MT (vs 912 USD/MT) by the end of this quarter, according to Trading             Total new Solar PV Installed capacity (GW)
             Economics global macro models and analysts' expectations. Looking forward, they estimate it to trade at 697
             USD/MT in 12 months time.                                                                                                IEA forecast           135        145     162
           • Freight cost expected to get smoothly down to preCOVID levels.
                                                                                                                                                                                                                       15
1
    Company estimate
KEY INVESTMENT HIGHLIGHTS
Attractive equity story

                  1       RENEWABLES REVOLUTION

                  2       PLATFORM WITH OUTSTANDING GROWTH POTENTIAL

                  3       STRATEGY AND OPERATIONAL TARGETS

                  4       STRONG GOVERNANCE STRUCTURE WITH FOCUS ON ESG

                                                                          16
3-STRATEGY AND OPERATIONAL TARGETS - B20
            Grenergy increases its IPP target to 2,5 GW in 2023

                                         Grenergy plans to have a construction rate of more than 1GW from 2023

                                                                                                                           2023 Estimation
              MW                 198                      660                      1,460                   2,460
                  Chile                                                                                    1,000
                                                                                                                       Chile
                  Spain                                                              800                    +100   934 MW (37%)            Spain
                  Colombia                                                                                                            1.100 MW (44%)
                  Peru                                                                +100                  +100

                  Argentina
                  Mexico                                   500
                  Italy                                                              +400                   +500
                                                            +66

                                                            +200
                                  198
                                                                                                                                        Rest2
                                  +24                                                                                               461 MW (18%)
                                  +35                                                +300                   +300
                                  +36                       +231
                                  +103

                                  YTD                      20211                     20221                 20231

                                                     Diversifying to EMEA markets to feed our future growth
                                                                                                                                                       17
1
    Estimate. ı   2
                      Rest means Argentina 24MW, Peru 36MW, Colombia 266MW, Mexico 35MW and Italy 100MW.
STRATEGY AND OPERATIONAL TARGETS - B20
  2021 IPP Projects on track - 500MW
                            200MW - ESCUDEROS Sola                                             72MW - 6 distribution proj
                                                     r PV                                                                ects
                             project under constructio                                            Under Construction
                                                      n                                          15 years PPA signed with Ce
                                 12 yerar PPA signed with GA                                                                lsia
                     Backlog 200MW - Belincho               LP                                       Ongoing PPA negotiations
                                             n and   Jose Cabrera RTB 4Q21

                                                           - 14 PMGD projects U nder Construction
                                                     145MW                     ancial negotiations
                                                                             ing fin
COD: Commercial Operation Date                           Backlog 236MW - Ongo r construction                                       18
SOURCE: Company                                                       2 projects unde
3-STRATEGY AND OPERATIONAL TARGETS - B20
        Built to Own: D&C margin covering a large part of the equity

                                                                               Example of a project finance structure
                                                                             Power plants financed with non-recourse
                                                                            debt & additional tranche of mezzanine debt
                                           70%                           D&C gross margin covers a large part of Grenergy’s
                                                                              equity contribution to each B&O project

                                 100%

                                                      10%

                                                                20%

                                 Project   Senior   Mezzanine   Equity       D&C         Grenergy
                                 Capex      Debt      Debt                  Margin        Equity
COD: Commercial Operation Date                                                                                                19
SOURCE: Company
3-STRATEGY AND OPERATIONAL TARGETS - B20
 Focus: Structured finance

                        Up to date US$ 400 M                                             > US$ 400 M
                         total secured financing                                       under negociation

                      2020              2020             2020            2021                2021          2021/22

                        CIFI         KFW/BANKINTER       NATIXIS
                    US$ 17,5 M        US$ 96,7 M       US$ 85 M        US$ 65 M            US$ 50 M        US$ 308 M
     2019           1 pv project      4 pv projects      PMGD’s         111 MW              90 MW           660 MW
                      35 MW            200 MW           130 MW           Chile              Colombia          Spain
                      Mexico              Spain            Chile       Quillagua 2

    SECURITY
   US$ 60,3 M
    1 pv project
     100 MW
                      2019               2018            2017            2016                2016            2015
       Chile

                     CAF/ICO              KFW           SECURITY           CIFI             SECURITY           IDB
                   US$ 36,8 M         US$ 31,7 M       US$ 41,2 M      US$ 9,8 M           US$ 19,2 M      US$ 7,5 M
                   2 wind projects    1 wind project   7 pv projects   3 pv projects       2 pv projects   2 pv projects
                      36 MW             24 MW           45,4 MW          12 MW               20 MW            6 MW
                        Peru           Argentina           Chile           Chile               Chile           Chile

                                                                                                                           20
3-STRATEGY AND OPERATIONAL TARGETS - B2S
       Strong track record generating value through a sell-down strategy, allowing Grenergy to accelerate growth

                                                             Build to Sell (B2S)

                                                                                                        73
                          €M                                                                 72

                                                                                   +72%

                                                             44              44

                                                    +3x            +0%

                                              17

                                 4   +4x

                           2015              2016           2017            2018           2019        20201

                                           Grenergy expects to rotate 100-200 MW annually until 2023

COD: Commercial Operation Date
SOURCE: Company                                                                                                    21
1
  Exchange rate 1,12 $
KEY INVESTMENT HIGHLIGHTS
Attractive equity story

                  1       RENEWABLES REVOLUTION

                  2       PLATFORM WITH OUTSTANDING GROWTH POTENTIAL

                  3       STRATEGY AND OPERATIONAL TARGETS

                  4       STRONG GOVERNANCE STRUCTURE WITH FOCUS ON ESG

                                                                          22
4-STRONG GOVERNANCE WITH FOCUS ON ESG
 Committed management team with sound track record in the sector

                                               Executive – 1/2 Independent members – 1/3 Female members
                                                NON-INDEPENDENT MEMBERS                   INDEPENDENT MEMBERS
        BoD in line                                     David Ruiz de Andrés              Nicolás Bergareche Mendoza
                                                    Chairman (Propietary, Exec.)                    Director
        with Stock
      Exchange Best                                     Antonio Jiménez Alarcón               Ana Peralta Moreno
                                                         Director (CFO, Exec.)                     Director
        Practices
                                                      Florentino Vivancos Gasset            Rocío Hortigüela Esturillo
                                                        Director (Proprietary)                     Director

                             Management Committee                                  Business Units Directors
                                 David Ruiz de Andrés                                     Emi Takehara
                                         CEO                                           Structured Finance
                                Antonio Jiménez Alarcón                                 Gonzalo de Rojas
         Highly                           CFO                                            Development
       experienced                 Mercedes Español                                       Alfredo Casas
       management                       M&A                                                    EPC
          team                       Daniel Lozano                                        Daniel Barman
                                  IR+Communication                                        Energy Sales
                                      Alvaro Ruiz                                          Luis Collazo
                                         Legal                                         Services (O&M + AM)

           Top Management fully aligned with shareholders through stock options programmes                               23
4-STRONG GOVERNANCE WITH FOCUS ON ESG
 ESG Action Plan - 2023 ROADMAP

                               Strategic pillars and TCFD Recommendations
                The four objectives approved by the ESG Policy will be reached by implementing
                                the ESG Action Plan on five core functional areas

                                                                      Number
        ESG Policy                      Action areas                 of actions             Aim

        ESG Governance                                                            ✔ Create a solid ESG Governance
                                           Governance                    16
           structure                                                                structure

        Prevention and                      Strategy                     5        ✔ Integrate ESG objectives within
     mitigation of negative                                                         Corporate strategy
            impacts                      Risk management                 8        ✔ Integrate ESG risks

      Promotion of positive                                                       ✔ Boost positive impacts and
                                           ESG Impacts                   31
           impacts                                                                  mitigate negative

                                                                                  ✔ Implement the necessary tools
     Stakeholder's relations             Communication                   8          to quantify Grenergy’s ESG
                                                                                    footprint in the community

                                                                                                                      24
4. ESG - CARBON FOOTPRINT 2020
Emissions reduction targets

                         CARBON FOOTPRINT                                  INDEPENDENT                                               EMISSIONS REDUCTION
                           CALCULATION                                     VERIFICATION                                                  TARGETS SET
                     New sources of scope 3                           Identification of sources and                          Reduce scope 1&2            Reach scope 1&2
                      emissions included to                                 calculations were                                   emissions                   emissions
                                                                         independently verified
                    comply with GHG Protocol

                         Scope 1&2: 421.61 tCO2                                              CO2e
                                                                                                                                55%                     Net zero
                                                                                             Assessed                        tCO2e/GWh
                         Scope 3: 67,458 tCO2e                                               Organisation
                                                                                                                                 by 2030                      by 2050

                                     EMISSIONS SOURCES MAP

                  SCOPE 3                                 SCOPE 1-2                                         SCOPE 3
         Supply chain              Construction      O&M                                      Corporate
           Sea freight              Subcontractor   Company               Office buildings                  Business trips
                                      machinery      vehicles
                                                                                                                                             REDUCTION STRATEGY
                                                                                                                                 • Renewable energy sources for own consumption
          Road freight                                                                                       Third party
                                       Waste                                                                  vehicles           • Energy efficiency opportunities identification
                                                                          Home-workers
                                                                                                                                 • Transition to clean corporate cars analysis

     Solar panels production                                                                                   Waste

                                                                                                                                                                                    25
4-ESG - EXTERNAL RECOGNITION

    OUR FIRST ESG RATING ACHIEVED

    ESG Risk Rating                           Ranking                             Strong Mangement of                            Peers                    ESG Risk Rating
                                                                                  all ESG material issues:

    13.6
                                                                                                                                 1. Scatec                       12.8 Low
                                              INDUSTRY GROUP                                      Governance
                            Low Risk          Utilities          5 out of 575    Land Use and
                                                                                                                                 2. Grenergy Renovables          13.6 Low

                                                                                   Biodiversity                Business Ethics   3. Voltalia                     15.2 Low
                                                                                                                                 4. Acciona                      21.1 Medium
                                                                                    Product                     Human Capital
                                              SUBINDUSTRY                        Governance                                      5. audax                        25.1 Medium

     Negl.   Low     Med.    High    Severe
                                              Renewable Power
                                              Production
                                                                 3   out of 68                                                   6. Neoen                        25.3 Medium
                                                                                 Ocupacional Health      Community Relations     7. Solarpack                    - (not rated)
     0-10    10-20   20-30   30-40    40+                                                and Safety
                                                                                                                                 8. Solaria                      - (not rated)

    OUR EMPLOYEES TRUST LEVEL TESTED
                                                          • Great place to Work certification obtained
                                                          • We measured our employees experience through Trust Index© surveys
                                                          • Surveys launched in summer 2020 following to the COVID-19 confinement period

                                                          94% satisfied with treament received
                                                          92% feels proud to work at Grenergy
                                                          79% thinks Grenergy is an excellent place to work.

                                                                                                                                                                                 26
4-ESG-CASE STUDY QUILLAGUA

        Quillagua solar PV project
          • Quillagua phase 1: 103 MW in operation
          • Quillagua phase 2: 111 MW in backlog
          • Located in the desert of Atacama, Chile
        Socioeconomic situation of local community
          • Limited access to electricity 8-11 hours per day via diesel powered generator
          • Difficult economic development due to remote location
        Grenergy´s commitment
          • Provide electricity supply 24h from renewable sources
          • Construction works of 350KW solar PV plant to start in May 2021
          • Local employment and training
          • Support to promote tourism
          • Protection of cultural heritage improving local museum facilities

           Lifes of more than 150 local people directly benefited from the project,
                            including Aymara indigenous group

                                                                                            Componentes básicos de la instalación
                                                                                             PV solar panels:   520W JINKO JKM520M-7TL4-BDVP
                                                                                             Inverter:          Huawei SUN2000-185HTL
                                                                                             Structure:         SolarFix. Fixed structure 25º
                                                                                             Peak Power:        349.440 Wp

                                                                                                                                                27
4-STRONG GOVERNANCE WITH FOCUS ON ESG
         Translating into solid value creation for its shareholders
                                 General Information                      Shareholders (as of May, 2021)1

            Share Information                                                   Free
                  ● Currency: EUR                                               Float
                                                                                 40
                  ● Market: Spanish Stock Exchange
                  ● ISIN: ES0105079000
                  ● Ticker code: GRE
                  ● Market Cap. (as of May 20th, 2021) 8202M€;
                  ● 30 Day Avg Volume. (as of May 20th, 2021) 79.530                              David Ruiz
                                                                                                  de Andrés
                    (c.3M€)                                                                         60%
                  ● Number of shares (as of May 20th, 2021):
                    27,926,911
                                                                               Banks covering the stock
            Share Information
                  ● Admision to trading in to the main market last
                    16th December 2019.

            Share Information
                  ● inversores@grenergy.eu
                                                                       Grupo

                                                                                                               28
Note (s): David Ruiz de Andrés through Daruan Group Holding
APPENDICES
PLATFORM WITH RELEVANT GROWTH POTENTIAL
      Project Portfolio

                                                                                                         Project Classification1

                                                                              Early Stage                                   Projects with technical and financial feasibility:
                                < 50%                                                                                         • Possibilities to secure land and grid; and/or
                            Success Rate                                       2,344MW                                        • Possibilities to sell it to third parties

                                                                                                                            Projects with an advanced technical and financial stage:
                                > 50%                              Advanced Development                                       • +50% Probability to secure land; and/or
                            Success Rate                                 2,869MW                                              • +90% Probability to get grid access; and/or
                                                                                                                              • Environmental permits requested

                                                                                                                            Projects in a final phase before construction:
                                > 80%                                            Backlog                                      • Secured land and grid access; and/or
                                                                                                                              • +90% Probability to obtain environmental permits
                            Success Rate                                         448MW                                        • Off-take agreements, PPA, or bankable scheme of stabilized
                                                                                                                              prices secured / ready to be signed

                                                                            Ready to Build                               Ready to Build: Financing close, PPA in place or negotiation of EPC

                                                                        Under Construction                               Under Construction: EPC provider has been mandated to start
                               > 100%                                        417MW                                       construction works
                            Success Rate
                                                                             In operation                                In Operation: Project responsibility transferred from the EPC
                                                                                198MW                                    provider to the project operator

                                                                                                                                                                                                      30
1
    This classification of the pipeline phases has been made by the company itself on the basis of its previous experience in projects carried out, using its own infernal criteria and procedures.
1Q21 RESULTS
Profit and Losses

                    Solar and Wind projects producing EBITDA in the energy division
                               Profit and losses
                               (€k)                                            Q1 21     Q1 20     Delta
                               Revenue                                         18,701    33,278    (44%)
                                Income from customer sales                     9,856     22,838    (57%)
                                Income from related from third party sales     8,845     10,440    (15%)
                               Procurement                                   (13,808)   (24,108)   (43%)
                                Procurement from third parties                (4,963)   (13,668)   (64%)
                                Activated cost                                (8,845)   (10,440)   (15%)
                               Gross Margin                                  4,893       9,170      (47%)
                               Personnel expenses                            (2,015)    (1,318)      53%
                               Other incomes                                   512         11      4.555%
                               Other operating expenses                      (1,618)    (2,291)     (29%)
                               Other results                                   (15)        25      (160%)
                               EBITDA                                         1,757      5,597     (69%)
                               Depreciation and amortization                 (1,018)     (196)      419%
                               EBIT                                            739       5,401      -86%
                               Financial incomes                                26         15        n.m
                               Financial expenses                            (1,734)     (565)      207%
                               Exchange rate differences                      1,249      (979)     (228%)
                               Financial result                              (459)      (1,529)    (70%)
                               Result before taxes                            280        3,872      -93%
                               Income tax                                       111      (445)      -125%
                               Net Income                                      391       3,427      -89%
                                                                                                            31
1Q21 RESULTS
Balance Sheet              Balance Sheet
                           (€k)                                  31/03/21    31/12/20    Var.

                           Non-current assets                    209,762     169,499    40,263
                           Intangible assets                       9,298        9,143      155
                           Fixed asset                            178,769    144,768     34,001
                           Assets with right of use                 11,371     5,284     6,087
                           Deferred tax assets                     10,091      10,217     (126)
                           Other fix assets                          233          87       146
                           Current assets                        187,670     88,699      98,971
                           Inventories                            24,368      18,169      6,199
                           Trade and other accounts receivable    45,936      42,755      3,181
                           Current financial investments            4,707      6,461     (1,754)
                           Other current financial assets           2,921        745      2,176
                           Cash and cash equivalents             109,738      20,569     89,169
         Triple equity     TOTAL ASSETS                          397,432     258,198    139,234

        balance due to     (€k)                                  31/3/21     31/12/20     Var.
                           Equity                                155,507      48,835    106,672
       the share capital   Non-current liabilities               151,200      143,518    7,682
           increase        Deferred tax liabilities               5,728       5,591        137
                           Non-current provisions                 4,966        3,421     1,545
                           Financial debt                        140,506     134,506     6,000
                             Bonds                                21,488      21,497       (9)
                             Debt with financial entities         109,509     108,653     856
                             Finance lease                         9,379      4,200      5,179
                             Other debts                           130          156       (26)

                           Current liabilities                    90,725      65,845    24,880
                           Current provisions                      908         839         69
                           Trade and other accounts payable       54,695      44,049    10,646
                           Financial debt                         35,122      20,957     14,165
                             Current financial liabilities          451         152       299
                             Short-term financial lease           32,683      17,069     15,614
                             Other current liabilities              815        682        133
                             Group Loan                            1,173       3,054     (1,881)

                           TOTAL LIABILITIES AND EQUITY          397,432     258,198    139,234    32
1Q21 RESULTS
     Net Debt

                                               Leverage reduced to 3.1x

                           Net Debt
                           (€k)                                            1Q21         FY20       1Q21-FY20
                           Long-term financial debt                   39,668,228    35,026,283      4,641,945
                           Short-term financial debt                   13,621,726    4,832,787      8,788,939
                           Other long term debt                          130,159       156,189       (26,030)
                           Other short term debt                        1,172,573    3,054,370      (1,881,797)
                           Other current financial assets             (4,706,757)   (6,460,724)      1,753,967
                           Cash & cash equivalents                  (105,464,054)   (12,492,510)   (92,971,544)

                           Corporate Net Debt with resource         (55,578,125)    24,116,395     (79,694,520)
                           Project Finance debt with resource        57,943,786     50,382,935       7,560,851
                           Project Finance cash with resource         (917,025)     (5,631,607)      4,714,582

                           Project Finance Net Debt with resource    57,026,761     44,751,328     12,275,433
                           Project Finance debt without resource      63,091,741    62,009,987       1,081,754
                           Project Finance cash without resource     (3,348,968)    (2,445,133)     (903,835)

                           Net Debt without resource                 59,742,773     59,564,854       177,919
                           Total Net Debt                            61,191,409     128,432,577    (67,241,168)

                                                                                                                  33
1
    IFRS audited figures
SHARE CAPITAL INCREASE: USE OF PROCEEDS
                    Grenergy has successfully secured its capital needs with an ABB in 1Q21

     • Size of the deal: 105M€       • Admission to trading 22nd March 21           • Total Shares: 27,926,911         • 40% free float after the deal

                                                                            ABB Key figures:
                                              350-400M€
                                                                            • The book had c.50 lines with strong international demand.
                                 300-350M€
   Capex                                                                    • Long-only accounts represented the majority of the allocations, with the
Investment                                                                    top 10 allocations taking over 60% of the book.
                200-250M€
 ~ 1000 M€                                                                  • Largest equity offering by a Spanish-listed renewables company in 2021
                                                                              year-to-date.

                   2021            2022           2023                      This operation allows us:
                +500MWs          +800MWs      +1000MWs                      • To obtain the necessary funds for achieving our IPP targets &
                                                                              strengthening the organizational structure.
                     Sound financial structure                              • To accelerate our international expansion and pipeline of projects.
              • Project debt (85/15 structure)                              • To triple our equity balance and reduce total leverage.
  Capex       • Strong cash position (109M€, March 2021)                    • To increase share liquidity per day and let new international investors get
 Finance      • Funds from Operation from:                                    in as company shareholders.
                 · Service and Energy div. recurrent cash in                • To show management belief in our share by purchasing new shares in the
                 · Build and Sale secure income                               deal.

                                                                                                                                                            34
Developers and IPP of SOLAR PV & WIND projects

   Chile - Spain - Peru - Colombia - Italy - Mexico - Argentina - UK
You can also read