INVESTOR PRESENTATION CHARGEURS, A PIONEER IN THE SUSTAINABLE TRANSFORMATION OF OUR NICHE INDUSTRIAL MARKETS - October 2019
←
→
Page content transcription
If your browser does not render page correctly, please read the page content below
INVESTOR PRESENTATION

CHARGEURS, A PIONEER IN THE
SUSTAINABLE TRANSFORMATION OF OUR
NICHE INDUSTRIAL MARKETS

                           October 2019
SUMMARY

Chargeurs – Investor Presentation – 2019 October             ―2

Chargeurs is standing firmly by its strategic growth targets in a
                                  more volatile environment                                   (1/3)

                                                   Creating global champions in niche markets with a high value-added, low capital intensity and
                    Our core business              strong growth potential
                                                       ➔ In the space of 4 years, the Group has become no. 1 worldwide in each of its businesses

                                                   Over 90% of revenue generated
                                                   outside France
                                                                                          Full-year revenue                Growth track for target of €1bn in revenue and an
                                                   Higher profitability                                                               operating margin of >10%
                                                                                              (€ million)
                                                   A growth plan that is regularly
                                                   reinforced
                                                   Confirmation of our revenue targets:                                                                                      1,000

                   Our aims and                          > €750m by 2020,
                   objectives
                                                                                                620
                                                         including future acquisitions
                                                         ➢ €1bn by the end of 2021              ROP                                                                          ROP
                                                                                                                                                                             >10%
                                                                                               > 8.5%
                                                             in full year
                                                                                                2018          Organic growth   Arbitrage on low-profit   External growth   End of 2021
                                                   Diversified sources of growth:                                                     revenue                               (Full year)

                                                   like-for-like and acquisition-led

Chargeurs – Investor Presentation – 2019 October                                                                                                                                          ―3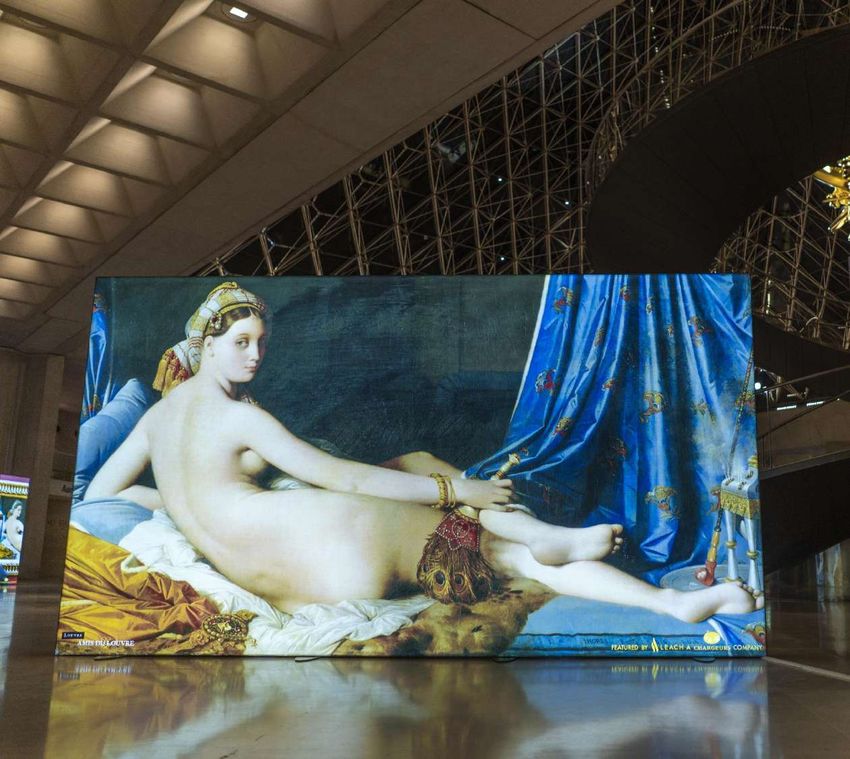
Chargeurs is standing firmly by its strategic growth targets in a
                                  more volatile environment                                   (2/3)

                                                   ⚫   Increasing operating margins over the long term in all of our businesses by constantly keeping
                                                       them on a tight rein
                                                   ⚫   Putting in place a strong strategy aimed at:
                                                       ▪ Evenly weighting our worldwide coverage
                                                         ➔ Ultimate objective: 1/3 Europe, 1/3 Americas, 1/3 Asia
                    Our strategic
                                                       ▪ Evenly weighting the contribution from our various businesses
                    approach,                            ➔ Ultimate objective: 40% materials, 30% textiles and 30% new businesses (CTS)
                    underpinned by                     ▪ Reinventing low-profit businesses to boost performance, and investing in high-potential
                    the Game Changer                     businesses
                                                         ➔ Example: Creation within CTS of Chargeurs Creative Collection, a leader in materials and
                    plan                                 services for museums

                                                   ⚫   Acquisitions of high value-added companies
                                                       ▪ International champions bought for a good price and well integrated

Chargeurs – Investor Presentation – 2019 October                                                                                                        ―4
Chargeurs is standing firmly by its strategic growth targets in a
                                  more volatile environment                                  (3/3)

                                                   ⚫   Heavy investments to futureproof the Group:
                                                       ▪ TSC1, acquisitions of PCC and Leach in 2018
                                                   ⚫   Regular dividend payments to our shareholders since 2015
            Our achievements                       ⚫   Strategy of capturing growth and remaining resilient in a difficult operating
                                                       environment
                                                   ⚫   €19m increase in annual recurring operating profit since 2015

                                                   ⚫   A stronger capital base for our reference shareholder ➔ Confidence in our future

           Our commitment                          ⚫   Significant financial flexibility and low debt: no leverage covenant, long-term financing
                                                       (> 7 years)

                                                   ⚫   €1bn in revenue
           Our success                             ⚫   Recurring operating margin > 10%
           indicators for 2022                     ⚫   Solid cash generation

Chargeurs – Investor Presentation – 2019 October                                                                                                   ―5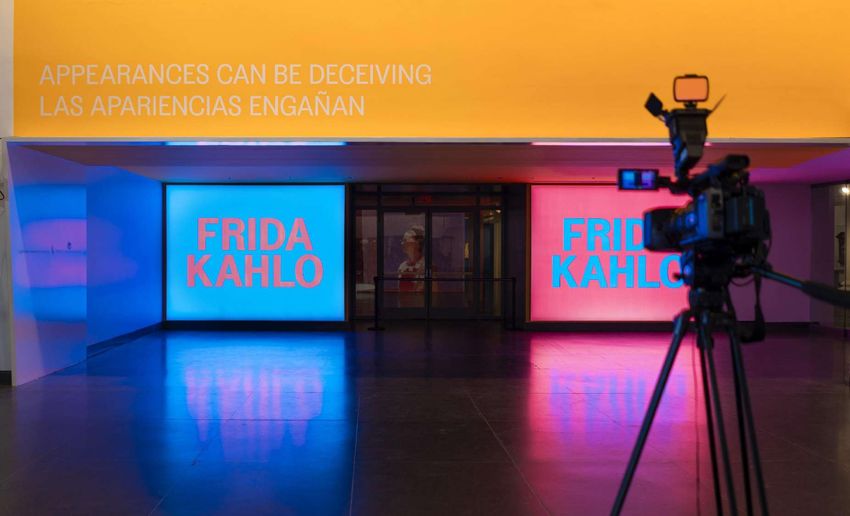
H1 2019 – one of the Group’s best-ever first-half performances despite the
                                  economic environment and a peak in opex and capex                     (1/2)

                                                   ⚫   H1 2019: revenue up 13.6%, EBITDA up 6.2% and cash flow up 5.1%; return to like-for-like growth in Q2 2019
                                                   ⚫   H1 2019 recurring operating profit of €22.7m – one of the Group’s best-ever first-half performances, despite:
                                                       ▪ An exceptionally high basis of comparison
                                                       ▪ The impact of the unfavorable economic context on Chargeurs Protective Films
            Resilience                                 ▪ The peak in opex and capex under the Game Changer plan
                                                   ⚫   A more balanced weighting of regions and businesses, limiting the temporary adverse effect of the economic
                                                       environment

            Ongoing expenditure to                 ⚫   Management teams strengthened in our businesses for acquisitions and integrations
            futureproof the Group                  ⚫   Higher expenditure on training, innovation and marketing ➔ better long-term mix
            and productivity plan                  ⚫   Cost-savings plan stepped up
            stepped up

                                                   ⚫   Recurring operating margin: 2018 = 8.5% ➔ 2022 target > 10%
                                                   ⚫   To reach the 2022 target, Chargeurs:
             Work on long-term                         ▪ Will leverage synergies from its acquisitions: €2.5m per year expected as from 2020 -> 2/3 CFT-PCC and 1/3 CTS
             margins                                   ▪ Is increasing its production capacity for highly technical products: 4.0 coating line at CPF, Sublimis at CTS
                                                       ▪ Is focusing its innovation efforts on “green” products
                                                       ▪ Is intensifying its sales presence in growth markets
Chargeurs – Investor Presentation – 2019 October                                                                                                                          ―6
H1 2019 – one of the Group’s best-ever first-half performances despite the
                                  economic environment and a peak in opex and capex                     (2/2)

                                                            ⚫    9 first-rate acquisitions including Main Tape, CPSM (Asidium, Omma,                     Game Changer: sequence of investments and
                                                                                                                                                             their impact on operating margin
        Ongoing acquisitions                                     Walco), Leach, PCC and the 3 global champions making up the               2,5%
                                                                 Chargeurs Creative Collection network
        strategy                                            ⚫    Solid pipeline of high profit potential acquisitions
                                                                                                                                           2,0%

                                                                                                                                           1,5%

                                                                 ⚫   Majority of capex already underway                                    1,0%
        Reinforcement of                                         ⚫   Streamlining of structures and securing of new contracts and new
        businesses in a volatile
                                                                                                                                           0,5%
                                                                     market share
        economic environment                                     ⚫   Priority to cash flow generation and the optimization of WCR          0,0%
                                                                                                                                               2017        2018         2019        2020             2021
                                                                                                                                                      Game Changer Opex    Improvement in margin
   Growth track for end-2021 confirmed (subject to macro-economic conditions remaining constant)
   Full-year revenue                               Growth track for target of €1bn in revenue
       (€ million)                                     and an operating margin of >10%
                                                                                                                  ➔ ROP 2019 > ROP 2017
                                                                                             >1,000
                                                                     750        internal
                                                                      -         growth,
                                                                                                                  ➔ Targets confirmed:
                                 620          internal growth,                                                        • €1bn in revenue by 2021
            533                                   targeted
                                                                     800          new
                                                                               targeted                               • >10% normative operating margin from 2022
            ROP                  ROP            acquisitions                                   ROP
                                                                              acquisitions
            8.3%                 8.5%            underway                                    > 10.0%
         2017              2018                         2020 *                          end-2021
   * Target of full-year revenue of €750m to €800m in 2020 including future acquisitions
Chargeurs – Investor Presentation – 2019 October                                                                                                                                                       ―7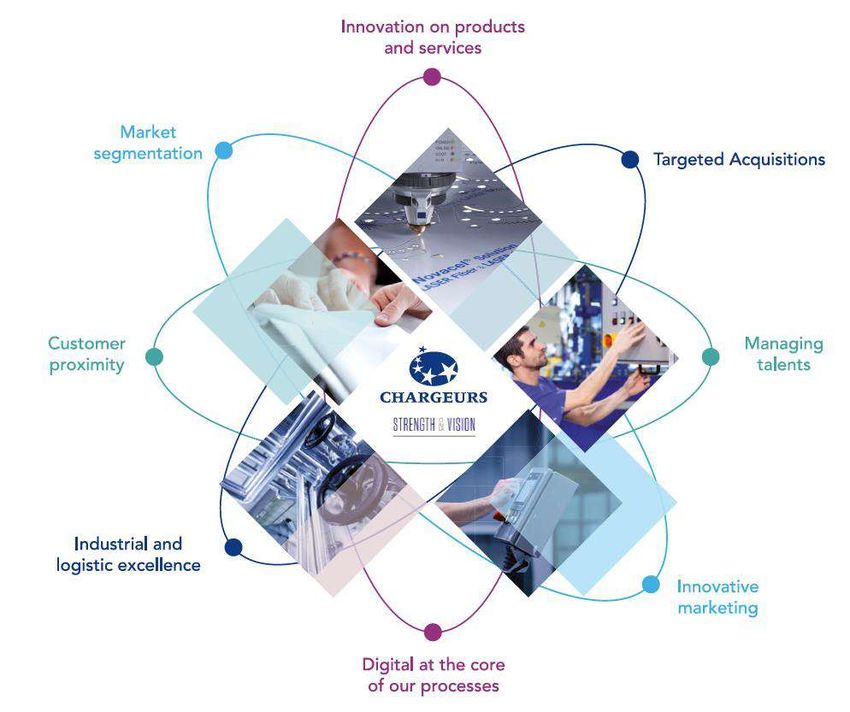
CONTENTS

                                                   1. Chargeurs, a world leader in high value-added niche markets

                                                   2. Since 2015:
                                                      a methodical strategy of growth
                                                      to achieve €1bn in revenue by 2021 Performance since 2015

                                                   3. Performance since 2015

                                                   4. A successful acquisition program:
                                                      > €100 m in additional revenue from value-generating acquisitions,
                                                      purchased at reasonable price

                                                   5. Outlook and opportunities

                                                   6. Appendices

Chargeurs – Investor Presentation – 2019 October                                                                           ―8
CHARGEURS
                                 1
                                                   A WORLD LEADER IN HIGH VALUE-ADDED NICHE MARKETS

Chargeurs – Investor Presentation – 2019 October                                                      ―9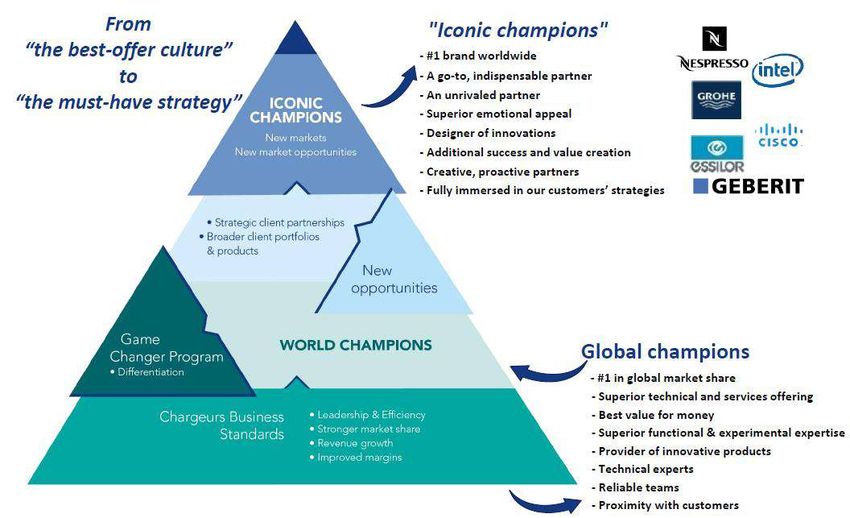
Robust growth and well on track to meet its revenue target
AMERICAS EUROPE ASIA
WORLDWIDE
Leadership positions Industrial
IN NICHE MARKETS
excellence
OF LTM OF LTM OF LTM
SERVING OVER REVENUE REVENUE REVENUE
90
AT JUNE 30, 2019 AT JUNE 30, 2019 AT JUNE 30, 2019
CHARGEURS Surface quality
PROTECTIVE protection films
COUNTRIES
6 7 4
FILMS No. 1 worldwide
OVER 90% OF REVENUE
GENERATED IN
CHARGEURS INTERNATIONAL MARKETS
PLANTS PLANTS PLANTS
Technical textiles for the
PCC FASHION luxury and fashion
TECHNOLOGIES industries
A fast-growing Group
No. 1 worldwide
A SOLID
well on track to meet its revenue target
CHARGEURS
TECHNICAL
SUBSTRATES
Visual communications
and museum heritage
management and visitor
17 Full-year revenue
(€ million)
Growth track for target of €1bn revenue and
10% operating margin
Balance sheet
Signature of a
experience services PLANTS game-changing
No. 1 worldwide
> 1,000
€230 million
syndicated credit
16
750
CHARGEURS High-quality -
internal
agreement in
growth,
LUXURY combed wool 533
620 internal growth,
800 new December 2018, with
targeted
MATERIALS No. 1 worldwide ROP ROP acquisitions
targeted
ROP excellent financial
R&D AND QUALITY acquisitions
LABORATORIES
8.3% 8.5% underway > 10.0% terms and
2017 2018 2020 * end-2021 conditions
* Target of full-year revenue of €800m in 2020 including future acquisitions
Chargeurs – Investor Presentation – 2019 October ― 10Chargeurs Protective Films
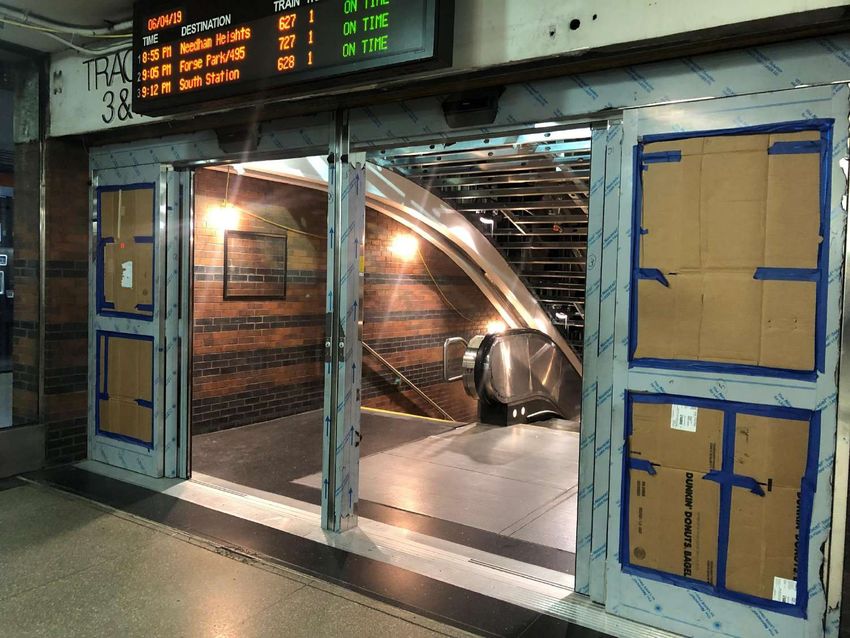
From New York Penn to Boston, stations under renovation
Chargeurs – Investor
Chargeurs Presentation
– Investor – 2019
Presentation October
– 2019 October ― 11CHARGEURS
PROTECTIVE
FILMS A Market Leader Dedicated to Customer Service
An expert manufacturer of self-adhesive plastic films used to protect surfaces at every stage of the transformation, handling,
transportation and fitting process
◼ A comprehensive range of products developed by leveraging expertise in all the related technologies
Raw materials for films Extrusion Process
(ex: Polyethylene beads)
Industrial Transformation Warehousing & Application machine Surfaces
Coating Global supply chain (ex: Somerra’s laminator)
Raw materials Formula
for adhesive Development
(ex: rubber resin)
◼ 3 main customer markets 3 marchés principaux (a dozen niche segments): construction, manufacturing and electronics industries
◼ Strategic focus on delivering innovation and partnering customers by recommending bespoke surface protection solutions, with a constant
commitment to sustainable development
◼ A global leader:
⚫ Over 90% of revenue generated in international markets
⚫ Over 600 employees in some 20 countries
⚫ 7 production units: France (2), Italy (2), United States (3)
Chargeurs – Investor Presentation – 2019 October ― 12Chargeurs PCC Fashion Technologies
From the Fendi Show to the New York Marathon
Chargeurs – Investor Presentation – 2019 October ― 13Chargeurs
PCC Fashion
Technologies Positioned competitively as a worldwide leader
An expert in the production of interlining, the only technical fabric used by the apparel industry, which is essential to
help garments keep their shape
◼ Vertically integrated production, to maintain control over all phases in the production process
Knitting Coating Inspection
Warping Shrinkage Total Quality Warehousing &
Drying Control Global Supply Chain
◼ A diversified customer base that includes prestigious brands
◼ A strategy focused on high value-added production combined with a highly selective marketing approach and tight control over
costs
◼ A "think global, act local" organization:
⚫ Some 90% of revenue generated in international markets
⚫ Over 750 employees in more than 20 countries
⚫ 7 production units on 4 continents
Chargeurs – Investor Presentation – 2019 October ― 14Chargeurs Technical Substrates
From the Louvre to the Brooklyn Museum
Chargeurs – Investor
Chargeurs Presentation
– Investor – 2019
Presentation October
– 2019 October ― 15CHARGEURS Leader in the visual communication field
TECHNICAL
SUBSTRATES dedicated to the visitor experience
Two areas of expertise:
Industrial area Graphic service area
SENFA Chargeurs Creative Collections
➔ Mainly dedicated to the digital printing industry
➔ Master the art of custom-made, disruptive and immersive experience
➔ Different markets: advertising, decoration, home design and made-to-
measure clients ➔ Dedicated to museums, luxury brands and major institutions
➔ In-house development and engineering of coating formulations ➔ A unique independent network of autonomous partners Design PM
The coating gives a textile base specific functionalities. ➔ Our Collection can offer, from creativity to execution: Met
CCC Hypsos
Studio
For example, it allows you to print high definition visuals, mask or diffuse
the light, filter the waves, reduce the noise while fireproofing the panel.
▪ bespoke, integrated solutions Leach
1 2 3
▪ supply single services
TEXTILES COATINGS COATING
SELECTION FORMULATIONS PROCESS
6 5 4
WAREHOUSING CONTINUOUS QUALITY INSPECTION
CONTROL
Investor Presentation –October 2019 ― 16Chargeurs Luxury Materials
From The Sheep to The Shop
Chargeurs – Investor Presentation – 2019 October ― 17CHARGEURS
LUXURY
MATERIALS « From the sheep to the shop »
A distinctive innovative business model based on traceability
◼ Local and global expertise with a strict policy of transparent communications with stakeholders
◼ Expertise deployed to meet the needs of leading brands
◼ Label Nativa Precious Fiber
⚫ A wool fiber produced in an ethical and eco-traceable way
⚫ Guarantee of the full respect of animal welfare
⚫ Environment protection and social responsibility
⚫ Guarantee 100% non mulesing
⚫ The fiber is traced thanks to blockchain technology
⚫ The production chain is fully audited by Control Union
⚫ Nativa offers wool tops or yarn from 16 to 23 microns
Chargeurs – Investor Presentation – 2019 October ― 18SINCE 2015:
2 A METHODICAL STRATEGY OF GROWTH
TO ACHIEVE €1BN IN REVENUE BY 2021
Chargeurs – Investor Presentation – 2019 October ― 19A much larger geographic footprint since 2015 and strong growth
potential in the Americas and Asia
Key A larger international
Revenue footprint
Production units In 2015, Chargeurs generated over
Distribution units 90% of its revenue in international
Offices markets, with some 1,500
Employees employees based in 32 countries.
45%
In 2019, Chargeurs will generate
over 94% of its revenue in
international markets, with more
24% 31% than 2,000 employees based in 45
countries.
Americas
+ 3% since 2015 (*)
4 to 6
7 to 10
2: unchanged Asia
251 to 303 Europe + 59% since 2015 (*)
+ 16% since 2015 (*) 3 to 4
4 to 7 12: unchanged
(*) Difference between LTM revenue at 15 to 14 4: unchanged
June 30, 2019 and annual revenue for 9: unchanged 498 to 764
2015
763 to 1,005
Chargeurs – Investor Presentation – 2019 October ― 20A strategy underpinned by a stronger financial structure
Groupe ◼ Groupe Familial Fribourg significantly raised its investment in Chargeurs’ capital base in
Familial Fribourg
H1 2019 by becoming the controlling shareholder of Colombus Holding
controlling stake ⚫ Groupama – a blue chip, long-term investor – became a shareholder of Colombus Holding
Colombus ⚫ CM-CIC Investissement and BNP Paribas Développement reinvested in the capital of Groupe Familial
Holding Fribourg and retained their interest in Colombus Holding
27.60% ➔ This demonstrates a high level of confidence in Chargeurs’ ability to create strong
industrial and shareholder value over the long term
◼ Considerable increase in the Group’s financial flexibility over the last 12 months
⚫ December 2018: €120m in new money available after setting up a flexible and innovative syndicated loan
⚫ H1 2019: 2016 and 2017 Euro PP notes renegotiated better financial conditions and longer
maturities
▪ Leverage covenant removed
▪ Gearing requirement reduced to 1.2x
▪ Maturity extended by three years for Euro PP notes originally maturing in 2023
➔Average life of Group debt now 5.3 years
Chargeurs – Investor Presentation – 2019 October ― 21A methodical growth strategy deployed since 2015 aimed at achieving €1bn
in revenue by 2021
A clear vision & Well on the way to achieving €1bn
solid strategy A success model
in revenue by 2021
Acting as a “designer” of our niche Managerial transformation to drive Upscaling and multiplying sources of
markets to create integrated value internal and external growth growth
chains
◼ A winning mindset and a ◼ Simplifying the customer universe
◼ Strong technical expertise
performance culture ◼ Proposing multiple solutions to
◼ Global supply chain management
◼ Ongoing optimization of the business customers
◼ Consumer-centric and service-oriented
model in order to meet their challenges
organizational structure
◼ A solid financial model ◼ Seizing highly profitable opportunities
◼ Globally-recognized B2B brands
◼ 9 acquisitions generating €100m in that pave the way for game-changing
revenue developments
Chargeurs – Investor Presentation – 2019 October ― 22Our value creation drivers Chargeurs – Investor Presentation – 2019 October ― 23
Key non-financial components of our overall performance

                                                                                                     Innovation            Innovating to meet global challenges and
                                                                                                                           enhance the sustainability of our customers’
                                                                                                                           products
                                                          Governance
                                            Applying a robust corporate governance
                                            structure to ensure the consistency of
                                                                                                                                                       Talent
                                            Chargeurs’ strategy over the long term
                                                                                                                                                     management
                                                                                                                                                                              Investing in employees to
                                                                                                                                                                              support the Group’s growth

                                                                  Community
                                                                 engagement
                                   Supporting community
                                   initiatives that have a
                                                                                                                                                        Environment
                                   positive impact on society                                                                                          Limiting our impact on
                                                                                                                                                       climate change by
                                                                                                                                                       controlling our energy use
                                                                                     Investing in digital
                                                                                     technology to secure ties
                                                                                                                 Digital                               and our air emissions

                                                                                     between Chargeurs and
                                                                                     its ecosystem
Chargeurs – Investor Presentation – 2019 October                                                                                                                                                           ― 24
Game Changer: the Group’s performance acceleration plan
SMART AND
ADVANCED
MANUFACTURING
Improving the performance of
Objective: our production assets
Reducing our production costs
• €1bn in revenue by 2021 Reducing our
TALENT
MANAGEMENT
non-quality
• > 10% normative operating margin as from 2022 SALES &
costs Implementing the
Excellence Training Program
MARKETING
Accelerating our Young
Developing the “soft skills” and Executive Program
of our sales teams
Optimizing our
Improving our customer organizational
→ Aimed at speeding up the Group's growth and intimacy structure
Developing new
profitability, designed in collaboration with all of marketing tools INNOVATION
Chargeurs' teams worldwide and focused on four Reviewing our addressable
adjacent markets
key areas Accelerating the development
of break-through innovations
Upscaling our innovation
capabilities, footprint
and network
Chargeurs – Investor Presentation – 2019 October ― 25Game Changer: a premiumization strategy underpinned by
measures to step up the plan
Game Changer: an operating performance acceleration plan that advocates daily discipline in the creation of
long-term value and that is based on four key areas:
Smart & Advanced
Sales and Marketing Talent Management Innovation
Manufacturing
Chargeurs: A designer of leaders recognized in their niche markets whose operations are shaped according to four core principles:
CUTTING-EDGE OPTIMIZED GLOBAL SUPPLY CUSTOMER-CENTRIC AND GLOBALLY-RECOGNIZED
TECHNICAL EXPERTISE CHAIN MANAGEMENT SERVICE-ORIENTED B2B BRANDS
• Industry 4.0 • A global presence • Integrated solutions • Direct links with decision-makers
• Product innovation • Customer proximity • Service provider • Moving up the value chain
• Technical know-how • Technical advice • Creation of recognized brands
Chargeurs – Investor Presentation – 2019 October ― 26Launch of the Iconic Champions plan:
premiumization pursued
Chargeurs – Investor Presentation – 2019 October ― 27Premiumization accompanied by a high -potential marketing
strategy: High Emotion Technologies ®
This global marketing approach is designed to drive the upscaling of the Group and its businesses
A solid industrial heritage... ...Underpinning 3 fundamentals focused on ...which are drivers of accelerated
customer experience and product sublimation... growth
Unique Technology •Winning new market share
know-how Performance
• Highly profitable products
High-level •Premium brand positioning
technical Emotion Marketing •BtoB and BtoBtoC marketing
skills
• Stronger pricing power
• A powerful employer brand
Premium
customer • Internal performance driver
Appeal
service •Reinforced customer
High dialogue
• Customer-centric innovation
Disruptive
Creation of “Intel Inside” effects, which go hand-in- focused on service and
innovation hand with the premiumization of the Group’s Innovation customer experience
different businesses and will make dialogue •Supply chain excellence
between provider and end-user more successful
Chargeurs – Investor Presentation – 2019 October
than ever. ― 28PERFORMANCE SINCE 2015
3
Chargeurs – Investor Presentation – 2019 October ― 29Continued enhancement of Chargeurs’ growth profile,
profitability and resilience
Very robust growth in the Group’s operating performance: a 240-bp increase in ROP(1) margin since 2015
Protective Films Fashion Technologies Technical Substrates Luxury Materials
281.0 283.3
250.3
227.2 157.5 161.1
Revenue 132.0 131.2
93.7 99.5 95.0 98.2
(€m) 30.7
24.6 25.8
20.3
2015 2016 2017 2018 2015 2016 2017 2018 2015 2016 2017 2018 2015 2016 2017 2018
40.3 39.4
33.2
EBITDA
26.8
€m 13.9%
17.9
13.3% 14.3%
11.8% 5.1
(% of 11.7 11.3 11.1% 4.1
4.7 4.9
9.6 16.6%
revenue) 6.1% 8.9% 8.6% 20.2% 19.1% 19.0% 2.6 2.8% 2.9 2.9% 2.6 2.7% 2.7 2.7%
2015 2016 2017 2018 2015 2016 2017 2018 2015 2016 2017 2018 2015 2016 2017 2018
34.3 33.0
28.0
ROP(1) 21.8 14.8
€m
(% of 11.2% 12.2% 11.6% 8.0 8.1 3.8 4.0 4.0
9.6% 9.2% 3.6 2.5 2.7% 2.9 2.6 2.7% 2.7
5.5 3.5% 6.1% 6.2% 17.7% 15.4% 15.5% 13.0% 2.9% 2.7%
revenue)
2015 2016 2017 2018 2015 2016 2017 2018 2015 2016 2017 2018 2015 2016 2017 2018
(1) Recurring operating profit
Chargeurs - Investor Presentation - October 2019 ― 30First-half 2019 key figures
Another strong increase in results
Group Protective Films Fashion Technologies Technical Substrates Luxury Materials
Intensified opex drive Change in scale Creation of a global Premiumization
326.1
champion
281.8 287.1
256.6 253.5
143.3 150.0 142.1 107.7
113.6 120.5
79.7
68.9 67.8 68.8
18.0 53.5 52.5 58.2 53.5 58.2
Revenue 12.5
14.8
9.8 11.6
(€m)
H1 H1 H1 H1 H1 H1 H1 H1 H1 H1 H1 H1 H1 H1 H1 H1 H1 H1 H1 H1 H1 H1 H1 H1 H1
2015 2016 2017 2018 2019 2015 2016 2017 2018 2019 2015 2016 2017 2018 2019 2015 2016 2017 2018 2019 2015 2016 2017 2018 2019
30.6 32.5
29.1
25.3 11.4
21.4 21.6
20.7 19.2
EBITDA 13.5
16.5
6.5
7.7
5.8
€m 8.1% 10.0% 10.3% 10.7% 10.0%
11.9% 13.7% 14.9% 14.4% 13.5%
5.0
1.8
2.3 2.3 2.6 2.3 1.5 1.8 1.7
1.5
9.4% 11.2% 10.6% 1.0
(% of 6.3% 8.6%
18.4% 19.8% 18.4% 17.6% 12.8%
2.8% 3.4% 2.9% 1.9% 2.6%
revenue) +14,6%
H1 H1 H1 H1 H1 H1 H1 H1 H1 H1 H1 H1 H1 H1 H1
H1 H1 H1 H1 H1 H1 H1 H1 H1 H1
2015 2016 2017 2018 2019 2015 2016 2017 2018 2019 2015 2016 2017 2018 2019 2015 2016 2017 2018 2019 2015 2016 2017 2018 2019
23.5 24.8 22.7
ROP 20.3 18.2 18.2 8.1
15.6 14.0 14.1
€m 8.0% 8.3% 8.6% 7.0%
11.0 4.5 4.0
6.0
6.1%
(% of 9.7% 11.6% 12.7% 12.1% 9.9% 2.8 1.5 1.8 1.8 1.9 1.5 1.8 1.7 1.5
5.9% 8.7% 7.5% 1.4 1.0
3.5% 6.5%
revenue) 15.3% 15.5% 14.4% 12.8% 7.8% 2.8% 3.4% 2.9% 1.9% 2.6%
H1 H1 H1 H1 H1 H1 H1 H1 H1 H1 H1 H1 H1 H1 H1 H1 H1 H1 H1 H1 H1 H1 H1 H1 H1
2015 2016 2017 2018 2019 2015 2016 2017 2018 2019 2015 2016 2017 2018 2019 2015 2016 2017 2018 2019 2015 2016 2017 2018 2019
Chargeurs – Investor Presentation – 2019 October ― 31Success of the Annual Productivity Plan
2019 target: €7.3m in cost savings for the full year
Cost savings generated by the annual
productivity plan Productivity plan
7.3 Savings on
production
costs Savings on
distribution
48% 31%
costs
2.2 2.1 9%
3.5 Savings on
administrative €3.5m in
€m and other fixed EBITDA gains
costs
2017 2018 2019 6% achieved in
H1 2019
◼ €3.5m in savings achieved in the six months
ended June 30, 2019, i.e. 48% of the €7.3m
target set for 2019
Savings on raw
◼ €18.2m in total savings material costs
achieved since end-2015 54%
Chargeurs – Investor Presentation – 2019 October ― 32A SUCCESSFUL ACQUISITION PROGRAM:
4 > €100 M IN ADDITIONAL REVENUE FROM VALUE -GENERATING
ACQUISITIONS, PURCHASED AT REASONABLE PRICE
Chargeurs – Investor Presentation – 2019 October ― 33Cementing leadership positions at a faster pace thanks to carefully -purchased and
well-integrated acquisitions in high -potential segments
Guided by the Chargeurs Business Standards, since 2015 Chargeurs has carried out targeted acquisitions, creating champions
in high value-added niche markets.
An ongoing and value-
creating acquisition strategy
Still to come:
> Game-changing “bolt-on”
acquisitions
€25m in revenue
> Pioneering international growth > Acquisitions to move up
> An exhaustive offer in museum the value chain
heritage and conservation
$80m in revenue > Acquisition of a new
operating segment
- Creation of an innovative
global champion
£10m in revenue > Strengthening service
> Disruptive vertical capacities
integration
€8m in revenue > Offering end-to-end
> Moving up the value chain solutions
> Offering integrated solutions
$27m in revenue
> Strengthening leadership in
the United States
> Adding production capacity
in the USD zone
Reinforcing and accelerating the Group’s leadership in all of its businesses
Chargeurs – Investor Presentation – 2019 October ― 34Carefully-purchased and well-integrated acquisitions in high -potential segments:
PCC case study
⚫ PCC: $80m in revenue, of which more than 90% generated in Asia
⚫ 300 employees in a dozen countries, primarily in Asia and the United States
⚫ Leader in nomination
Specialist in ✓ 30 years of business growth
✓ 30 years of business growth
nomination ✓ Top 5 worldwide interlinings manufacturer
✓✓
TopLeading
5 leadingplayer
interlinings manufacturers
in women’s fashion
✓ Leading player in women’s fashion
Key player Powerful ✓ Decision-making at the heart of the Asian fashion industry, with Hong
✓ Decision-making
Kong-basedatheadquarters
the heart of the Asian fashion industry, with Hong Kong-based
in Asia brand headquarters
✓ Sales operations in more than 20 countries, mainly in Asia
✓ Sales operations in more than 20 countries, mainly in Asia
✓ An international player with a local approach
✓ Anand sales teams
international player close
with a to itsapproach
local major customers
and sales teams close to its major
Customer-centric Agile ✓ A streamlined global sourcing strategy
customers
approach model built on long-term
✓ A streamlined partnerships
global sourcing strategy builtwith qualified
on long-term supplierswith qualified
partnerships
suppliers
✓ An innovative business model
✓ Anin a constantly evolving
model in fashion industry
2 Guaranteed levels of
quality innovative business a constantly evolving fashion industry
✓ A consumer-centric sales strategy
Garment ✓ A consumer-centric sales strategy creating comprehensive solutions
Interlinings
makers
Brands Consumers creating comprehensive solutions
✓ Optimized response times to manage market expectations
✓ Optimized response times
1 Direct lines of to manage market expectations
communication
Chargeurs – Investor Presentation – 2019 October ― 35Carefully-purchased and well-integrated acquisitions in high -potential segments:
CCC case study
A global benchmark for museum heritage
management and visitor experience services
Founded in the UK in 1891 Based in London
• Pioneer in large format graphic displays • Major player in project management for museums
• High-end visual communication solutions • Service offering ranging from concept design through to maintenance
for extremely prestigious international organizations • Working primarily with customers located in the Middle East and in direct
• Winner of the 2008 Queen’s Award for Enterprise, contact with international decision-makers
in recognition of over a century of pioneering and disruptive innovation
Founded in the Netherlands in 1910 Founded in London in 1982 and now present on four continents
• Strong international brand recognition, particularly in the Middle East • Solid experience in managing iconic international projects
• Turnkey solutions for exhibition installations and global experiential design
• Many prestigious international customers in some 50 countries
• Production insourced thanks to a new production site
• Winner of several design awards
1
9
Chargeurs – Investor Presentation – 2019 October ― 365 OUTLOOK AND OPPORTUNITIES Chargeurs – Investor Presentation – 2019 October ― 37
Building a long-term model of quality and excellence

    Reasonable but essential levels of capex for transforming a high-potential industrial group
    into the world champion in high value-added niche markets that it has become today

                                                                                    A solid model built on 3 pillars

                                                   ⚫   Game Changer plan
          Premiumizing our                         ⚫   No more low-margin sales
                                                       Customer-centric strategy and disruptive innovation
          businesses
                                                   ⚫
                                                   ⚫   Focus on “green” products

           Reinforcing our                         ⚫
                                                   ⚫
                                                       New production capacities
                                                       Winning new markets
           niche strategy                          ⚫   A stronger distribution network

           Ensuring financial                      ⚫   Solid financial resources
                                                   ⚫   Longer average maturity of borrowings
           flexibility
                                                   ⚫   Leverage covenant removed for Euro PP notes

Chargeurs – Investor Presentation – 2019 October                                                                       ― 38
A targeted and long-term acquisition strategy
An acquisition strategy based on a strict and targeted model
Distinctive Create global champions in high value-added niche markets
vision Focus on accretive businesses
Disruption Game-changing bolt-on acquisitions closely Vertical acquisitions to move up the value Acquisitions in new businesses with high
& Growth in line with our strategy chain and offer end-to-end solutions growth potential
Market analysis Target analysis Evaluation Integration
✓ Structural growth ✓ Strong competitive ✓ Priority given to return on ✓ Extensive work upstream
Strict
✓ Opportunities in positioning capital employed of acquisitions
methodology
fragmented markets ✓ Strong, recognized ✓ Sustainable revenues ✓ Strong focus on the
✓ Strong technical features brands ✓ Accretive value integration of teams and
✓ Opportunities for ✓ Recurring revenue and a ✓ High growth in EBITDA and synergies
synergies solid customer base cash flow ✓ Strict supervision of
✓ Accretive margins measures in place
✓ Strong cultural fit
Chargeurs – Investor Presentation – 2019 October ― 39Ambitious and achievable medium- and long-term objectives
Target for end-2021 confirmed: €1bn in profitable revenue
(subject to macro-economic conditions remaining constant) Steadily rising margins thanks to the
product mix and economies of scale
Full-year revenue Growth track for target of €1bn revenue and
(€ million) 10% operating margin Premiumization and higher
margins
> 1,000 1,000
750 internal
- growth,
620 internal growth,
533 targeted 800 new
acquisitions
targeted 620
ROP ROP ROP
underway acquisitions
8.3% 8.5% > 10.0% Higher barriers to entry
2017 2018 2020 * End of 2021
* Target of full-year revenue of €800m in 2020 including future acquisitions (Full year)
2018 2021
◼ Pursuing our acquisition strategy
⚫ 9 major acquisitions already carried out: Main Tape, CPSM (Asidium,
➔ ROP 2019 > ROP 2017
Omma, Walco), Leach, PCC and Chargeurs Creative Collection’s 3
international champions ➔ Well on track to meet targets:
⚫ A solid pipeline of acquisitions with high earnings potential • €1bn in revenue by 2021
◼ Strengthening our businesses in a volatile operating context • > 10% normative operating margin as from 2022
⚫ Majority of required capex already incurred
⚫ Optimizing structures and conquering new markets
⚫ Focus on cash generation and optimizing WCR
Chargeurs – Investor Presentation – 2019 October ― 40Maximizing shareholder value creation
Shareholder value creation strategy Ownership structure at July 31, 2019: 23 756 103 shares
Ownership structure at May 31, 2019:
Share performance since the change in Chargeurs' governance structure
( CAC 40 and SBF 120 adjusted in line with Chargeurs' share price)
23,756,103 shares
Treasury
+ 104 % stock Colombus
3.8% Holding SAS
27.6%
€30 Sycomore
€25
10.5%
€20 Other
shareholders
€15
58.1%
€10
€5
12/31/15 12/31/16 12/31/17 12/31/18 31/08/19
Chargeurs CAC 40 adjusted SBF 120 adjusted
Dividend per share
A share performance that is now covered by 6 analysts Dividend per share since 2015
+123% since 2015
€0.60 €0.67
€0.55
€0.30 € 0.35 € 0.37
€ 0.35
€0.20 €0.25 €0.30
€0.20
2015 2016 2017 2018 2019
Interim dividend
Chargeurs – Investor Presentation – 2019 October ― 416 APPENDICES Chargeurs – Investor Presentation – 2019 October ― 42
Consolidated Income Statement
    Recurring operating profit once again high despite a more volatile operating environment and high levels of capex

  In euro millions                                 H1 2019 H1 2018      Change            Comments
  Revenue                                            326.1   287.1       +39.0        -1.9% like-for-like against a record figure in H1 2018; internal growth of 0.8 % in Q2 2019
                                                                                 +13.6%
  Gross profit                                        85.0    75.8        +9.2 +12.1%
                                                                                      Persistently high gross profit as a result of the premiumization of the offering
  as a % of revenue                                   26.1%     26.4%
  EBITDA                                              32.5      30.6      +1.9    +6.2%Impact of the productivity plan (€3.5m), the application of IFRS 16 (€3.3m), the integration of PCC and
  as a % of revenue                                   10.0%     10.7%                  Leach, the ramp-up in growth opex and the economic slowdown in Germany and Asia
  Depreciation and amortization                       (9.8)     (5.8)     -4.0    +69% Continued investment strategy: €(0.9)m including 4.0 coating line at CPF, impact of IFRS 16: €(3.1)m
  Recurring operating profit                          22.7      24.8      -2.1         More volatile climate in Germany and China, ramp-up in growth opex -> 4.0 coating line at CPF;
  as a % of revenue                                    7.0%      8.6%                  compared with a record H1 2018
  Amort. intangible assets linked to PPAs             (1.2)      0.0      -1.2         Amort. of brands and customer relations in acquisitions: PCC €(1.1)m and Leach €(0.1)m
                                                                                          o/w: €(1.9)m in costs linked to acquisitions made, €(1.1)m in reorganization costs and €(0.7)m in costs linked
  Non-recurring items                                 (4.2)     (0.1)     -4.1
                                                                                          to acquisitions underway;
  Operating profit                                    17.3      24.7      -7.4            o/w: €(4.1)m linked to non-recurring items and €(1.2)m to intangible assets linked to PPAs
     Finance costs, net                             (4.7)     (4.5)     -0.2               Renegotiation of the Euro PPs issued in 2016 and 2017: longer maturity and staggering of debt
     Other financial income and expense             (1.1)     (0.9)     -0.2               €0.4m negative impact of IFRS 16
  Net financial expense                               (5.8)     (5.4)     -0.4
  Income tax (expense)/benefit                        (3.2)     (4.1)     +0.9
  Investments in equity accounted investees            0.0       0.1      -0.1
  Profit for the period                                8.3      15.3      -7.0            Drop in operating profit, financial expenses maintained

Chargeurs – Investor Presentation – 2019 October                                                                                                                                                           ― 43
Balance Sheet Analysis
A constantly robust balance sheet structure
In euro millions 06/30/19 12/31/18 Comments
Intangible assets 157.6 158.1
Right-of-use assets 27.7 0.0 Impact of the application of IFRS 16 including €11.2m in reclassification of finance leases
Property, plant and equipment 83.1 80.7 CPF Premium production plant and impact of IFRS 16
Investments in equity accounted investees 13.0 13.1
Net non-current assets 11.8 12.9
Working capital 84.4 64.6 Seasonal increase in orders in H1 (CPF and CTS); increase in the price of wool (CLM)
Total capital employed 377.6 329.4
Equity 234.6 237.2 Profit: €8.3m; Dividends: €(5.1)m; Share buybacks: €(4.5)m
Leases (27.8) 0.0 Impact of the first-time adoption of IFRS 16
Net debt/(net cash) (115.2) (92.2) Net cash from op. activities: €0.5m; capex: €(16.3)m; div.: €(5.1)m
Number of shares at June 30, 2019: 23,756,103
◼ Renegotiation of the financial conditions of the Euro PP notes issued in 2016 and 2017 to align them with those of the syndicated credit
facility set up in December 2018
⚫ Leverage covenant removed (net debt/EBITDA)
⚫ Gearing requirement changed to 1.2x from the previously applicable 0.85x
⚫ Maturity extended by three years for Euro PP notes originally maturing in 2023
Chargeurs – Investor Presentation – 2019 October ― 44Statement of cash flows In euro millions H1 2019 H1 2018 Comments EBITDA 32.5 30.6 Up 6.2%: impact of IFRS 16 (€3.3m), growth opex and annual productivity plan Non-recurring – cash (4.2) (2.0) Acquisition-related expenses Finance costs – cash (5.3) (4.5) Strengthening of financial resources and extended maturity of borrowings Income tax – cash (0.4) (2.4) Other 0.2 0.0 Cash generated by operations 22.8 21.7 Up 5.1%: robust cash generated by operations Change in working capital (at constant exchange rates) (22.3) (16.4) Rise in WCR linked to orders at CPF and CTS; increase in the price of wool at CLM Net cash from operating activities 0.5 5.3 Cash: increase in WCR absorbed by cash generated by operations Purchases of PPE and intangible assets (16.3) (9.1) Principally linked to the 4.0 production line at Chargeurs Protective Films Acquisitions 0.0 (14.2) May 2018: acquisition of Leach Dividends (5.1) (4.4) Balance of the dividend paid for the previous year Currency (0.5) (0.1) Other (1.6) (0.1) o/w €(4.5)m linked to the repurchase of shares; €3.9m linked to the first-time adoption of IFRS 16 in H1 2019 Total (23.0) (22.6) Negative impact over the period principally as a result of a sustained investment policy Debt (-)/cash (+) at opening (12/31/y-1) (92.2) 8.9 Debt (-)/cash (+) at closing (06/30/y) (115.2) (13.7) Chargeurs – Investor Presentation – 2019 October ― 45
2019 INVESTOR CALENDAR
Thursday, November 14, 2019    Third-quarter 2019 financial information
(after the close of trading)

Chargeurs
112, avenue Kléber
75 116 Paris
+33 1 47 04 13 40
comfin@chargeurs.com
www.chargeurs.com
You can also read