Penn National Gaming, Inc - First Quarter 2021 Earnings Presentation May 6, 2021
←
→
Page content transcription
If your browser does not render page correctly, please read the page content below

ibdroot\projects\IBD-NY\hadley2020\662888_1\Investor Presentation\Template (From PNG)\Project Fastbreak Investor
Presentation (Part 1).pptx

                 Penn National Gaming, Inc                                                                         .
                   First Quarter 2021
                   Earnings Presentation

                   May 6, 2021

                                                                                                                       1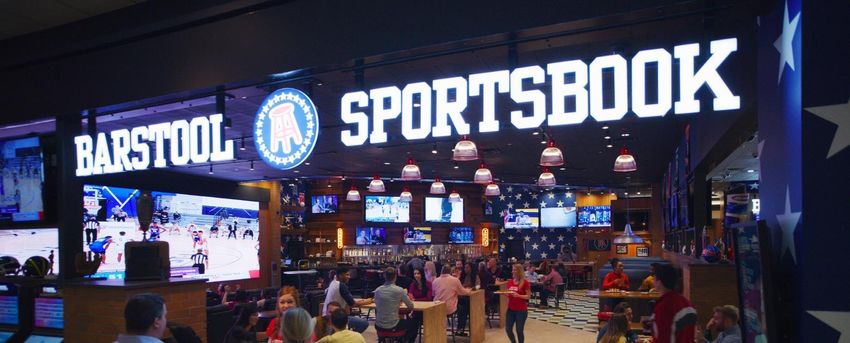
ibdroot\projects\IBD-NY\hadley2020\662888_1\Investor Presentation\Template (From PNG)\Project Fastbreak Investor
        Presentation (Part 1).pptx

 Non-GAAP Financial Measures
In addition to GAAP financial measures, management uses Adjusted EBITDA, Adjusted EBITDAR, Adjusted EBITDAR margin, Combined Revenues, Combined Adjusted EBITDA, Combined Adjusted EBITDAR and
Combined Net Income as non-GAAP financial measures. These non-GAAP financial measures should not be considered a substitute for, nor superior to, financial results and measures determined or calculated in
accordance with GAAP. Each of these non-GAAP financial measures is not calculated in the same manner by all companies and, accordingly, may not be an appropriate measure of comparing performance
among different companies. We define Adjusted EBITDA as earnings before interest expense, net; income taxes; depreciation and amortization; stock-based compensation; debt extinguishment and financing
charges; impairment losses; insurance recoveries, net of deductible charges; changes in the estimated fair value of our contingent purchase price obligations; gain or loss on disposal of assets, the difference
between budget and actual expense for cash-settled stock-based awards; pre-opening and acquisition costs; and other income or expenses. Adjusted EBITDA is inclusive of income or loss from unconsolidated
affiliates, with our share of non-operating items (such as interest expense, net; income taxes; depreciation and amortization; and stock-based compensation expense) added back for Barstool Sports and our
Kansas Entertainment joint venture. Adjusted EBITDA is inclusive of rent expense associated with our triple net operating leases (the operating lease components contained within the Penn Master Lease and
Pinnacle Master Lease (primarily land), the Meadows Lease, the Margaritaville Lease, the Greektown Lease and the Tropicana Lease). Although Adjusted EBITDA includes rent expense associated with our triple net
operating leases, we believe Adjusted EBITDA is useful as a supplemental measure in evaluating the performance of our consolidated results of operations. Adjusted EBITDA has economic substance because it is
used by management as a performance measure to analyze the performance of our business, and is especially relevant in evaluating large, long-lived casino-hotel projects because it provides a perspective on
the current effects of operating decisions separated from the substantial non-operational depreciation charges and financing costs of such projects. We present Adjusted EBITDA because it is used by some
investors and creditors as an indicator of the strength and performance of ongoing business operations, including our ability to service debt, and to fund capital expenditures, acquisitions and operations. These
calculations are commonly used as a basis for investors, analysts and credit rating agencies to evaluate and compare operating performance and value companies within our industry. In order to view the
operations of their casinos on a more stand-alone basis, gaming companies, including us, have historically excluded from their Adjusted EBITDA calculations certain corporate expenses that do not relate to the
management of specific casino properties. However, Adjusted EBITDA is not a measure of performance or liquidity calculated in accordance with GAAP. Adjusted EBITDA information is presented as a
supplemental disclosure, as management believes that it is a commonly-used measure of performance in the gaming industry and that it is considered by many to be a key indicator of the Company’s operating
results.
We define Adjusted EBITDAR as Adjusted EBITDA (as defined above) plus rent expense associated with triple net operating leases (which is a normal, recurring cash operating expense necessary to operate our
business). Adjusted EBITDAR is presented on a consolidated basis outside the financial statements solely as a valuation metric. Management believes that Adjusted EBITDAR is an additional metric traditionally used
by analysts in valuing gaming companies subject to triple net leases since it eliminates the effects of variability in leasing methods and capital structures. This metric is included as supplemental disclosure because
(i) we believe Adjusted EBITDAR is traditionally used by gaming operator analysts and investors to determine the equity value of gaming operators and (ii) Adjusted EBITDAR is one of the metrics used by other
financial analysts in valuing our business. We believe Adjusted EBITDAR is useful for equity valuation purposes because (i) its calculation isolates the effects of financing real estate; and (ii) using a multiple of
Adjusted EBITDAR to calculate enterprise value allows for an adjustment to the balance sheet to recognize estimated liabilities arising from operating leases related to real estate. However, Adjusted EBITDAR, when
presented on a consolidated basis, is not a financial measure in accordance with GAAP and should not be viewed as a measure of overall operating performance or considered in isolation or as an alternative to
net income because it excludes the rent expense associated with our triple net operating leases and is provided for the limited purposes referenced herein.
Adjusted EBITDAR margin is defined as Adjusted EBITDAR on a consolidated basis divided by revenues on a consolidated basis. Adjusted EBITDAR margin is presented on a consolidated basis outside the financial
statements solely as a valuation metric.
The Company defines Combined Revenues as revenues of Penn National and Greektown, assuming that Greektown was a part of Penn National during the historical periods beginning on January 1, 2019; further,
Combined Revenues are adjusted to assume that Resorts Casino Tunica was not a part of Penn National during the historical periods beginning on January 1, 2019 as Resorts Casino Tunica ceased operations on
June 30, 2019. The Company defines Combined Adjusted EBITDA as Adjusted EBITDA (as defined above) of Penn National and Greektown, assuming that Greektown was a part of Penn National during the
historical periods beginning on January 1, 2019; further, Combined Adjusted EBITDA is adjusted to assume that Resorts Casino Tunica was not a part of Penn National during the historical periods beginning on
January 1, 2019 as Resorts Casino Tunica ceased operations on June 30, 2019. The Company defines Combined Adjusted EBITDAR as Adjusted EBITDAR (as defined above) of Penn National and Greektown,
assuming that Greektown was a part of Penn National during the historical periods beginning on January 1, 2019; further, Combined Adjusted EBITDAR is adjusted to assume that Resorts Casino Tunica was not a
part of Penn National during the historical periods beginning on January 1, 2019 as Resorts Casino Tunica ceased operations on June 30, 2019. The Company defines Combined Net Income as net income of Penn
National and Greektown, assuming that Greektown was a part of Penn National during the historical periods beginning on January 1, 2019; further, Combined Net Income is adjusted to assume that Resorts Casino
Tunica was not a part of Penn National during the historical periods beginning on January 1, 2019 as Resorts Casino Tunica ceased operations on June 30, 2019. Management believes that presenting Combined
Revenues, Combined Adjusted EBITDA, Combined Adjusted EBITDAR and Combined Net Income for the quarterly period ended March 31, 2019 is useful for investors to evaluate the Company’s performance for
the quarterly period ended March 31, 2021. These results do not reflect any cost savings from potential operating efficiencies or associated costs to achieve such savings or synergies that are expected to result
from these transactions. The Company does not provide reconciliations of Combined Adjusted EBITDA and Combined Adjusted EBITDAR to net income (loss) on a forward-looking basis because the Company is unable to forecast the
amount or significance of certain items required to develop meaningful comparable GAAP financial measures without unreasonable efforts. These items include gains or losses on sale or consolidation transactions, accelerated
depreciation, impairment charges, gains or losses on retirement of debt, which are difficult to predict and estimate and are primarily dependent on future events, but which are excluded from the Company’s calculations
of Adjusted EBITDA and Adjusted EBITDAR.

In addition, this presentation includes estimated operating trends of the Company compared to the same periods in 2019 using monthly property level financials and internally generated daily operating reports.
These trends are based on management estimates only using currently available information, which has not been reviewed by the Company’s auditors, is not subject to the Company’s normal control procedures
and has not been prepared in accordance with GAAP. The Company does not prepare monthly or intra-month property level financials on the same basis as its reported GAAP results and, as a result, the trends
reported are based on information that may not be indicative of full quarter or full month results, respectively, for the Company’s operating segments.

                                                                                                                                                                                                                                 2
ibdroot\projects\IBD-NY\hadley2020\662888_1\Investor Presentation\Template (From PNG)\Project Fastbreak Investor
          Presentation (Part 1).pptx

   Forward-Looking Statements
This presentation contains “forward-looking statements” within the meaning of the Private Securities Litigation Reform Act of 1995. These statements can be identified by the use of forward-looking terminology such as “expects,” “believes,”
“estimates,” “projects,” “intends,” “plans,” “goal,” “seeks,” “may,” “will,” “should,” or “anticipates” or the negative or other variations of these or similar words, or by discussions of future events, strategies or risks and uncertainties. Specifically,
forward looking statements include, but are not limited to, statements regarding: COVID-19; continued demand for the gaming properties that have opened and the possibility that the Company’s gaming properties may be required to close
again in the future due to COVID-19; the impact of COVID-19 on general economic conditions, capital markets, unemployment, and the Company’s liquidity, operations, supply chain and personnel; the potential benefits and expected
timing of the Perryville transaction with Gaming and Leisure Properties, Inc.; the Company’s estimated cash burn and future liquidity, future revenue and Adjusted EBITDAR, including from the Company’s iCasino business in Pennsylvania and
Michigan; the continued success of Barstool Sports in Pennsylvania, Michigan, Illinois and in additional states in the future; the expected benefits and potential challenges of the investment in Barstool Sports, including the anticipated benefits
for the Company’s online and retail sports betting, iCasino and social casino products; the expected financial returns from the transaction with Barstool Sports; the expected launch of the Barstool-branded mobile sports betting product in
future states and its future revenue and profit contributions; the impact of shortened or cancelled sports seasons on the Company’s results; the Company’s expectations of future results of operations and financial condition, including margins;
the Company’s expectations for its properties, the Company’s development projects or its iGaming initiatives; the timing, cost and expected impact of planned capital expenditures on the Company’s results of operations; the Company’s
expectations with regard to the impact of competition; the anticipated opening dates of the Company’s retail sportsbooks in future states and its proposed Pennsylvania Category 4 casinos in York and Berks counties; the Company’s
expectations with regard to acquisitions, potential divestitures and development opportunities, as well as the integration of and synergies related to any companies we have acquired or may acquire; the outcome and financial impact of the
litigation in which the Company is or will be periodically involved; the actions of regulatory, legislative, executive or judicial decisions at the federal, state or local level with regard to the Company’s business and the impact of any such
actions; the Company’s ability to maintain regulatory approvals for the Company’s existing businesses and to receive regulatory approvals for its new business partners; the Company’s expectations with regard to the impact of competition in
online sports betting, iGaming and retail/mobile sportsbooks as well as the potential impact of this business line on its existing businesses; the performance of the Company’s partners in online sports betting, iGaming and retail/mobile
sportsbooks, including the risks associated with any new business, the actions of regulatory, legislative, executive or judicial decisions at the federal, state or local level with regard to online sports betting, iGaming and retail/mobile sportsbooks
and the impact of any such actions; and the Company’s expectations regarding economic and consumer conditions. Such statements are all subject to risks, uncertainties and changes in circumstances that could significantly affect the
Company’s future financial results and business.

Accordingly, the Company cautions that the forward-looking statements contained herein are qualified by important factors that could cause actual results to differ materially from those reflected by such statements. Such factors include, but
are not limited to: (a) the magnitude and duration of the impact of the COVID-19 pandemic on general economic conditions, capital markets, unemployment, consumer spending and the Company’s liquidity, financial condition, supply
chain, operations and personnel; (b) industry, market, economic, political, regulatory and health conditions; (c) disruptions in operations from data protection breaches, cyberattacks, extreme weather conditions, medical epidemics or
pandemics such as the COVID-19 (and reoccurrences), and other natural or man-made disasters or catastrophic events; (d) the Company’s ability to access additional capital on favorable terms or at all; (e) the Company’s ability to remain
in compliance with the financial covenants of its debt obligations; (f) the consummation of the Perryville transaction with GLPI is subject to various conditions, including third-party agreements and approvals, and accordingly may be delayed
or may not occur at all; (g) actions to reduce costs and improve efficiencies to mitigate losses as a result of the COVID-19 pandemic that could negatively impact guest loyalty and the Company’s ability to attract and retain employees; (h)
the outcome of any legal proceedings that may be instituted against the Company or its directors, officers or employees; (i) the impact of new or changes in current laws, regulations, rules or other industry standards; (j) the ability of the
Company’s operating teams to drive revenue and margins; (k) the impact of significant competition from other gaming and entertainment operations (including from Native American casinos, historic racing machines, state sponsored i-
lottery products and VGTs in or adjacent to states in which the Company’s operate); (l) the Company’s ability to obtain timely regulatory approvals required to own, develop and/or operate its properties, or other delays, approvals or
impediments to completing the Company’s planned acquisitions or projects, construction factors, including delays, and increased costs; (m) the passage of state, federal or local legislation (including referenda) that would expand, restrict,
further tax, prevent or negatively impact operations in or adjacent to the jurisdictions in which we do or seek to do business (such as a smoking ban at any of the Company’s properties or the award of additional gaming licenses proximate to
its properties, as recently occurred with legislation in Illinois and Pennsylvania); (n) the effects of local and national economic, credit, capital market, housing, and energy conditions on the economy in general and on the gaming and lodging
industries in particular; (o) the activities of the Company’s competitors (commercial and tribal) and the rapid emergence of new competitors (traditional, internet, social, sweepstakes based and VGTs in bars and truck stops); (p) increases in
the effective rate of taxation for any of the Company’s operations or at the corporate level; (q) the Company’s ability to identify attractive acquisition and development opportunities (especially in new business lines) and to agree to terms
with, and maintain good relationships with partners and municipalities for such transactions; (r) the costs and risks involved in the pursuit of such opportunities and the Company’s ability to complete the acquisition or development of, and
achieve the expected returns from, such opportunities; (s) the impact of weather, including flooding, hurricanes and tornadoes; (t) changes in accounting standards; (u) the risk of failing to maintain the integrity of the Company’s information
technology infrastructure and safeguard its business, employee and customer data (particularly as its iGaming division grows); (v) with respect to the Company’s iGaming and sports betting endeavors, the impact of significant competition
from other companies for online sports betting, iGaming and sportsbooks, the Company’s ability to achieve the expected financial returns related to its investment in Barstool Sports, the Company’s ability to obtain timely regulatory approvals
required to own, develop and/or operate sportsbooks may be delayed and there may be impediments and increased costs to launching the online betting, iGaming and sportsbooks, including delays, and increased costs, intellectual
property and legal and regulatory challenges, as well as the Company’s ability to successfully develop innovative products that attract and retain a significant number of players in order to grow its revenues and earnings, the Company’s
ability to establish key partnerships, the Company’s ability to generate meaningful returns and the risks inherent in any new business; (w) with respect to the Company’s proposed Pennsylvania Category 4 casinos in York and Berks counties,
risks relating to construction, and the Company’s ability to achieve its expected budgets, timelines and investment returns, including the ultimate location of other gaming properties in the Commonwealth of Pennsylvania; and (x) other
factors as discussed in the Company’s Annual Report on Form 10-K for the year ended December 31, 2020, subsequent Quarterly Reports on Form 10-Q and Current Reports on Form 8-K, each as filed with the U.S. Securities and Exchange
Commission. The Company does not intend to update publicly any forward-looking statements except as required by law. In light of these risks, uncertainties and assumptions, the forward-looking events discussed in this presentation may not
occur.

                                                                                                                                                                                                                                                             3
ibdroot\projects\IBD-NY\hadley2020\662888_1\Investor Presentation\Template (From PNG)\Project Fastbreak Investor
   Presentation (Part 1).pptx

First Quarter Financial Highlights
Despite COVID and weather-related challenges in 1Q 2021, we reported strong revenues and
record Adjusted EBITDAR. Spend per visit remains higher than pre-COVID periods while visitation
is approaching 2019 levels in most markets. Demographic trends also continue to improve
across all age groups.

  Revenues                                                                                    Net Income                                                                                      Adj. EBITDAR1
  ($ in millions)                                                                             ($ in millions)                                                                                 ($ in millions)
                                                                                                                                             $91
           $1,361                                                                                                                                                                                                                       $447
                                     $1,275                                                                                                                                                                      $418

                                                                                                               $51                      +78%                                                                                           +7%

                                       -6%

        1Q 2019                    1Q 2021                                                              1Q 2019                       1Q 2021                                                               1Q 2019                  1Q 2021
                                                                                                                                                                                                                          1   1Q 2021 Adjusted EBITDA was
                               Note: Q1 2019 Revenues, Net Income, Adjusted EBITDA, and Adjusted EBITDAR include proforma adjustments for Greektown and Resorts Casino Tunica. The operating results of
                               Greektown were derived from historical financial information. The operating results were adjusted to conform to Penn’s methodology of allocating certain corporate expenses to                 $337m compared to 1Q 2019
                               properties. Additionally, the operating results were adjusted to assume that Resorts Casino Tunica was not a part of Penn during the historical periods beginning on January 1, 2019, as       Adjusted EBITDA of $321m
                               Resorts ceased operations on June 30, 2019. Q1 2019 metrics are referred to as “Combined Revenues,” “Combined Net Income,” “Combined Adjusted EBITDA,” and “Combined Adjusted
                               EBITDAR.” 1Q 2021 includes $39.4 million of gross revenue from skin partners.                                                                                                                                             4
ibdroot\projects\IBD-NY\hadley2020\662888_1\Investor Presentation\Template (From PNG)\Project Fastbreak Investor
   Presentation (Part 1).pptx

March + April Operating Trends
Visitation and spend-per-visit across all tiers of our database and unrated play accelerated in
March and continued through April. This top-line demand coupled with the structural changes
we put in place at the start of the pandemic has resulted in remarkable and sustainable margin
improvement even as our interactive business continues to scale.

  Revenues                                                                                    Adj. EBITDAR                                                                                    Adj. EBITDAR Margin
  ($ in millions)                                                                             ($ in millions)
                                        $1,047                                                                                            $410                                                                                             39.2%
              $971
                                                                                                           $317
                                                                                                                                                                                                            32.7%
                                                                                                                                                                                                                                            +651
                                          +8%                                                                                            +29%                                                                                               bps

         Mar/Apr                     Mar/Apr                                                         Mar/Apr                         Mar/Apr                                                            Mar/Apr                         Mar/Apr
          2019                       2021E                                                            2019                            2021E                                                              2019                            2021E
                             Note: March/ April 2019 Revenues, Adjusted EBITDAR and Adjusted EBITDAR Margin include proforma adjustments for Greektown and Resorts Casino Tunica. The operating results of Greektown were derived from historical financial
                             information. The operating results were adjusted to conform to Penn’s methodology of allocating certain corporate expenses to properties. Additionally, the operating results were adjusted to assume that Resorts Casino Tunica was not a
                             part of Penn National during the historical periods beginning on January 1, 2019, as Resorts Casino Tunica ceased operations on June 30, 2019. March/April 2021 revenue estimate includes $30.8 million of gross revenue from skin partners.
                                                                                                                                                                                                                                                                            5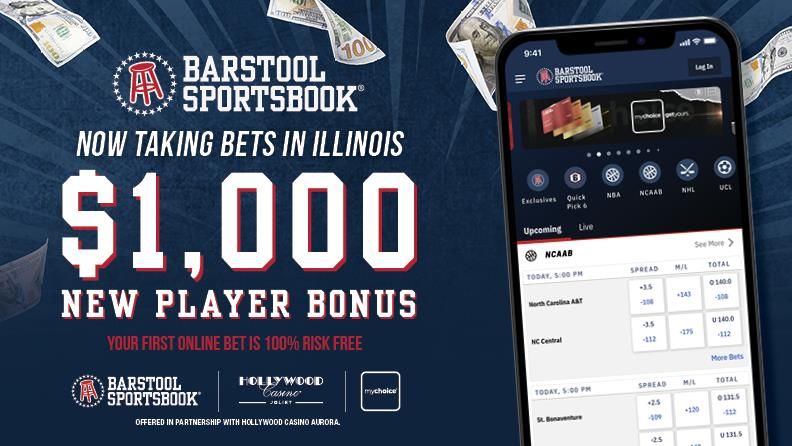
ibdroot\projects\IBD-NY\hadley2020\662888_1\Investor Presentation\Template (From PNG)\Project Fastbreak Investor
  Presentation (Part 1).pptx

Improved Balance Sheet and Liquidity
Our balance sheet and liquidity have improved significantly since pre-pandemic
periods, which positions us well to pursue a variety of long-term growth opportunities.
                                                                                                                                                   Lease-Adjusted
  Total Liquidity                                                                    Traditional Net Debt                                          Net Leverage
  ($ in millions)                                                                    ($ in millions)

                                                                                                                                                         5.4x
                                     $2,734                                                   $2,013
                                                                                                                                                                        4.5x
                                        $672

             $973
                                      $2,062
              $572                                                                                                    $353
              $401

          1Q 2019                   1Q 2021                                                 1Q 2019                  1Q 2021                           1Q 2019        1Q 20211
          Cash and Cash Equivalent            Revolver Available

                                                                                                                               1 Lease-Adjusted   Net Leverage based on 2019 Adj. EBITDAR
                                                                                                                                                                                            6
ibdroot\projects\IBD-NY\hadley2020\662888_1\Investor Presentation\Template (From PNG)\Project Fastbreak Investor
 Presentation (Part 1).pptx

Quarterly Trend By Age Group
The younger demographic continues to choose gaming as a viable entertainment option
while the 55+ age group has been returning to our casinos as vaccines continue to roll out.
In addition, strength in unrated play mirrors what we have seen from our rated guests.

                                  80%                                                  Year Over Year Theo Trends
                                  60%

                                  40%

                                  20%

                                    0%

                                 -20%

                                 -40%

                                 -60%
                                                    2Q 2020                        3Q 2020                          4Q 2020             1Q 2021        Apr '21
                                                                           55+             45 - 54             35 - 44        21 - 34        Unrated

                                                                                                                                                                 7
ibdroot\projects\IBD-NY\hadley2020\662888_1\Investor Presentation\Template (From PNG)\Project Fastbreak Investor
  Presentation (Part 1).pptx

The
PennSouth  Leading
     Interactive Wellthe Way
                      Positi oned for Growth
Revenue and EBITDAR growth in South Segment
accelerated as restrictions were reduced,
exceeding pre-Covid levels.

• Revenue at 103% of 2019 revenue*

• Adjusted EBITDAR at 137% of 2019 EBITDAR*

• Margin improvement of >1,100 bps for the region

• Restrictions on gaming position limits were relaxed in
  Q1, allowing increased capacity at slots and tables

• Alcohol sale restrictions were also relaxed in Q1,
  allowing enhanced F&B offerings during peak periods

 *Excludes Resorts Tunica, which closed in mid-2019

                                                                                                                     8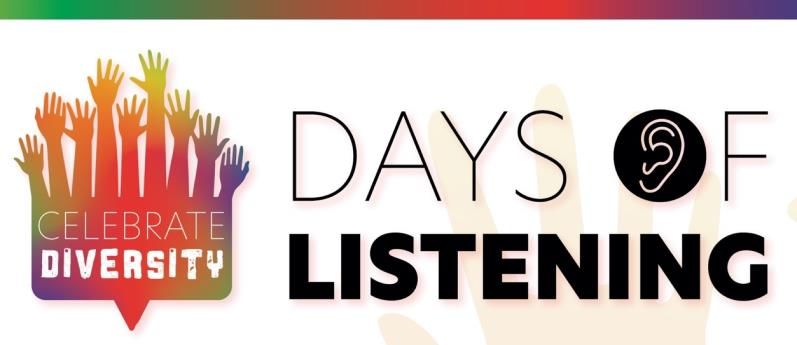
ibdroot\projects\IBD-NY\hadley2020\662888_1\Investor Presentation\Template (From PNG)\Project Fastbreak Investor
   Presentation (Part 1).pptx

Retail Sportsbook Drives Share - Greektown
The introduction of Barstool-branded retail sportsbooks has re-energized our properties and
introduced new customers into our ecosystem. We expect to have 10 Barstool-branded
sportsbooks by the end of 2021.

                                                                        Greektown Casino
                                                             Retail Sportsbook GGR Market Share (1)

                                                                                         Pre-                                   Post-
                                                                                       Branding                               Branding

                                                                                              23.6%                            37.0%

                                 (1) Pre-branding   market share as of 4Q 2020 and post-branding market share as of 1Q 2021
                                                                                                                                         9
ibdroot\projects\IBD-NY\hadley2020\662888_1\Investor Presentation\Template (From PNG)\Project Fastbreak Investor
 Presentation (Part 1).pptx

Retail Sportsbook Drives Share - Indiana
Our Indiana properties continue to gain meaningful casino revenue market
share as compared to 2019, demonstrating the power of our best-in-class,
Barstool-branded sportsbooks.

                  #1                                   +141 bps
                                                      Casino GGR Market Share**
                                                                                                                           #2                       +362 bps
                                                                                                                                                   Casino GGR Market Share**
    Sportsbook in Indiana*                                                                                          Sportsbook in Indiana*

                                * By revenue in 1Q 2021
                                **1Q 2021 vs. 1Q 2019                                                                                        Source: Indiana Gaming Commission
                                                                                                                                                                                 10
ibdroot\projects\IBD-NY\hadley2020\662888_1\Investor Presentation\Template (From PNG)\Project Fastbreak Investor
Presentation (Part 1).pptx
Investment in Technology
Penn Interactive Well Positi oned for Growth
We continue to invest in technology that
will increase efficiency while also
enhancing customer engagement,
including the mychoice loyalty app.
We have approximately 333K downloads
since launch with 183K downloads in Q1.
Contactless, cardless, cashless (3Cs)
technology should be introduced
beginning in late Q2 in Pennsylvania
(pending regulatory approval), which we
anticipate will be very well received,
particularly among younger customers.
11ibdroot\projects\IBD-NY\hadley2020\662888_1\Investor Presentation\Template (From PNG)\Project Fastbreak Investor
Presentation (Part 1).pptx
Successful Launch
Penn Interactive Wellin Illinois
Positi oned for Growth
On March 11, 2021, we successfully introduced our Barstool Sportsbook app to
Illinois. Barstool’s loyal audience in the state has led to high acceptance and our
strongest first-time deposit conversions yet.
Key Metrics through 4/9
(first 30 days of operation)
54.7k 38.9k
Registrations First Time Depositors
$6.5m 54%
Gross Gaming of customers bet on
Revenue Barstool exclusives
12ibdroot\projects\IBD-NY\hadley2020\662888_1\Investor Presentation\Template (From PNG)\Project Fastbreak Investor
Presentation (Part 1).pptx
“Last Chance” Registration
Penn Interactive in Illinois
Well Positi oned for Growth
Illinois re-instated in-person registration for mobile sports betting on April 4. With only 36 hours
notice, Penn and Barstool quickly launched a social media campaign to promote registrations
before the deadline. The results highlight the power of Barstool’s unique approach to marketing.
20K+ 13K+
Total first-time depositors
Total registrations on the
on the platform in 36
platform in 36 hours
hours
10K+ #1
Total users who opted App store ranking
into the promotion for 4 among sports betting
free $100 bets apps
13ibdroot\projects\IBD-NY\hadley2020\662888_1\Investor Presentation\Template (From PNG)\Project Fastbreak Investor
Presentation (Part 1).pptx
Strong Market Position
Penn Interactive Well Positi oned for Growth
Barstool’s creative promotions, exclusive bets and custom parlays have led to a
leading position based on handle, GGR and NGR market share, despite limited
external marketing spend. We expect our low customer acquisition cost, strong
retention rates and high adoption among casual bettors to drive outsized
profitability.
Market Share – Pennsylvania Market Share – Michigan
15.7% 30.1%
14.7%
18.0%
12.7% 13.8%
Handle GGR NGR Handle GGR NGR
Note: All data shown is launch-to-date through March 2021; Pennsylvania launch excludes September; Michigan net gaming revenue market share excludes peers with negative NGR
14ibdroot\projects\IBD-NY\hadley2020\662888_1\Investor Presentation\Template (From PNG)\Project Fastbreak Investor
Presentation (Part 1).pptx
iCasino Opportunity
Penn Interactive – 3rdoned
Well Positi PartyforContent
Growth
We are encouraged by the initial results of our Barstool iCasino in Michigan, which has
generated solid market share despite limited game selection or marketing spend.
Number of Games at Launch in Michigan*
315 70
We will be adding significantly more third-party casino
content to the app in the next few months, which will
help increase conversion of our mychoice database in
Michigan and Pennsylvania
*Michigan games data as per Eilers & Krejcik Gaming 15ibdroot\projects\IBD-NY\hadley2020\662888_1\Investor Presentation\Template (From PNG)\Project Fastbreak Investor
Presentation (Part 1).pptx
iCasino Opportunity
Penn Interactive – Content
Well Positi Studio
oned for Growth
We recently announced the creation of Penn Games Studio, an in-house content
studio anchored by our recently announced acquisition of HitPoint Studios.
Our in-house content studio will further
Over 50% of our maximize cross-sell through customized
sports betting Barstool-branded content
average
monthly users in
Michigan have
placed a bet
on iCasino
16ibdroot\projects\IBD-NY\hadley2020\662888_1\Investor Presentation\Template (From PNG)\Project Fastbreak Investor
Presentation (Part 1).pptx
Differentiated Omni-channel Approach
Our experience in Michigan has shown that a customer’s value increases
significantly when they play on multiple channels, which highlights the benefits
of our unique, 100% owned and controlled omni-channel strategy.
Incremental
Theo
17ibdroot\projects\IBD-NY\hadley2020\662888_1\Investor Presentation\Template (From PNG)\Project Fastbreak Investor
Presentation (Part 1).pptx
Caring for our People, Communities and Planet
• In March, we launched a new $1 million annual Diversity Scholarship program, extending up to 65 scholarships this
year to the children of our team members, which reflects our commitment to equity in post-secondary education
opportunities for students.
• From April 22-24, we held companywide “Days of Listening” to gather feedback from team members on all matters
of diversity and inclusion.
• We have integrated Historically Black Colleges and Universities and universities that promote diversity into our LEAP
program which provides hands-on-training, mentoring and real-world experience to new or recent college
graduates.
• On May 15, we will launch a new initiative to honor active-duty military, veterans and first responders. The
“myheroes” program will provide our nation’s heroes access to exclusive discounts and offers at Penn National’s 41
properties in 19 States.
• At our two newest casinos in Pennsylvania in York and Morgantown, which are scheduled to open later this year, we
have implemented new energy efficiencies, including: LED lighting; EV charging stations; water conserving toilets;
water bottle refilling stations; HVAC improvements to maximize efficiencies and AER-DEC® integrated sinks, which
are the future of sustainable restroom design.
WE THANK YOU
Honoring those who serve our community & country
Sign up for
myheroes at
PlayerServices
18ibdroot\projects\IBD-NY\hadley2020\662888_1\Investor Presentation\Template (From PNG)\Project Fastbreak Investor
Presentation (Part 1).pptx
Appendix
19ibdroot\projects\IBD-NY\hadley2020\662888_1\Investor Presentation\Template (From PNG)\Project Fastbreak Investor
Presentation (Part 1).pptx
GAAP to Non-GAAP Reconciliation
For the three months ended March 31,
($ in millions) 2021 2020 2019
Net income (loss) $90.9 ($608.6) $41.0
Income tax expense (benefit) 20.6 (99.5) 14.8
Income from unconsolidated affiliates (9.6) (4.1) (5.7)
Interest expense, net 135.7 129.8 132.3
Other (income) expense (21.1) 21.8 -
Operating income (loss) $216.5 ($560.6) $182.4
Stock-based compensation 4.2 6.0 3.4
Cash-settled stock-based awards variance 21.5 (8.9) 0.4
(Gain) loss on disposal of assets (0.1) 0.6 0.5
Contingent purchase price 0.1 (2.2) 4.7
Pre-opening and acquisition costs 1.6 3.2 4.4
Depreciation and amortization 81.3 95.7 104.1
Impairment losses - 616.1 -
Insurance recoveries, net of deductible charges - (0.1) -
Income from unconsolidated affiliates 9.6 4.1 5.7
Non-operating items of equity method investments (1) 1.6 0.9 1.1
Other expenses (2) 0.3 - -
Adjusted EBITDA (3) $336.6 $154.8 $306.7
Rent expense associated with triple net operating leases 110.4 97.5 84.7
Adjusted EBITDAR (3) $447.0 $252.3 $391.4
Net income (loss) margin 7.1% (54.5%) 3.2%
Adjusted EBITDAR margin 35.1% 22.6% 30.5%
(1) Consists principally of interest expense, net; income taxes; depreciation and amortization; and stock-based compensation expense associated with Barstool Sports and our Kansas Entertainment
joint venture. We record our portion of Barstool Sports’ net income or loss, including adjustments to arrive at Adjusted EBITDAR, one quarter in arrears. (2) Consists of non-recurring restructuring charges
(primarily severance) associated with a company-wide initiative, triggered by the COVID-19 pandemic, designed to (i) improve the operational effectiveness across our property portfolio; and (ii)
improve the effectiveness and efficiency of our Corporate functional support areas. (3) See “Non GAAP Financial Measures” section above for more information, including the definition of Adjusted
EBITDAR and Adjusted EBITDA. 20ibdroot\projects\IBD-NY\hadley2020\662888_1\Investor Presentation\Template (From PNG)\Project Fastbreak Investor
Presentation (Part 1).pptx
GAAP to Non-GAAP Reconciliation
Reconciliation of Comparable GAAP Financial Measure to Combined Adjusted EBITDA
and Combined Adjusted EBITDAR
For the three months ended
(in millions, unaudited) March 31, 2019
Net income $41.0
Income tax expense 14.8
Income from unconsolidated affiliates (5.7)
Interest expense, net 132.3
Operating income $182.4
Greektown Adjusted EBITDAR, pre-acquisition 14.2
Resorts Casino Tunica (0.2)
Stock-based compensation 3.4
Cash-settled stock-based awards variance 0.4
Loss on disposal of assets 0.5
Contingent purchase price 4.7
Pre-opening and acquisition costs 4.4
Depreciation and amortization 104.1
Income from unconsolidated affiliates 5.7
Non-operating items of joint ventures 1.1
Combined Adjusted EBITDA (1) $320.7
Rent expense associated with triple net operating leases 97.2
Combined Adjusted EBITDAR (1) $417.9
(1) See the “Non-GAAP Financial Measures” section above for more information, including the definition of Combined Adjusted EBITDA and Combined Adjusted EBITDAR.
21ibdroot\projects\IBD-NY\hadley2020\662888_1\Investor Presentation\Template (From PNG)\Project Fastbreak Investor
Presentation (Part 1).pptx
GAAP to Non-GAAP Reconciliation
Reconciliation of Comparable GAAP Financial Measure to Combined Revenues and
Combined Net Income
Penn National, as Greektown Pre-
(2) (3)
Reported Acquisition (1) Resorts Casino Tunica Combined
(in millions, unaudited) For the three months ended March 31, 2019
Revenues $1,282.6 $83.7 ($5.8) $1,360.5
Net Income $41.0 $10.4 - $51.4
(1) The operating results of Greektown were derived from historical financial information. In addition, the operating results were adjusted to conform to Penn National’s
methodology of allocating certain corporate expenses to properties. (2) The operating results were adjusted to assume that Resorts Casino Tunica was not a part of
Penn National during the historical periods beginning on January 1, 2019, as Resorts Casino Tunica ceased operations on June 30, 2019. (3) See “Non GAAP Financial
Measures” section above for more information, including the definition of Combined Revenues and Combined Net Income.
22You can also read