Investor Presentation - CALCULATED CONSOLIDATION
←
→
Page content transcription
If your browser does not render page correctly, please read the page content below

Investor Presentation
      CALCULATED CONSOLIDATION
              May 2022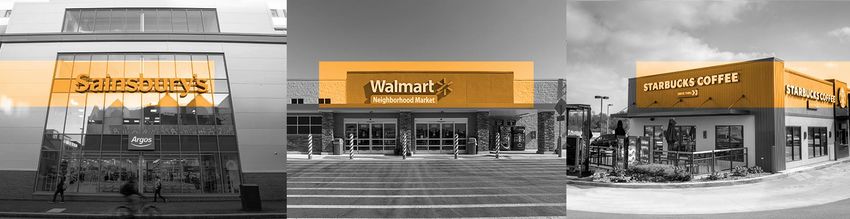
Safe Harbor For Forward-Looking Statements

This presentation contains forward-looking statements within the meaning of the Private Securities Litigation Reform Act of 1995, Section 27A of
the Securities Act of 1933, as amended, and Section 21E of the Exchange Act of 1934, as amended. When used in this presentation, the words
“estimated,” “anticipated,” “expect,” “believe,” “intend,” and similar expressions are intended to identify forward-looking statements. Forward-
looking statements also include discussions of future operations and results, strategy, plans, intentions of management, and the anticipated
consummation of pending transactions. Forward-looking statements are subject to risks, uncertainties, and assumptions about us, which may
cause our actual future results to differ materially from expected results. Some of the factors that could cause actual results to differ materially are,
among others, our continued qualification as a real estate investment trust; general domestic and foreign business and economic conditions;
competition; fluctuating interest and currency rates; access to debt and equity capital markets; continued volatility and uncertainty in the credit
markets and broader financial markets; other risks inherent in the real estate business including our clients' defaults under leases, potential liability
relating to environmental matters, illiquidity of real estate investments, and potential damages from natural disasters; impairments in the value of
our real estate assets; changes in income tax laws and rates; the continued evolution of the COVID-19 pandemic and the measures taken to limit its
spread, and its impacts on us, our business, our clients, or the economy generally; the timing and pace of reopening efforts at the local, state and
national level in response to the COVID-19 pandemic and developments, such as the unexpected surges in COVID-19 cases, that cause a delay in or
postponement of reopenings; the outcome of any legal proceedings to which we are a party or which may occur in the future; acts of terrorism and
war; any effects of uncertainties regarding whether the anticipated benefits or results of our merger with VEREIT, Inc. will be achieved; and those
additional risks and factors discussed in our reports filed with the U.S. Securities and Exchange Commission. Readers are cautioned not to place
undue reliance on forward-looking statements. Those forward-looking statements are not guarantees of future plans and performance and speak
only as of the date that this press release. Actual plans and operating results may differ materially from what is expressed or forecasted in this
press release. Realty Income does not undertake any obligation to publicly release the results of any revisions to these forward-looking statements
that may be made to reflect events or circumstances after the date these statements were made.
                                                                                                                                                            2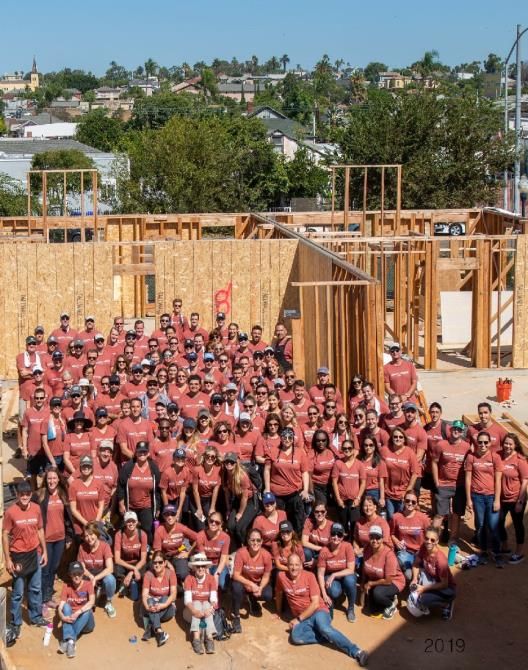
Who We Are

 To build enduring            PURPOSE   MISSION   We invest in people and
 relationships and                                places to deliver
 brighter financial futures                       dependable monthly
                                                  dividends that increase
                                                  over time

• Do the right thing                              To be a top 5 U.S. REIT,
• Take ownership                                  creating long-term value
• Empower each other                              for stakeholders across
                                                  the world
• Celebrate differences
                              VALUES     VISION
• Give more than we take

                                                                             3
Realty Income: A Path to Continued Long-Term Profitable Growth

                                      WHERE WE ARE:                                                                    WHERE WE ARE GOING:

         • S&P 500 company
                                                                                                              • To be a top 5 global REIT(1)
         • One of 65 companies in the elite
           S&P 500 Dividend Aristocrats® Index                                                                • To consolidate the ~$12 trillion
                                                                                                                global net lease addressable
         • Top 10 global REIT(1)
                                                                                                                market
         • 15.3% compound annual total
           shareholder return since public                                                                    • To average double-digit total
           listing in 1994                                                                                      shareholder return with minimal
                                                                                                                volatility
         • 4.4% compound annual dividend
           growth rate since 1994 and 115                                                                     • To continue treating the dividend
           dividend increases                                                                                   as sacrosanct to our mission
                                                                                                                                                    4
  (1)   As measured by equity market capitalization of FTSE EPRA Nareit Global REITs TR Index Constituents.
Key Takeaways

•   Realty Income’s track record illustrates superior total return per unit of volatility.

•   Our external growth opportunities are broad and unconstrained by property type or geography.

•   Realty Income’s strategic merger with VEREIT® created the premier net lease REIT with increased size and scale,
    supporting long-term growth through consolidation of a highly fragmented net lease industry.

•   With over 11,200 properties, our portfolio has reached a critical mass providing access to proprietary data and
    information that enables us to make data-driven, calculated investment decisions.

•   Our selective capital allocation philosophy supports superior financial and operational stability relative to REIT peers,
    particularly during economic downturns.

•   Our fortress balance sheet and access to a low-cost, diversified capital pool supports the curation of a best-in-class real estate
    portfolio generating growing cash flows guaranteed by large, national, blue-chip operators.

•   We aspire to be a sustainability leader in the net lease REIT sector and have set ambitious but attainable goals for
    environmental stewardship and social responsibility.

                                                                                                                                     5
Table of Contents
•   REALTY INCOME OVERVIEW AND INVESTMENT THESIS                                              7
                                                                                              5
•   PERFORMANCE TRACK RECORD                                                                 10
                                                                                              9
•   LEVERAGING SIZE AND SCALE TO DRIVE PROFITABLE GROWTH                                     16
                                                                                             15
•   PRUDENT CAPITAL ALLOCATION FRAMEWORK                                                     25
                                                                                             24
•   FORTRESS BALANCE SHEET                                                                   34
                                                                                             31
•   DIVERSIFIED HIGH-QUALITY REAL ESTATE PORTFOLIO                                           37
                                                                                             34
•   GROWING INTERNATIONAL PORTFOLIO                                                          46
                                                                                             43
•   ESG OVERVIEW                                                                             49
                                                                                             47
•   APPENDIX                                                                                 53
                                                                                             48
                                                                                                  6
                                  All data as of March 31, 2022 unless otherwise specified
Investment Thesis

                                    PROVEN TRACK RECORD                                                                                                             STABILITY AND GROWTH
                                        OF RETURNS...                                                                                                                   OF EARNINGS...

                         15.3%                                                                    0.5                                                     25 of 26                         5.1%
           Compound Annual Total                                                    Beta vs. S&P 500                                                 Years of Positive Earnings       Median AFFO Per Share
        Return Since ‘94 NYSE Listing                                            Since ‘94 NYSE Listing(1)                                              Per Share(2) Growth            Growth Since 1996

                                        CONSISTENTLY                                                                                                                    POSITIONED FOR
                                    INCREASING DIVIDENDS...                                                                                                           CONTINUED GROWTH...

                                                                            S&P 500 Dividend
                            4.4%                                              Aristocrats®                                                             $12 Trillion                   $84 Billion
           Compound Annual Dividend                                                       Index Member                                              Estimated Addressable Market       Sourced Acquisition
            Growth Rate Since 1994                                                                                                                 Opportunity in the US and Europe   Opportunities in 2021
  Beta measured using monthly frequency.
(1)

  Measured as AFFO per share growth | Excludes positive earnings from Crest Net Lease, a subsidiary of Realty Income, as earnings do not reflect
(2)

recurring business operations.                                                                                                                                                                                7
Note: The area chart reflects Realty Income’s total shareholder return since 10/18/1994
Realty Income is the Global Leader in a Highly Fragmented Net Lease Sector

                                    SIZE, SCALE AND QUALITY                                                                                                                                GROWING INTERNATIONAL PRESENCE

       ~$57B                                            $3.0B                                            A3 /A-                                          5th largest global REIT(2)
       enterprise                                         annualized                                  credit ratings by                                  $5.1B European Portfolio
         value                                             base rent                                  Moody’s & S&P                                      194 assets
                                                                                                                                                         10+ years remaining lease term(3)
          53+                                         11,288                                               ~43%                                          20+ industries
    years of                                      commercial real                               of rent from investment
operating history                                 estate properties                                  grade clients(1)                                    (2)   As measured by equity market capitalization of FTSE EPRA Nareit Global REITs TR Index Constituents. As of 4/27/2022.
                                                                                                                                                         (3)   As of March 31, 2022.

                     DIVERSIFIED REAL ESTATE PORTFOLIO                                                                                                                                       STRONG DIVIDEND TRACK RECORD(4)
                                                                                                                                                                                                                                                                                             $2.964
       ~1,090                                                                                                                                                                                   27 Consecutive Years of Rising Dividends
                                          Other                              6%
            clients
                                                                                                                           ~94%                          622 monthly dividends declared
                                                                                                                                                         98 consecutive quarterly increases
              70                         Non-retail             16%                                                      of total rent is
                                                                                                                             resilient to
                                                                                                                                                         S&P 500 Dividend Aristocrats® index member
          industries                                                                        78%                               economic
                                                                                                                      downturns and/or
                                                          Non-discretionary, Low Price Point                                                                     $0.90                                                                     +4.4% CAGR
             50                                              and/or Service-oriented Retail                               isolated from
                                                                                                                           e-commerce
U.S. states, Puerto Rico,                                                                                                     pressures
  Spain and the U.K.                                                                                                                                             1995           1998           2001         2004           2007          2010          2013           2016            2019    2022    8
   Clients and clients that are subsidiaries or affiliates of companies with a credit rating of Baa3/BBB- or higher from one of the three major rating
 (1)

 agencies (Moody’s/S&P/Fitch).
                                                                                                                                                          (4)   As of April 2022 dividend declaration.
Rising Short-Term Yields Have Historically Been Correlated with Realty Income Outperformance
In 2015, the Fed began raising its benchmark interest rate, which continued through 2018(1)
TOTAL RETURNS: TOTAL RETURNS:
YEAR 1 OF FED RATE HIKE CYCLE TOTAL RETURN 3-YEAR DURATION OF FED RATE HIKE CYCLE
PERFORMANCE
13.1% 13.0% During the Fed’s prior rate
hike cycle, Realty Income 44.4%
outperformed the S&P 500
7.7% 30.6%
and the MSCI US REIT
Index (RMZ) over the 3- 13.0%
year duration of the rate
hike cycle
RMZ RMZ
COMPARATIVE CORRELATION:
TOTAL RETURN VS. 2-YEAR UST YIELD SINCE 2009 +0.25 +0.35 +0.39
Historically, Realty Income’s returns have been
RMZ
positively correlated to short-term yields
9
(1) During the prior rate hike cycle, the Fed initiated its initial rate hike in December 2015 (0.25% - 0.50%) with its final hike occurring in December 2018 (2.25% - 2.50%)Performance Track
Record
Superior risk-adjusted returns,
particularly during economic
downturns
10Attractive Risk/Reward vs. S&P 500 Historically, Realty Income delivered more
Companies and Blue-Chip REITs return per unit of risk vs. majority of S&P 500
companies and S&P 500 REITs(2)
S&P 500 Members S&P 500 REIT Peers
30%
20%
Realty Income return per
unit of market risk is in ESS PSA
the 95th percentile of
all S&P 500
companies(1) AVB
15% MAA
Return: 15.3%
20% Beta: 0.5 SPG EQR FRT
DRE WELL
UDR
KIM
TOTAL RETURN CAGR SINCE 1994
TOTAL RETURN CAGR SINCE 1994
REG VTR PEAK
10%
VNO
WY
10%
HST
5%
0%
0%
-10% -5%
2.0 1.5 1.0 0.5 0.0 1.4 1.2 1.0 0.8 0.6 0.4
Source: Bloomberg BETA BETA
(1) n=256 | As of 3/31/2022 | Excludes companies without trading histories dating to 1994 | Beta measured using monthly frequency.
(2) Excludes REITs without trading histories dating to 1994. 11Stable Earnings and Low Dividend Volatility Supports Low Share Price Volatility
ANNUAL TOTAL SHAREHOLDER RETURN AMONG S&P 500 COMPANIES:
Downside Volatility Since 1994(1)
25%
Realty Income is among bellwether names, such as JNJ, CHD, AZO, ROST, SO
distinguished by their earnings predictability, cash flow durability, and balance sheet quality.
20%
15%
Realty Income’s TSR Downside Volatility since
1994 NYSE Listing is 3.5%, the sixth-lowest of
all S&P 500 constituents(2)
10%
5%
0%
1st Decile 2nd Decile 3rd Decile 4th Decile 5th Decile 6th Decile 7th Decile 8th Decile 9th Decile 10th Decile
S&P 500 DECILES
Source: Bloomberg
(1) “Downside volatility” calculated as the standard deviation of annual total shareholder returns where positive values are assigned “0” value.
(2) n=257 S&P 500 constituents with trading histories dating to Realty Income’s 1994 NYSE listing as of 12/31/21.
12Superior Stability vs S&P 500 REITs:
Favorable Occupancy, Dividend Growth, Credit Rating and Total Return
PORTFOLIO OCCUPANCY DIVIDEND GROWTH(1)
98.4% 11%
96.6%
94.1%
91.0%
4.4%(2)
2.9%
0%
% of Years w/ Negative Growth Dividend CAGR
Historical Median Lowest Year-End
REALTY INCOME
S&P 500 REIT
AVG. CREDIT RATING (S&P/MOODY’S) Median # OF YEARS WITH TSR < -10%(1)
A / A2 9
8
A- / A3 7
6
BBB+ / Baa1 5
4
BBB / Baa2 3
2
1
BBB- / Baa3
0
Source: SNL, Bloomberg | Excludes specialty REITs (i.e., infrastructure, timber, information services).
(1) Since 1995. Excludes REITs with fewer years of history than Realty Income.
(2) As of April 2022 dividend declaration.
13Superior Stability vs. Peers: Consistent
Growth Maintained Through Pandemic 2020 EARNINGS PER SHARE
Growth(1)
Net Lease S&P 500 Retail REIT
Peers REIT Peers Peers
2.1%
0%
+3.1%
2020 Dividend Growth
-5%
-10%
-5.2%
-6.8%
-13.1%
-15%
1 of 8 Net Lease REITs(2)
1 of 15 S&P 500 REITs(3) -20%
1 of 7 Retail REITs(4) 1 of 4 Net Lease REITs(2) WITH
POSITIVE
1 of 7 S&P 500 REITs(3)
EARNINGS
1 of 4 Retail REITs(4) GROWTH IN 2020
THAT INCREASED
DIVIDEND IN 2020
(1) Measured as median AFFO/sh growth rate for net lease peers and median FFO/sh growth rates for S&P 500 and retail REIT peers.
(2) Net lease peers include ADC, EPRT, FCPT, GTY, NNN, SRC, STOR, VER, WPC.
(3) Includes 22 S&P 500 constituents, excluding non-property REITs, such as AMT, CCI, EQIX, IRM, SBAC, WY.
(4) 25 total Retail REITs including shopping center and mall REITs, and ADC, EPRT, FCPT, GTY, NNN, O, SRC, STOR, VER.
14Realty Income Exhibited the Lowest Operational and Financial Volatility
During Great Recession vs. A-Rated S&P 500 REITs
2007 – 2009 relative rankings
RENTAL GROSS EBITDA DEBT/ UNSECURED/ OCCUPANCY
RANK EBITDA(1)
REVENUE(1) MARGIN(1) MARGIN(1) EBITDA(2) TOTAL DEBT(2) RATE(1)
1
Realty Income
LESS VOLATILE
2
REITs that
3 currently have at
least two A-/A3
credit ratings or
better
4
MORE VOLATILE
5
6
7
Source: SNL
(1) Downside Volatility calculated as the standard deviation around zero of quarterly percentage changes in each metric shown, where positive changes are replaced with zero.
(2) Upside Volatility calculated as the standard deviation around zero of quarterly percentage changes, where negative changes are replaced with zero.
(3) Company did not report consolidated quarterly portfolio occupancy during 2007-2009.
15Leveraging Size
and Scale to Drive
Profitable Growth
The net lease opportunity set
is broad and unconstrained.
16Size and Scale
as a Competitive
CALCULATED
CONSOLIDATION 3
Advantage Take advantage of attractive
consolidation opportunities in
the extremely fragmented net
Inherent advantages of size and lease space
scale drive…
DISCIPLINED
CREATIVITY 2
Selectively pursue large-scale sale-leaseback
or portfolio transaction opportunities without
creating financing contingencies or
concentration risks
1 OPTIMIZED
PORTFOLIO PROFITABILITY
Leverage our 53+ year history and trove of
portfolio data to capitalize on unique insights
driven by predictive analytics
17Global Net Lease Investable Universe is Immense
Quantum of opportunity and low market Europe is an attractive growth
saturation affords ample runway for growth avenue with limited direct competition
AGGREGATE NET LEASE PUBLIC NET LEASE
Market EUROPE Peers
UNITED STATES
EUROPE
Combined enterprise
value of public net lease
REITs of ~$7 billion
~$8 T 13
peers
~$4 T UNITED STATES
~$160 B(1)
EUROPE
~$7 B Public net lease REITs
UNITED STATES account for ~4% of total
Public net addressable universe
Combined enterprise lease REITs account
value of public net lease for < 1% of total
REITs of ~$160 billion(1) addressable universe 3
peers
To achieve similar market saturation, Realty Income’s enterprise value in
Europe would approximate ~$115B, or ~22X the current portfolio size 18
(1) Represents “traditional” net lease peers, excluding gaming REITs.Realty Income’s External Growth Opportunities International opportunities added >30% to Realty
Income’s combined sourcing volume in 2019-2021
are Broad and Unconstrained SOURCED VOLUME
$84
in $ billions
INTERNATIONAL $64
UNITED STATES $57
$39 $34
$32 $28 $30 $32
$24
$13 $17
$6
2010 2011 2012 2013 2014 2015 2016 2017 2018 2019 2020 2021 YTD 2022
ACQUISITION VOLUME $6.4
in $ billions
International Expansion $3.7
Has Accelerated Sourcing $1.8
$2.3
$1.5(1) $1.4 $1.9 $1.5 $1.6
Volume Over the Last 3 $0.7 $1.0 $1.2 $1.3
Years…
2010 2011 2012 2013 2014 2015 2016 2017 2018 2019 2020 2021 YTD 2022
SELECTIVITY
Which Resulted in 12% percentage of annual sourced volume acquired
Increased Selectivity
8% 8%
7% 7% 7%
6% 6%
5% 5%
4% 4% 4%
2010 2011 2012 2013 2014 2015 2016 2017 2018 2019 2020 2021 YTD 2022
19
(1) Excluding $3.2 billion ARCT transaction.ANNUAL AFFO/sh(3)
Earnings Growth 20%
Growth
Large portfolio transactions
create upside “lumpiness”…
Remains Strong
17.0%
15%
As Size of Portfolio 10%
Continues to Increase 5%
0%
1996 1997 1998 1999 2000 2001 2002 2003 2004 2005 2006 2007 2008 2009 2010 2011 2012 2013 2014 2015 2016 2017 2018 2019 2020 2021
-5%
AFFO/SH GROWTH: …which supports outsized
AFFO/sh CAGR blended growth over time
5.1% HISTORICAL
MEDIAN 6%
5%
Benchmarked to 1995
5.1% 5.2% 5.3% 5.3% 5.3% 5.3% 5.2% 5.1% 5.1%
• Stronger historical growth rate vs. REITs (4.0%)(1) 4%
• Positive earnings growth in 25 of 26 years 3%
2%
• Modest annual downside volatility of 2.8%(2)
1%
0%
5.1% CAGR 1996 1997 1998 1999 2000 2001 2002 2003 2004 2005 2006 2007 2008 2009 2010 2011 2012 2013 2014 2015 2016 2017 2018 2019 2020 2021
SINCE 1995
• Proven track record of maintaining 5%+ GROSS RE ASSET VALUE
earnings CAGR since listing regardless of size (GREAV)(4)
$40,000 $35,909
• In 2012, portfolio GREAV was < $6B and
earnings CAGR was 4.5% $30,000
• Earnings growth has accelerated as portfolio $20,000
real estate value crossed $10B:
$10,000
$565
$0
• 6.4% AFFO/sh CAGR since 2012 1996 1997 1998 1999 2000 2001 2002 2003 2004 2005 2006 2007 2008 2009 2010 2011 2012 2013 2014 2015 2016 2017 2018 2019 2020 2021
(1) Median FFO | Represents all REITs currently included in MSCI REIT Index with earnings history since 2000 | Source: SNL.
(2) Volatility of earnings growth, where accelerating year-over-year growth is replaced with “0”. 20
(3) Excludes positive earnings from Crest Net Lease, a subsidiary of Realty Income, as earnings do not reflect recurring business operations.
(4) Gross real estate asset value reflects historical year end real estate held for investment, at cost (in millions)Filling the Void as a Premier
Sale-Leaseback Financing Partner
THE OPPORTUNITY MOMENTUM
Aggregate Corporate-Owned Realty Income is Well-Positioned to Continue to Execute
Real Estate(1) on Large-Scale Sale-Leaseback Transactions
AGGREGATE ACQUISITIONS VOLUME
~$1.5 TRILLION
2015 – Q1 2022
~ 40%
of total
acquisitions
~$500 $20 B
volume since
2015
BILLION
Blue-chip, best-in-class operators represent $8 B
Realty Income’s target market and account
for ~75% of real estate owned by public
companies TOTAL ACQUISITIONS SLB VOLUME
Source: Bloomberg
VOLUME
(1) Represents real estate owned by publicly traded companies. Calculated as the sum of gross book values of land, buildings, improvements and 21
construction-in-progress. Excludes energy, financial and real estate industries.Crystallizing Value Creation: SLB transactions: Inherently a deleveraging
and value-enhancing exercise for
Illustrative Sale-Leaseback Scenarios shareholders of corporate sellers
$500 MILLION SALE-LEASEBACK TRANSACTION AT 6.0% CAP RATE
$30 MILLION ANNUAL LEASE PAYMENT
CORPORATE SELLER USES PROCEEDS TO DE-LEVER BALANCE CORPORATE SELLER USES PROCEEDS FOR SHARE
SHEET… BUYBACK…
$ IN MILLIONS PRE-SLB ADJUSTMENTS POST-SLB $ IN MILLIONS PRE-SLB ADJUSTMENTS POST-SLB
Real Estate $500 ($500) $0 Real Estate $500 ($500) $0
Total Debt $3,100 ($500) $2,600 Total Debt $3,100 $3,100
Rent $0 $30 $30 Common Equity $6,000 ($500) +$140 $5,640
Total Lease Adj. Debt(1) $3,100 ($500) + $225 $2,825 Shares Outstanding 100 ($500/$60) 91.7
EBITDA $800 ($30) $770 Price/Share $60 $61.5
Total Debt / EBITDA 3.9x 3.4x Earnings $500 ($30) $470
Lease Adj. Debt / EBITDAR 3.9x 3.5x EPS $5.00 $5.13
P/E 12.0x 12.0x
22
(1) Assuming rating agency rent capitalization at 7.5x. Note: Assuming constant P/E | Corporate seller uses $500 million of SLB proceeds to buy back 8.3 million shares at $60/sh.Net Lease Investment Opportunity Set
is Not Constrained by Property Type
Diageo Transaction in 2010: Template for Creative Sale-Leaseback Opportunities
QUANTIFYING VALUE OF THE
REALTY INCOME DIAGEO PORTFOLIO INVESTMENT GRADE CREDIT
INVESTMENT CRITERIA ATTRIBUTES In 2016-2017, Diageo paid $75 mm for a
Triple Net, Sale-Leaseback release of the guarantee, reducing Realty
Triple Net Lease Transaction Income’s cost basis by ~25% and resulting in
LEASE a 10% adjusted cap rate. Treasury Wine Estates,
20-year term with extension options which has lower corporate leverage but no
Long Lease Term for up to 60 years public debt outstanding, assumed the
corporate guarantee.
Single-Client
17 Vineyards leased to Diageo
Commercial Property
REAL ESTATE
Strategic Location Napa Valley
Investment Grade Rated A- / A3 /A-
Low leverage, strong coverage ratios,
Strong Financial Position and solid free cash flow generation
CLIENT
Diageo is a leading global premium
drink company (brands include
Industry Leader Smirnoff, Baileys, Don Julio,
Tanqueray and Guinness) 23Efficiency of the Net Lease Business Lease structure and growth drivers support a
more predictable revenue stream relative to
Model Supports Cash Flow Stability other forms of retail real estate
UNIQUE “NET LEASE” STRUCTURE DRIVES LOWER CASH FLOW VOLATILITY REALTY INCOME SHOPPING CENTERS AND MALLS
Initial Length of Lease 15+ Years < 10 Years
Remaining Average Term ~ 9 Years ~ 5-7 Years
Responsibility for Property Expenses Client Landlord
Gross Margin > 98% ~ 75%
Volatility of Rental Revenue Low Modest / High
Maintenance Capital Expenditures Low Modest / High
Reliance on Anchor Tenant(s) None High
Average Retail Property Size / Fungibility 12k sf / High 150k–850k sf / Low
AMPLE EXTERNAL GROWTH OPPORTUNITIES REALTY INCOME SHOPPING CENTERS AND MALLS
Target Markets Many Few
External Acquisition Opportunities High Low
Institutional Buyer Competition Modest High
External acquisitions drive 24
~2/3 of total earnings growthPrudent Capital
Allocation
Building a high-quality real
estate portfolio through
prudent, top-down, data-driven
investment process.
25Curating Best-in-Class Portfolio Through Thoughtful Investment
Process Supported by Proprietary Data From Over 11,200 Properties
RESEARCH AND REVIEW OF REAL ANALYSIS OF CLIENT INVESTMENT COMMITTEE SELECTIVITY: < 5%
STRATEGY ESTATE FUNDAMENTALS FINANCIAL STRENGTH DISCUSSION AND DECISION
$34 BILLION
YTD 2022 SOURCED
OPPORTUNITIES
$1.6BILLION
YTD 2022
ACQUISITIONS
VOLUME
Strategic Objectives: Considerations Include: Key Insights: Discussion Points:
• Identify “Mega Trends” • Market & Location • Long-Term Industry • Fit in Portfolio and
Trends Company Strategy
• Research Geographies, • Surrounding Demographics
Industries and • Competitive Landscape • Consideration of Overall
Prospective Clients • Traffic Counts, Access & Opportunity
Signage • Corporate Financial
• “Big Data” Analysis of Profile • Pricing and Other Deal
New and Existing • Rent Relative to Market Terms
Industries • Client’s Long-Term
• Price vs Replacement Cost Growth Strategy • Investment Spreads and
• Construct Optimal • Lease Term & Rent Escalators Long-Term IRR vs Long-
Portfolio • Store-Level Term WACC
• Alternative Use and Fungibility Performance 26
• IRR Scenario Analysis • ESG MetricsInvestment Strategy: Returns Must Exceed Long-Term WACC
WACC viewpoint balances near-term earnings per share growth with long-term value accretion
KEY ASSUMPTIONS & CALCULATION:
LONG-TERM LONG-TERM COST OF EQUITY
Weighted Average Cost of Capital Beta vs. S&P 500 (since S&P 500 Index Inclusion on 4/6/15) 0.83
• Drives investment decision- Long-term 10-year U.S. yield (Fitted Instantaneous Forward Rate) 3.4%
making at the property level
Equity market risk premium (S&P 500 Earnings Yield vs 10Y UST) 3.0% KEY ASSUMPTIONS & CALCULATION:
• Considers required “growth”
Long-Term Cost of Equity (CAPM methodology) 5.9% LONG-TERM WACC
component of equity returns 65% Weight: Long-Term Cost of Equity 7.0%
Dividend yield 4.1%
• Long-term WACC is the hurdle rate 35% Weight: Cost of Debt (unsecured, 10Y, fixed) 3.6%
for acquisitions Assumed long-term dividend growth rate 4.0% Long-Term WACC 5.8%
• Focus on higher long-term Long-Term Cost of Equity (Yield + Growth methodology) 8.1%
IRR discourages risk-taking
Long-Term Cost of Equity (Average of two methodologies) 7.0%
SHORT-TERM
“Nominal 1st-Year Weighted KEY ASSUMPTIONS & CALCULATION:
Average Cost of Capital NOMINAL 1ST-YEAR WACC
• Used to measure initial
(year one) earnings accretion 60% Equity: AFFO Yield 5.5%
• Higher stock price (lower cost)
32% Debt: unsecured, 10-year, fixed 3.6% LOW NOMINAL WACC LONG-TERM WACC
supports faster growth
supports ability to spread considers growth requirements
• Spread on short-term WACC 8% Retained Free Cash Flow 0% invest in high-quality real of equity and supports focus on
required to generate accretion estate opportunities residual value of acquisitions
Nominal 1st-Year WACC 4.5%
• Unwilling to sacrifice quality to
generate wider spreads
Note: Cost of capital information uses illustrative assumptions only (as of 4/28/2022). AFFO yield is based on the NTM AFFO/sh consensus. Cost of debt is based on a mix of USD-denominated, GBP-denominated , and EUR-denominated debt. 27Philosophical Capital Allocation Mindset:
Utilizing Low Cost of Capital to Assemble Highest-Quality Portfolio in Marketplace
Net lease peers with higher cost of capital
than Realty Income cannot “afford”
8.0% to pursue higher-quality opportunities
“HIGH YIELD” INVESTMENT
CHARACTERISTICS
(HIGHER CAP RATES):
7.5%
ACQUISITION CAP RATE TO ACHIEVE 150 BPS SPREAD
• Above-market rents / financially-engineered cap rates
• Poor credit or limited credit availability and track record
Higher cost of capital
• Thin industry-specific rent coverage forces companies to invest
• Poor real estate (low residual value) in riskier investment
7.0% • Short lease terms
• Volatile industries opportunities to derive
• Lower long-term IRR 150 bps of spread
6.5%
“HIGH QUALITY” INVESTMENT
6.0%
CHARACTERISTICS
(LOWER CAP RATES):
• At- or below-market rents
• Strong credit / proven sponsors & clients
• Above-average rent coverage
5.5% Lower cost of capital allows • Flexible alternative use
Realty Income to invest in • Long lease terms
• Stable industries
higher quality opportunities
• Higher long-term IRR
to derive the same spread
5.0%
3.50% 3.75% 4.00% 4.25% 4.50% 4.75% 5.00% 5.25% 5.50% 5.75% 6.00% 6.25%
NOMINAL 1ST-YEAR WACC
28
Note: Cost of capital information uses illustrative assumptions only.Investment Spreads Tend to Persevere Even as Interest Rates Rise
RISING INTEREST RATES DO NOT POSE SIGNIFICANT EARNINGS
HEADWIND TO THE NET LEASE BUSINESS MODEL
12%
5
Acquisition Cap Rate
10% Average 10Y UST Yield (12M Lag)
8%
9
It takes ~12 months for cap rates to adjust to
6% changing interest rates…
15
4%
2%
R2=0.9 24
0%
1996 1997 1998 1999 2000 2001 2002 2003 2004 2005 2006 2007 2008 2009 2010 2011 2012 2013 2014 2015 2016 2017 2018 2019 2020 2021 YTD
2022 31
RECESSIONARY ENVIRONMENT PRESENTS
ATTRACTIVE ACQUISITIONS OPPORTUNITIES Measured as acquisition cap rate spread over
average 10-year Treasury during a given year 34
600 bps
indicates recession years
400 bps
43
200 bps
47
0 bps 48
1996 1997 1998 1999 2000 2001 2002 2003 2004 2005 2006 2007 2008 2009 2010 2011 2012 2013 2014 2015 2016 2017 2018 2019 2020 2021 YTD 29
2022Benefits of Size and Scale
Capacity to Buy in Bulk at “Wholesale” Prices While
Maintaining Diversification
LARGER SIZE PROVIDES GROWTH OPTIONALITY SCALE AND SIZE BENEFITS ILLUSTRATED
TRANSACTION SIZE & IMPACT(1)
TO RENT CONCENTRATION
$1.2B
portfolio transaction CIM Transaction (Dec 2019)
TOTAL at ~7% cap rate
ABR
$100 $200 $300 $400 $500 $1,000 • Realty Income estimates cap rate represented a
portfolio discount relative to sum-of-the-parts valuation
$200 3% 5% 8% 10% 12% 22% 444 • Top 3 client concentration – Dollar General, Walgreens,
single-client Dollar Tree / Family Dollar
$400 1% 3% 4% 5% 6% 12%
properties
$600 1% 2% 3% 4% 4% 8%
Peers with smaller
denominators lack • Negligible impact to key portfolio concentrations:
ability to buy in bulk
$800 1% 1% 2% 3% 3% 6%
without incurring
material
diversification risk
~9.5Y Dollar General 3.8% 4.4%
WALT Dollar Tree / Family Dollar 3.1% 3.5%
$1,000 1% 1% 2% 2% 3% 5%
Walgreens 5.7% 6.1%
$2,000Benefits of Size and Scale: Greater
EBITDA Flow-Through to Bottom Line Portfolio growth resulted in improved operating margins,
which compare favorably vs. industry peers
Operating efficiencies continue to scale as Realty Income grows G&A as %
rental revenue(1)
5.8%
4.3%
NET LEASE S&P 500 REIT
2000 2002 2004 2006 2008 2010 2012 2014 2016 2018 2020 YTD
YTD as of PEER PEER 2022
3/31/2022 MEDIAN(2) MEDIAN(3)
G&A AS % OF ADJUSTED EBITDAre
RENTAL 4.3% 8.7% 9.2% MARGIN 95.1%
REVENUE 92.4%
ADJUSTED
EBITDAre 95.1% 87.5% 88.9% 2000 2002 2004 2006 2008 2010 2012 2014 2016 2018 2020 YTD
MARGIN 2022
G&A AS % G&A as %
OF GREAV
30 bps 74 bps 60 bps gross RE asset value (bps)(1)
64 bps
30 bps
Source: Bloomberg
(1) 2018 G&A excludes $18.7 million severance to former CEO paid in 4Q18 | 2020 G&A excludes $3.5 million severance to former CFO paid in 1Q20. 2000 2002 2004 2006 2008 2010 2012 2014 2016 2018 2020 YTD
Percentage of rental revenue calculation excludes reimbursements. 2022
(2) Based on trailing twelve months. Net Lease peers include ADC, BNL, EPR, EPRT, FCPT, GTY, LXP, NNN, NTST, SRC, STAG, STOR, WPC.
(3) Based on trailing twelve months. Excludes non-property REITs: AMT, CCI, EQIX, IRM, SBAC, WY.
31Recent Acquisitions Demonstrate Bias Towards Quality
UNITED STATES EUROPE
Property Type: Class A Industrial Property Type: Retail
Size: approx. 2mm SF Transaction Type: Strategic sale-leaseback with Carrefour in Spain
Year Built: 2020 – 2021 Purchase Price: approx. €93mm
Strategic Location: DFW (Texas) / $37B+ in annual economic impact Location: Canary Islands, Valencia, Madrid, Basque Country, Navarra,
and Castile and León
Client Industry: Warehousing / Distribution / E-commerce
Lease Term: approx. 10 years
Lease Term: approx. 11 years
Contractual Rent Escalators: annual inflation-linked increases
Contractual Rent Escalators: annual fixed increases of 2.0%+
Client Profile: Carrefour is the second-largest grocer in Spain and the
Key Real Estate Attributes: 15-minute drive population of ~650k, eighth-largest retailer in the world with ~€70 billion in annual revenue
healthy direct vacancy rate of ~5%, annual net absorption of over
20mm sq. ft. for the fifth consecutive year Investment Grade Credit: ‘BBB’ / ‘Baa1’ by S&P and Moody’s
“Green” Attributes: LED lighting, ESFR sprinkler system, TPO roofing, Key Real Estate Attributes: average 10-minute drive population of
efficient HVAC ~200k, portfolio’s average household income above the Spanish
median, below market rents support future releasing prospects
32Sale-Leaseback with Wynn Resorts
Encore Boston Harbor Resort & Casino
● Attractive risk-adjusted returns. Realty Income is purchasing the
Encore Boston Harbor (Encore) Resort and Casino for $1.7 billion at a
5.9% cash cap rate. The transaction is consummated under a 30-year
triple net lease with favorable annual escalators.
● Partnership with leading operator. Wynn Resorts (NASDAQ: WYNN) is
a $20 billion (EV) S&P 500 company and one of the preeminent
developers and operators of integrated resorts in the world, reflecting
Realty Income’s strategy of partnering with industry blue chips.
● Benefits of size and scale. Pro-forma for the transaction, Realty
Income’s exposure to the gaming sector is expected to be < 3.5%,
preserving prudent diversification.
● Demonstrates growth profile of business model. Realty Income’s
entry into the gaming industry demonstrates that its growth opportunities
are unconstrained by industry, property type or geography and in
alignment with our investment criteria.
33Fortress Balance
Sheet
Our conservative capital
structure supports superior
financial flexibility.
34Fortress Balance Sheet – One of Only Seven U.S. REITs with Two A3/A- Ratings or Better
Commercial Paper (2) STAGGERED DEBT MATURITY PROFILE(1)
GBP Denominated Notes (3) in $ millions
$2,407
Term Loan
Revolver (4) $2,054
Mortgages (5) $1,833
$1,576 $1,650
Unsecured Notes
$1,178 $1,099
$1,091
$950
$632 $700
$526
2022 2023 2024 2025 2026 2027 2028 2029 2030 2031 2032 2033+
FAVORABLE CREDIT RATINGS KEY CREDIT METRICS
Long-Term Unsecured Debt Rating
Low Leverage / Conservative Long-Term
High Coverage Ratios Debt Profile
A3 / Stable 5.4x 5.6x 93% 90%
Net Debt Fixed Charge Unsecured Fixed Rate
to Annualized Adj. Coverage Ratio
EBITDAre
A- / Stable 27% 7.7 yrs
Debt to Total W.A. term to maturity
(1) As of 3/31/2022. Market Cap for notes & bonds
(2) Commercial paper borrowings outstanding at March 31, 2022 were $950 million and mature between April 2022 and December 2022.
(3) Represents the principal balance (in USD) of Sterling-denominated note offerings and Sterling-denominated private placement offering converted at the applicable exchange rate on March 31, 2022. Excludes the April 2022 announcement for the private placement of £140 million of senior
unsecured notes due 2030, £345 million senior unsecured notes due 2032, and £115 million senior unsecured notes due 2037. We currently anticipate closing to occur during the second quarter of 2022. 35
(4) As of March 31, 2022, there was a carrying balance of $569.6 million outstanding under our revolving credit facility. In April 2022, we amended and restated our unsecured credit facility in order to increase the borrowing capacity to $4.25 billion and extend the initial term to June 2026.
(5) Includes the principal balance (in USD) of one Sterling-denominated mortgage payable of £31 million converted at the applicable exchange rate on March 31, 2022.Ample Liquidity and Low Borrowing Costs Support Enhanced Financial Flexibility
$1,632 $290
Liquidity Debt Obligations through 2023(2)
Revolver
Availability
$1,480 Excess
Liquidity,
(Net of $950mm
borrowings $1,342
under $1.0 billion
commercial
paper program)(1)
Cash & Equivalents
$152 Mortgages Payable, $290
Sources Uses
Note: Values shown in millions.
Uses: Excludes interest expense, ground leases paid by Realty Income or our clients, and commitments under construction contracts. 36
(1) We use our revolving credit facility as a liquidity backstop for the repayment of the notes issued under our commercial paper program. The revolver has a $1 billion accordion feature, which is subject to obtaining lender commitments.
(2) Excluding revolver and commercial paper maturities.High-Quality Real
Estate Portfolio
Diversified exposure to cash
flows guaranteed by best-in-
class, blue-chip operators
37Diversified High-Quality Portfolio INDUSTRY DIVERSIFICATION(1)
% of Revenue
CLIENT DIVERSIFICATION – TOP 20 CLIENTS
Grocery Stores 10.4%
Convenience Stores 9.1%
Dollar Stores 7.4%
4.0% 1.6% Restaurants - Quick Service 6.6%
Drug Stores 6.5%
Restaurants - Casual Dining 5.8%
3.9% 1.6%
Home Improvement 5.0%
Health and Fitness 4.6%
3.9% 1.5% General Merchandise 3.7%
Theaters 3.3%
3.5% 1.5% (1) Represents total portfolio annualized contractual rent contribution from U.S. and European properties.
2.9% 1.5%
2.4% 1.4% PROPERTY TYPE DIVERSIFICATION GEOGRAPHIC DIVERSIFICATION
2.2% 1.4% 2.0% TEXAS 10.7%
Other
U.K. 8.7%
1.9% 1.2%
CALIFORNIA 6.4%
14.4%
1.8% 1.0% Industrial FLORIDA 5.3%
1.7% 1.0% 83.6%
ILLINOIS 5.0%
Retail
OHIO 4.6%
GEORGIA 3.6%
Note: Orange indicates investment grade clients that are companies or their subsidiaries with a credit rating, as of the balance
sheet date, of Baa3/BBB- or higher from one of the three major rating agencies (Moody’s/S&P/Fitch). 38Top 20 Clients Highly SERVICE-ORIENTED NON-DISCRETIONARY
Insulated from Changing
Consumer Behavior
All top 20 clients fall into at least
one category:
▪ Non-Discretionary
▪ Low Price Point
▪ Service Retail
▪ Non-Retail
LOW PRICE POINT NON-RETAIL
Note: Walmart represented by both Neighborhood Markets and Sam’s Club.
39Diligent Underwriting Process Results in Minimal Exposure to Retail Bankruptcies
Realty Income’s strategy is to invest in clients with a 113 of 154 U.S. retailer bankruptcies since
non-discretionary, low price point, and / or 2017 are associated with companies lacking at least
service-oriented component to their business. one of these characteristics.
TOTAL RETAILER BANKRUPTCIES REALTY INCOME
#
SINCE 2017 EXPOSURE AND STRATEGY
38 Apparel Limited exposure to the industry; existing exposure is primarily with off-price retailers that have fared better.
Immaterial exposure to bankruptcies in this sector. Top clients are large, national operators with strong access to
34 Casual Dining capital that paid essentially all rent due through the duration of the pandemic.
19 Specialty Retailer Limited exposure to the industry, primarily with clients selling low price point goods.
18 General Merchandise Exposure to clients selling non-discretionary and/or low price point goods.
Immaterial exposure to bankruptcies in this industry. Top two US grocery clients (Kroger and Walmart) control >30%
8 Grocery of the US grocery market share and have significant size, scale and access to capital to expand their omni-channel
platforms. In the UK, Sainsbury’s and Tesco are among the top three grocery operators.
8 Shoe Stores Limited exposure to the industry, primarily with off-price retailers.
Limited exposure to this industry and immaterial exposure to bankruptcies, as Realty Income has been proactively
6 Sporting Goods addressing its investment in this industry since 2016.
6 Entertainment Immaterial exposure to entertainment clients outside of the movie theaters, and minimal exposure to bankruptcies.
Top two clients are large, national operators with strong scale and access to capital, one of which paid 100% of rent
5 Health and Fitness through the duration of the pandemic.
3 Jewelry / Accessories Immaterial exposure to this industry. No exposure to bankruptcies.
Immaterial exposure to a large, national operator with strong balance sheet and successful omni-channel platform.
3 Consumer Electronics No exposure to bankruptcies.
40
6 Other Retail No exposure to retailers that filed bankruptcy.Investing in Realty Income = Diversified Credit Exposure to Best-in-Class Operators
Realty Income dividend yield is superior to 10-year bond yields of its underlying clients
Investing in Realty Income vs investing
in individual bonds of top clients(1) GROCERY CONVENIENCE DOLLAR RESTAURANTS –
STORES STORES STORES QUICK SERVICE
PREMIUM YIELD WITH
BOND-LIKE SAFETY
GUARANTEED BY
INVESTMENT GRADE
CREDITS
DIVERSIFICATION
INCOME GROWTH
POTENTIAL
25+ YEAR HISTORY OF
INCREASING INCOME
YIELD PRODUCING 4.3%(2) 3.5%(3) 4.1%(3) 3.6%(3) 3.8%(3)
The sample size represents Realty Income’s clients from top four industries that have ~10-year public unsecured debt outstanding.
(1)
Represents dividend yield as of 3/31/2022.
(2)
Weighted average (by rent) ~10-year unsecured bond yields for each industry.
(3) 41
As of 3/31/2022.Credit Valuation Arbitrage:
Acquiring Cash Flow from Blue-Chip Operators
at Attractive Real Estate Spreads NET LEASE ACQUISITIONS GENERATE PREMIUM
INCOME STREAM RELATIVE TO BONDS
Top 50 Clients Represent(2)
Realty Income’s
~60% ~40% ~60% ~90% ~70% acquisitions generate
~180 bps spread over
of total annual of total annual rent from of Top 50 clients of total rent from of total rent from comparable bond yields
rent clients with public ~10-yr have an investment publicly traded members of S&P 500
notes outstanding grade credit rating(3) companies or equivalent index
BBB-/Baa3 562 bps
weighted average
credit rating
382 bps
(1)
Top 50 Client 10-Year Bond Yields 1Q22 Acquisition Cap Rate
Source: Bloomberg
(1) Weighted average (by rent) ~10-year bond yields as of 3/31/2022.
(2) As of 3/31/2022.
(3) As measured by rent. ~12% of clients (by rent) are not rated. Investment grade clients are clients with a credit rating of
Baa3/BBB- or higher from one of the three major rating agencies (Moody’s/S&P/Fitch).
42Stable and Predictable Cash Flows Supported by High-Quality Real Estate Portfolio
O
Industry-Leading Occupancy Levels, S&P 500 REIT
Consistent During Various Economic Cycles O Median
S&P 500 REIT Median (1)
CONSISTENCY BY DESIGN:
99.5%
98.4% 98.5% 98.7% 98.2% 98.4% 98.4% 98.3% 98.4% 98.6% 98.6% 97.9% 98.5% 98.6%
97.7% 98.2% 97.7% 98.1% 97.9% 97.9%
97.0% 96.8% 97.2% 98.2% Careful underwriting at acquisition
96.6% 96.7%
Long initial lease term
94.0%
Strong underlying real estate quality
Strategy of owning “mission critical” locations
Diversified client industries with strong fundamentals
Prudent disposition activity
1998 1999 2000 2001 2002 2003 2004 2005 2006 2007 2008 2009 2010 2011 2012 2013 2014 2015 2016 2017 2018 2019 2020 2021 Q1
2022
Manageable Lease Expiration Schedule
Provides High Visibility into Future Cash Flows
MAXIMIZING REAL ESTATE VALUE:
47.7%
Weighted average lease
Strategic management of rollovers
term of 8.9 years
Proactively addressing portfolio “watch list”
Resolved over 4,200 lease expirations since 1996
6.5% 5.9% 8.1% 7.6% 7.1% 5.4%
4.8% 5.1%
1.8%
2022 2023 2024 2025 2026 2027 2028 2029 2030 2031-2046
(1) Includes
22 S&P 500 constituents, excluding non-property REITs, such as AMT, CCI, EQIX, IRM, SBAC, WY.
Occupancy calculated by number of properties. Lease expiration schedule represents percentage of total portfolio annualized contractual rent. 43Proven Track Record of Value-Add Asset and Portfolio Management
Strong client retention rates are a testament to real estate quality, operator quality,
active asset management and mutually beneficial client relationships(1)
85% 91% 94% 93% 94% 88% 87%
77% Strong client retention supports
industry-leading leasing spreads
2015 2016 2017 2018 2019 2020 2021 YTD 2022
Accretive Re-Leasing Activity is
a Result of Prudent Underwriting(2)
• Rents at or below market at acquisition result in
104.5% 105.5% 106.2%
above 100% recapture ratios at expiration. 100.9% 103.3% 102.6% 103.4%
100.0%
• Re-leased over 3,500 properties at 101.2%
recapture rate(2) since 1996.
• One of the few net lease companies that report
re-leasing results.
2015 2016 2017 2018 2019 2020 2021 YTD 2022
(1) Based on number of leases re-leased to same clients each year.
(2) Reflects cash rent recapture inclusive of client improvement spend (immaterial).
44Capital-Light Real Estate Portfolio
“HIDDEN” COST OF SUPPORTING PORTFOLIO REVENUE:
is a Differentiating Factor vs Other RARELY CAPTURED IN NAREIT-DEFINED FFO MULTIPLES….
Property Types
NAREIT-DEFINED FUNDS FROM OPERATIONS (FFO)
(NOT INTENDED TO MEASURE CASH GENERATION OR DIVIDEND
PAYING CAPACITY)
Recurring Capital Expenditures as % of NOI:
Realty Income vs. Competing Real Estate Sectors(1) Generally used as primary valuation multiple for other
Real Estate sectors and excludes recurring Capex
associated with maintaining revenue-generating
Less than 1% of Realty Income’s capacity of portfolio
NOI is spent on recurring capex
8.9%
8.3%
7.4% 7.6% ….BUT IS BETTER REFLECTED IN AFFO MULTIPLES
5.7%
ADJUSTED FFO (AFFO)
(CLOSE PROXY FOR RECURRING CASH EARNINGS)
0.5% Generally used as a valuation metric for net lease
sector and includes impact of recurring Capex (defined
O Healthcare Shopping Center Industrial Office Mall
by Realty as mandatory and repetitive landlord capex
obligations that have a limited useful life)
Source: SNL, Company Filings.
(1) Analysis represents simple average of 52 representative companies across five property types. Based on annual data between
2012 and 2021. 45European Portfolio
Overview
Sale-leaseback transaction with
Sainsbury’s in May 2019 was a
foundation for a growth platform
in Europe
46European Portfolio Snapshot
REALTY INCOME HAS CONTINUED TO GROW ITS EUROPEAN PRESENCE WITH INVESTMENTS OF ~$5.1 BILLION THROUGH MARCH 31, 2022
194 >20 ~15.7mm ~$281mm 10+ 9.4%
properties industries leasable square annualized years wtd. avg. of total portfolio annualized
feet contractual rent remaining lease term contractual rent
REALTY INCOME’S QUARTERLY INVESTMENT VOLUMES IN EUROPE
$1,041.1
(in millions)
~$5.1 billion invested in real estate in the U.K. and $795.9
Spain since international expansion in May 2019
$591.8
$549.2 $532.5
$467.2
$403.0
$221.0 $230.0
$165.6
$27.6 $58.2
2Q19 2Q19 4Q19 1Q20 2Q20 3Q20 4Q20 1Q21 2Q21 3Q21 4Q21 1Q22
47European Portfolio Snapshot (cont’d)
CLIENT DIVERSIFICATION – TOP EUROPEAN CLIENTS(1) EUROPEAN PORTFOLIO BY INDUSTRY(1)
Other, 17%
24.9%
Grocery, 59%
18.4% Health Care, 1%
Warehousing and Storage, 2%
17.3% Home Improvement, 21%
5.6% KEY HIGHLIGHTS
Diversified portfolio leased to clients operating in non-discretionary
5.0%
industries
Sainsbury’s and Tesco are the top grocers in the U.K.(2), and
Other 28.8% Carrefour is the 2nd largest grocer in Spain
B&Q (Kingfisher) is the largest home improvement retailer in the
U.K. and is number two in France(3)
(1) Based on percentages of total European portfolio annualized contractual rent as of March 31, 2022.
(2) Based on market share. Source: Kantar World Panel. 48
(3) Source: Mintel, 2020.ESG Overview
We are committed to
partnering with our clients on
ESG initiatives to uphold our
corporate responsibilities as a
public company for the benefit
of our stakeholders.
49ESG Overview
OUR COMMITMENT GOVERNANCE
Realty Income is committed to conducting our KEY BOARD CHARACTERISTICS
business according to the highest ethical standards. We seek to compose our Board of directors with members who
We are dedicated to providing an engaging, inclusive, contribute to diversity of background, expertise, perspective,
age, gender, and ethnicity.
and safe work environment for our employees,
operating our business in an environmentally ESG OVERSIGHT
conscious manner, and upholding our corporate The Nominating/Corporate Governance Committee of our Board
responsibilities as a public company for the benefit of Directors has direct oversight of the policies, programs and
practices related to ESG matters of significance to the company.
of our stakeholders.
42% OF OUR BOARD IDENTIFIES AS 50% OF OUR BOARD IS FROM
FEMALE UNDERREPRESENTED
COMMUNITIES
92% INDEPENDENT
All our directors other than our CEO are independent.
OUR STAKEHOLDERS
DIRECTOR TENURE
6
5
Investors Clients Team Community
1
Note: for additional information, refer to our Sustainability Report which can be found at:
11 years 50
https://www.realtyincome.com/corporate-responsibility/sustainability-reportSocial
Social
Responsibility
OUR COMMITMENT: We put great effort into cultivating an inclusive company culture. We are one team, and
together we are committed to providing an engaging work environment centered on our One Team values of Do
the right thing, Take ownership, Empower each other, Celebrate differences, and Give more than we take.
We hire talented employees with diverse backgrounds and perspectives and work to provide an environment
with regular open communication where capable team members have fulfilling careers and are encouraged to
engage with and make a positive impact with business partners and in the communities where we operate.
Hiring and Retention – Competitive pay & benefits;
Internal Talent Mobility Program; Mentorship Program.
Human Capital Development – Continued education;
training and development.
Employee Health, Safety & Wellbeing - “O”verall Wellbeing Program.
Human Rights – Read our Human Rights Policy on our website!
Engagement – We conduct employee engagement
surveys every 18 months.
Social Justice – Read our Statement on Racial Justice and Equality
for All on our website!
Community Service – Our community partnerships and charitable
giving reflect our commitment.
51Environmental
Environmental
Responsibility
OUR COMMITMENT: We remain committed to sustainable business practices in our day-to-day activities by
encouraging a culture of environmental responsibility at our corporate offices and within our communities. We work
with our clients to promote environmental responsibility at the properties we own.
Increasing investments in green certified buildings.
Demonstrating our commitment through the issuance of our inaugural Green Bond.
Innovating solutions for reporting Scope 3 emissions across a net lease real estate portfolio.
Expanding and incorporating a greater volume of “Green Lease Clauses”.
Engaging with our clients to understand ESG priorities and share data.
Scaling collaborative client engagement projects.
Working with strategic partners to grow sustainable portfolio initiatives.
Providing ESG resources and tools for internal teams to carry out key initiatives.
Assessing and adapting to ESG regulatory environments and climate risks across portfolio.
52Appendix
• International Expansion
Opportunity
• Top Industry Investment
Theses
53UK Density Supports Long-Term
Real Estate Stability The UK, by population,
is approximately the 68.5M
Limited retail supply and supply growth also supports size of California and
Current
Population(1)
long-term viability of stable cash flow generation. Texas combined.
UK POPULATION AND PROJECTIONS(1)
(in millions) The UK, by land area,
Population
is approximately 93,628
Projected Population 73 Square
the size of Oregon. Miles
80
68.5 M
2021
57
60
40
The UK, by GDP, is
1991 2001 2011 2021 2031 2041
approximately $2.7
Trillion
the size of California. GDP(3)
RETAIL SQUARE FOOTAGE PER CAPITA(2)
Spain 4
UK 5
Population density and growth, combined
US 24 with limited retail supply and supply
growth, creates compelling opportunity for
long-term real estate investors.
Source:
(1) UK Office for National Statistics.
(2) ICSC; Springboard.
(3) 2020 GDP. Source: OECD National Accounts Data files; Bureau of Economic Analysis; Savills Aguirre Newman.
54Spain Considerations as Market for European Entry:
Strong GDP growth, sizable addressable market, low financing costs
EXPECTED REAL GDP GROWTH(1)
(year/year)
7.5%
Spain
6.4%
6.1%
Euro Area
GROWING ECONOMY:
Spain GDP growth is expected to 3.9%
outperform the Euro Area 3.1%
4Q21 1Q22 2Q22 3Q22 4Q22
TOTAL RETAIL REAL ESTATE INVESTMENT VOLUME(2)
(in millions)
€ 3,000
LARGE ADDRESSABLE MARKET
suggests deep pipeline of future € 2,000
expansion opportunity
€ 1,000
Source: €0
(1) Barclays Economics.
2019 2020 2021 55
(2) CBRE Research.Grocery (10.4% of ABR)
U.S. Grocery Market Share(1)
EXPOSURE TO TOP OPERATORS IN AN ESSENTIAL, U.K. Grocery Market Share(2)
E-COMMERCE RESISTANT INDUSTRY
53% 66%
Realty Income’s top two U.K. grocery Big 4
clients control ~42% of U.K. grocery Discounters
Realty Income’s top two U.S. grocery market share
clients control 32% of U.S. grocery Convenience
23% market share Premium
18% "Pure play" online
9%
5% 4% 8%
3% 3% 5%
2%
Walmart Kroger Costco Ahold Dollar Stores Amazon Other Category 1
Other
Source:
(1) Wells Fargo Securities Research,2022.
(2) Kantar World Panel for 12 weeks ending 4/17/2022.
POSITIVE OUTLOOK ON THE SPANISH GROCERY INDUSTRY:
Food-at-Home as a % of Total Food Pre-COVID Online Grocery
Expenditure(3) Food-at-home spending more prevalent, Penetration(4)
online grocery spending less common
66%
61%
7.4%
52%
4.5%
1.3%
Source: Spain UK US Spain US UK 56
(3) Statista.com, Gov.uk, USDA ERS.
(4) CBRE, Statista.com, Multichannelmerchant.com, Kantar.Convenience Stores (9.1% of ABR) 2040 SNAPSHOT
Quality real estate locations with inelastic demand
In 2040, EVs will make up about
6% of all vehicles on the road,
~20% of all shoppers claim to visit a c-store while EVs will account for about
to purchase food-to-go(1). 10% of all new vehicle sales.
~70% of inside sales are generated by
customers not buying gas(2).
165M people shop in c-stores everyday(3).
VEHICLES ON THE AVG AGE OF CARS ON THE
ROAD IN 2040(4) ROAD 11.8 YEARS(4)
GROSS MARGIN(3) 7-ELEVEN: INSIDE SAME-STORE SALES:
19 Consecutive Years of Positive Same-Store Sales Growth(5)
8% 7.4%
Great Recession
6% 5.8%
5.3%
~9% Margin 30%+ Margin 4%
4.4%
3.1%
3.1%
Gasoline In Store Sales 2.8% 2.9%
3.1% 2.4%
3.2% 1.9%
2% 2.1%
0.6% 1.5% 1.6%
~70% of gross profit is generated from inside sales 1.0% 0.9%
0.4%
Source: 0%
(1) Explorer Research. 2003 2004 2005 2006 2007 2008 2009 2010 2011 2012 2013 2014 2015 2016 2017 2018 2019 2020 2021
(2) Realty Income estimates based on industry component data.
(3) National Association of Convenience Stores. Gross margins are averages over the past five years. 57
(4) U.S. Energy Information Administration and Bureau of Transportation Statistics.
(5) Company Filings.Dollar Stores (7.4% of ABR)
Growing industry: 89% of all shoppers across geographies, US Discount Store Market Size Dollar General & Dollar Tree: Counter-cyclical protection due to a trade
income levels, and demographics shop at discount retailers. down effect and e-commerce resiliency.
(in billions)(1) Same-Store Sales Growth(2)
$120 16.3%
+5%
$100
+6%
$80 9.5%
7.3% 7.2%
$60 5.7% 4.6% 4.3% 3.9% 6.1%
2.0% 3.2%
4.9%
$40 0.1%
-0.8% 2.4%
0.9% 0.9% 1.7% 1.8% 1.0%
$20
2000 2003 2006 2009 2012 2015 2018 2021
-2.8%
$0
2006 2008 2010 2012 2014 2016 2018 2020 2022E 2024E
Source:
(1) National Retail Federation.
(2) Company Filings.
58Quick-Service Restaurants (6.6% of ABR) RESILIENT BUSINESS MODEL:
QSRs are less dependent on “dine-in” traffic as their revenue model is based
on an “off-premise” and drive-thru (historically 65%+ of sales) offerings.
STRONG VALUE PROPOSITION:
In a recessionary environment, consumers tend to be more
value-centric and QSR operators benefit from a “trade down” effect
from casual dining consumers.
FUNGIBILITY OF REAL ESTATE:
Positive re-leasing results on QSR assets due to convenience
of real estate location and modest space footprint.
SAME-STORE SALES TRENDS: STRONG RECOVERY TO ABOVE PRE-PANDEMIC LEVELS
Growth Over the Same Month in 2019(1)
20.2%
15.7% 15.7%
14.4% 14.4%
12.7% 12.0% 12.2%
11.1% 11.7% 11.0%
9.8% 9.5%
4.2%
Jan-21 Feb-21 Mar-21 Apr-21 May-21 June-21 July-21 Aug-21 Sept-21 Oct-21 Nov-21 Dec-21 22-Jan 22-Feb
59
(1) Source: Miller Pulse.Drug Stores (6.5% of ABR) Of the scope of a typical primary care
80% physician treatable at an on-site clinic(1).
Bundled service partnerships and vertical integration
among incumbents insulates industry from outside threats.
Of the US population lives within
85% 3 miles of a Walgreens or CVS(2).
Combined retail prescription market
~50% share of Walgreens and CVS(3).
Both Walgreens and CVS Walgreens plans to open
CVS currently operates over
are investing in improved 1,000 full-service doctor
1,000 Health HUB locations
customer experience. offices by the end of 2027.
Walgreens: 35 of 36 Quarters of Positive
Same-Store Pharmacy Sales Growth(4).
9.7%
9.3% 8.9%
8.4%
7.4% 7.3%
7.2%
6.0% 6.8%
6.0% 5.8%
5.0%
5.8% 5.6%
3.5%
4.5%
3.7% 2.8%
3.2%
2.0% 2.5%
2.0%
1.9%
0.0%
Source:
(1) CVS filings.
(2) Company Documents.
(3) Company Filings as reported by IQVIA.
60
(4) Company Filings | Latest reported quarter.You can also read