INVESTOR DAY 2022 TSX: VLNS NASDAQ:VLNS THEVALENSCOMPANY.COM - The Valens Company
←
→
Page content transcription
If your browser does not render page correctly, please read the page content below
INVESTOR DAY 2022
TS X : VLNS
NASDAQ:VLNS

              THEVALENSCOMPANY.COM
NOTICE TO RECIPIENT

This presentation (the “Presentation”) of The Valens Company Inc. (the “Company” or “The Valens Company” or “Valens”) is an overview only and does not contain all the information that a prospective
investor may require to make investment decisions. This Presentation is for information purposes only and does not constitute an offer to sell or a solicitation to buy any securities of the Company. In
making an investment decision, investors must rely on their own examination of the Company, including the merits and risks involved. This presentation is confidential and contains confidential
information and distribution of this presentation may also be restricted or prohibited by law. Recipients are required to inform themselves of, and comply with, all such restrictions or prohibitions.

FORWARD LOOKING STATEMENTS

This Presentation contains forward-looking statements and forward-looking information (collectively, “forward-looking statements”) within the meaning of applicable Canadian securities laws.
Any           statements          that         involve      discussions     with     respect     to    predictions,     expectations,     beliefs,        plans,         projections,         objectives,
assumptions or future events or performance (often but not always using phrases such as "expects",“ is expected", "anticipates", "plans", "budget", "scheduled", "forecasts", "estimates", "believes“ or
"intends", or variations of such words and phrases (including negative and grammatical variations), or stating that certain actions, events or results "may", "could", "would", "should", "might" or "will"
be taken, occur or be achieved) are not statements of historical fact and may be forward-looking statements and are intended to identify forward-looking statements.

By their nature, forward-looking statements are based on assumptions and are subject to known and unknown risks, uncertainties and other factors which may cause the actual results, performance or
achievements of the Company, or developments in the Company’s industry, to be materially different from any future results, performance or achievements, or industry developments, expressed or
implied by the forward-looking statements and information. These risks are described in the Company’s latest Annual Information Form for the year ended November 30, 2020 and Management’s
Discussion and Analysis of the Company for the three-month period ended February 28, 2021 (the “MD&A”), each as filed with the Canadian securities regulatory authorities on SEDAR at www.sedar.com.
Examples of forward-looking statements include, without limitation: (A) financial forecasts of the Company; (B) the intention to grow the business and operations of the Company; (C) anticipated timing
for the availability of the Company’s products to market and expected sale prices; (D) expected growth in the number of users of medical and recreational marijuana anticipated in various regional and
international markets; and (E) the expansion of the Company’s business into other revenue streams. Actual results and developments are likely to differ, and may differ materially, from those expressed
or implied by the forward-looking statements contained in this Presentation.

Such forward-looking statements are based on a number of assumptions which may prove to be incorrect, including, but not limited to: expectations regarding the ability of the Company to raise capital
and grow through acquisitions; growth strategy, joint venture and other commercial opportunities, including cannabis-related legal reform and regulatory changes with respect to the U.S. and other
international markets, and the ability of the Company to capitalize on these opportunities through its stated work program; and expected sources and uses of capital. There can be no assurance that
forward-looking statements will prove to be accurate, as actual results and future events could differ materially from those anticipated in such statements. Accordingly, readers should not place undue
reliance on forward-looking statements. The forward-looking statements and information contained in this Presentation are expressly qualified in their entirety by this cautionary statement. The
forward-looking statements and information included in this Presentation are made as of the date of this Presentation and the Company assumes no obligation to update such forward-looking
statements to reflect new information, subsequent events or otherwise unless required by applicable securities legislation.

                                                                                                                                                       T S X :   V L N S   |   N A S D A Q :   V L N S   2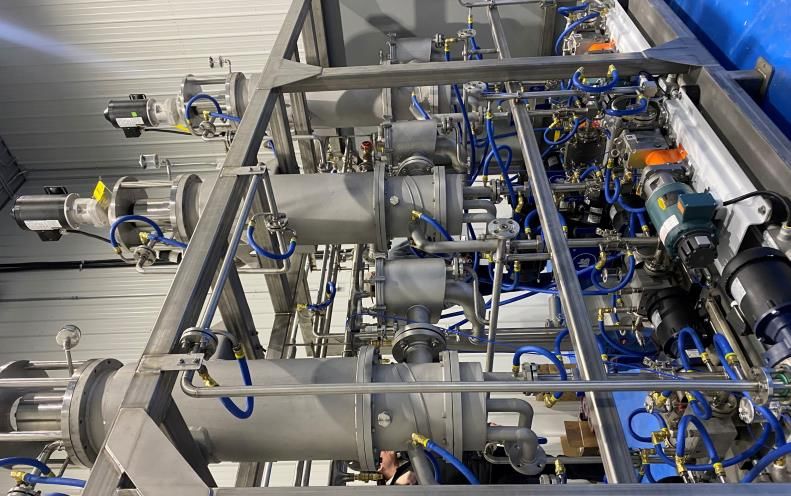
Historical statements contained in this Presentation regarding past trends or activities should not be taken as a representation that such trends or activities will continue in the future. In this regard,
certain financial information contained herein has been extracted from, or based upon, information available in the public domain and/or provided by the Company. In particular, historical results of the
Company should not be taken as a representation that such trends will be replicated in the future. No statement in this document is intended to be nor may be construed as a profit forecast.

CAUTIONARY NOTE REGARDING FUTURE-ORIENTED FINANCIAL INFORMATION

To the extent any forward-looking statement in this Presentation constitutes “future-oriented financial information” or “financial outlooks” within the meaning of applicable Canadian securities laws,
such information is being provided to demonstrate the anticipated market penetration and the reader is cautioned that this information may not be appropriate for any other purpose and the reader
should not place undue reliance on such future-oriented financial information and financial outlooks. Future-oriented financial information and financial outlooks, as with forward-looking statements
generally, are, without limitation, based on the assumptions and subject to risks as set out above under the heading “Forward-Looking Statements”. The Company’s actual financial position and results
of operations may differ materially from management’s current expectations and, as a result, the Company’s revenue and expenses may differ materially from the revenue and expenses
profiles provided in this presentation. Such information is presented for illustrative purposes only and may not be an indication of the Company’s actual financial position or results of operations.

THIRD PARTY INFORMATION

This Presentation includes market and industry data which was obtained from various publicly available third-party sources. In preparing this Presentation, the Company has relied upon such data from
certain of these sources and other sources believed by the Company to be true. Although the Company believes it to be reliable, the Company has not independently verified any of the data or
conclusions from third-party sources referred to in this presentation, or analyzed or verified the underlying reports relied upon or referred to by such sources, or ascertained the underlying assumptions
relied upon by such sources. The Company does not make any representation or warranty as to the accuracy or completeness, or suitability for any given analytical purpose, of such data or conclusions
and disclaims any liability to the recipient from the recipient’s use of any such report or source, or the data or conclusions therein, including those reproduced herein.

USE OF NON-GAAP MEASURES

Adjusted EBITDA is a non-GAAP measure used by management that does not have any standardized meaning prescribed by IFRS and may not be comparable to similar measures presented by other
companies. Management defines adjusted EBITDA as loss and comprehensive loss from operations, as reported, before interest, tax, depreciation and amortization, and adjusted for removing share-
based payments, unrealized gains and losses from short term investments and other one-time and non-cash items including impairment losses. Management believes adjusted EBITDA is a useful
financial metric to assess its operating performance on an adjusted basis as described above. A description of these financial measures, including a reconciliation of such measures, to the extent
possible, against the most directly comparable IFRS measure, can be found starting on page 7 of the MD&A for the three-month period ended February 28, 2021 .

                                                                                                                                                        T S X :   V L N S   |   N A S D A Q :   V L N S   3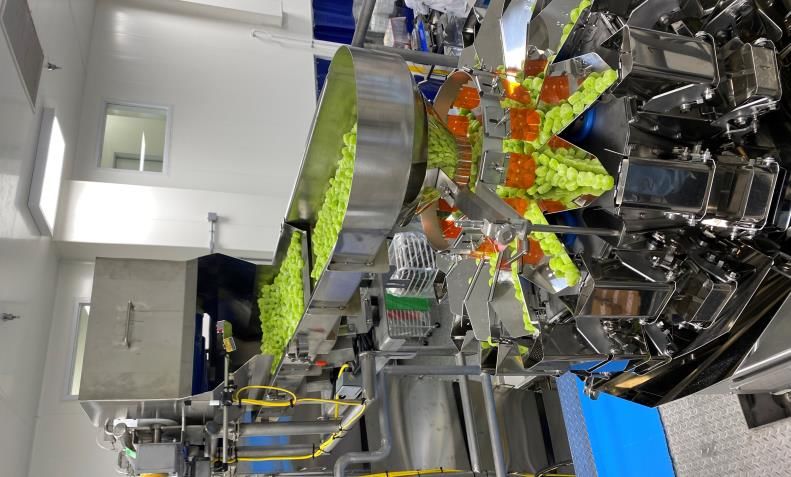
INVESTOR DAY VIDEO
TS X : VLNS
NASDAQ:VLNS
OPENING REMARKS
VALENS LEADERSHIP TEAM

Tyler Robson, B.A. & Sc.                                                         Jeff Fallows LLB/MBA, CFA
Chair of the Board, Chief Executive Officer & Co-founder                         President
Mr. Robson has worked extensively over the last decade in cannabis science,      Mr. Fallows is an accomplished finance professional with over 18 years of
focusing on R&D, proprietary extraction processing and medical application.      experience working on a wide range of financial transactions in the cannabis,
Under Mr. Robson’s leadership, The Valens Company has repositioned its core      consumer products and industrial products industries. He spent the last 10
offering from extraction services to product development and manufacturing,      years working with a number of cannabis companies to raise capital and has
becoming one of the largest third-party cannabis consumer packaged goods         advised on some of the largest transactions in the sector. Prior to joining The
manufacturers in Canada.                                                         Valens Company, Mr. Fallows worked as a Managing Director at ATB Financial.

Sunil Gandhi, CPA                                                                Adam Shea
Chief Financial Officer                                                          Chief Commercial Officer
Mr. Gandhi brings 25 years of corporate and operational finance experience       Mr. Shea holds over 16 years of experience in commercial strategy, sales, and
largely in the consumer-packaged goods and alcohol beverage industries., with    marketing with a strong knowledge of the Canadian and US consumer
a demonstrated track record in refining operations and supporting growth for     packaged goods landscape. He has held senior positions with various
both large public companies and high-growth private enterprises. He previously
                                                                                 consumer-focused organizations in the food, beverage, tobacco and
served as CFO at Trophy Foods and VP, Finance for one of North America’s
                                                                                 cosmetics industries, such as Weston Foods, Red Bull, Coty Beauty and
largest private alcohol beverage companies.
                                                                                 British American Tobacco.

Chantel Popoff                                                                   Everett Knight, CFA
Chief Operating Officer                                                          EVP, Corporate Development and Capital Markets
Ms. Popoff has over a decade of experience in managing 21+ Western Canadian      Mr. Knight holds over a decade of experience in Portfolio Management and
retail pharmacy chains, including Shoppers Drug Mart. After her time in          Private Equity. At Matco Financial, he launched the first ever institutional long
pharma, she spent over 6 years in senior managerial roles in the Canadian        only cannabis mandate in Canada and managed a small cap fund, ranked first
natural health food industry.                                                    in its category. He is known for his thought leadership and expertise in
                                                                                 analyzing, lobbying, investing, advising, and consulting throughout
                                                                                 the cannabis value chain.

                                                                                                                               T S X :   V L N S   |   N A S D A Q :   V L N S   5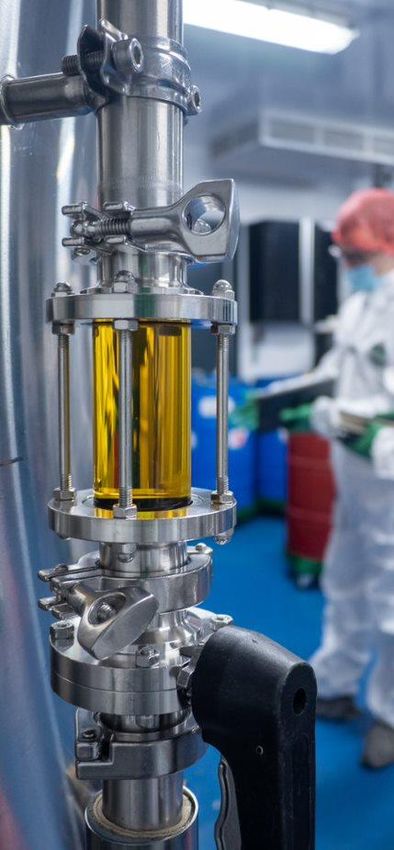
TABLE OF CONTENTS

1.   Opening Remarks

2.   Long Term Market Opportunity

3.   2021 Review and Recap

4. 2022 Business Plan

5.   Summary and Closing Remark

                                    6
TYLER ROBSON

CHIEF EXECUTIVE OFFICER & CHAIRMAN

OPENING REMARKS
KEY OBJECTIVES FOR 2022

    Valens made incredible progress over          Key objectives for 2022
    2021 including some key milestones:
                                                  1.   Vapes, Edibles, Beverages – Top 5
                                                       player
    1.   Successfully transitioned the
         business into a leading Provincial       2.   Flower Products – Top 10 player
         Sales platform with quickly growing
                                                  3.   Gross margin improvement,
         brands
                                                       positive EBITDA by Q4
                                                  4.   Further entry into the US market
    2.   Deployed “Fewer, Bigger, Better”
         approach with B2B customers
                                                  Rolling out revenue and EBITDA
                                                  guidance for 2023:
    3.   Commissioned K2 and Pommies
         facilities for next generation product
                                                  1.   Revenue of minimum $225MM
         development and manufacturing
                                                  2.   Adjusted EBITDA margins >10%

                                                                    T S X : V L N S | N A S D A Q : V L N S
                                                                    T S X : V L N S | N A S D A Q : V L N S
                                                                                                              8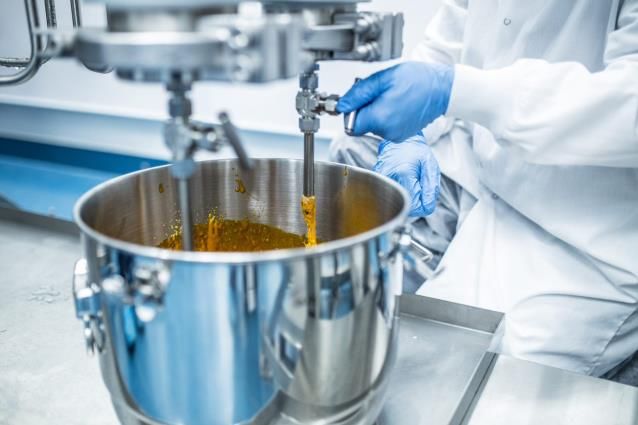
OUR MISSION
BRINGING THE BENEFITS OF
CANNABIS TO THE WORLD

       T S X :   V L N S   |   N A S D A Q :   V L N S   9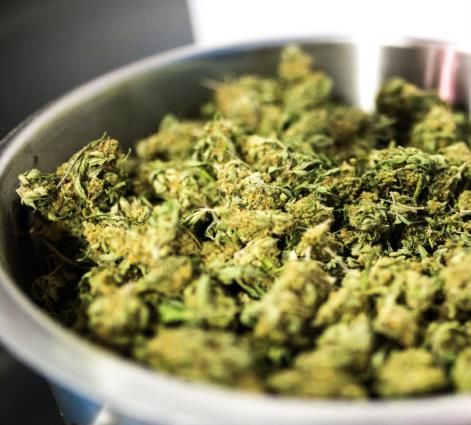
OPENING REMARKS
KEY THEMES FOR 2022

           Canada Average Price / Gram(1)

                    $10.81

                                  $8.76
                                                                                                             Deep Cannabis
                                                                Greenhouse,
                                                                                                           Formulation + CPG
                                                                 Indoor and
                                            $5.73                                                         Product Development
                                                                  Outdoor
                                                                                                               Expertise

          Canadian Market Landscape                     Contract Grow Supports                        Innovation
                                                        Flexible Platform

•         Entering a transitional year              •   Contract grow is key to Valens          •      IP drives innovation which
•         Expect continued decrease in                  platform                                       ultimately is key to Valens
          biomass pricing through 2022              •   Optimize supply chain to drive down            continued market share gains
•         Increased consolidation in 2022 will          input cost for each product and drive   •      Sales velocity is a forward
          open up market share opportunities            on-time-in-full shipments                      indicator entering 2022

    (1)   Stifel Financial estimates
                                                                                                    T S X :   V L N S   |   N A S D A Q :   V L N S
                                                                                                                                                      10
EVERETT KNIGHT EVP CORPORATE DEVELOPMENT & CAPITAL MARKETS
LONG TERM MARKE T O PPO RTUNITY
KEY STATS SNAPSHOT

FUNDAMENTALS                                       +374%(1)                                         #2                                      #1                                    C$77B(2)

                                              Valens Y/Y Growth in                    Position Valens holds in                  Revenue generated per                     Forecasted 2026 global
                                                  Retail Sales                          dried flower SKU in                         dollar invested                         cannabis revenues
                                                                                        December 2021                             compared to peers

CAPITAL MARKETS                                        -37%                                      1.0x(3)                                  108%(3)                                 ~C$2.00

                                                Valens share price                   Average analyst revenue                       Analyst projected                     The tangible book value
                                               performance in 2021                      forecast for 2022E                       2022E revenue growth                        of Valens assets
                                                                                           EV/Revenue

 (1) Hifyre data for Ontario, Alberta, British Columbia and Saskatchewan for the three months ended January 2022 vs the year-ago period
 (2) BDSA September 2021 Cannabis Forecast; converted at USD/CAD exchange rate of 1.24                                                           T S X :   V L N S   |   N A S D A Q :   V L N S   12
 (3) S&P Capital IQ as of January 31, 2022, Consensus research analyst estimates
LONG TERM MARKE T O PPO RTUNITY
CAPITALIZING ON THE GLOBAL LEGALIZATION OF CANNABIS
• The global legal cannabis market is expected to reach C$77.0 billion in 2026, representing a CAGR of ~19.2%
• Valens expects that the global legal cannabis market will be one of the fastest growing consumer categories through 2026 as
more countries opt to legalize through medical and recreational regulatory frameworks
Estimated Size of Global Legal Cannabis Market(1)
$80.0 $77.0
+187%
Sales (C$, Billions)
$60.0
$40.0
$26.8
$20.0
$0.0
2020 2021 2022 2023 2024 2025 2026
(1) BDSA September 2021 Cannabis Forecast; converted at USD/CAD exchange rate of 1.24
T S X : V L N S | N A S D A Q : V L N S 13LONG TERM MARKE T O PPO RTUNITY
CANNABIS MARKET FORECASTS
CANADIAN CANNABIS MARKET FORECAST (C$B)
$10.0
+156%
$5.0
$3.9
$2.6
$1.2
1 1 2
2019 2020 2021 2022 LEGAL + ILLICIT
U.S. CANNABIS MARKET FORECAST (C$B)(3)
+91% $58.9
$37.2
$30.9
$22.3
2020 2021 2022 2023 2024 2025 2026
(1) Stifel estimates
(2) Cantor Fitzgerald estimates
(3) U.S. Cannabis Market Forecast as per BDSA (Legal Cannabis Forecast October 2021 Report), Market opportunity for THC in the U.S. will depend on T S X : V L N S | N A S D A Q : V L N S 14
anticipated Federal legalization, clarity and harmonization of state regulations in the U.S., and Valens being able to pursue the same under TSX and
Nasdaq rulesLONG TERM MARKE T O PPO RTUNITY
CANNABIS IS A TOP FOUR CONSUMER CATEGORY IN THE U.S.
• The majority of global cannabis spending remains in the illicit market; however, Valens expects it to move legal over time
• Including both legal and illicit spending, cannabis is estimated to be in the top four of all consumer categories
Annual U.S. Consumer Spending Across Categories (US$, Billions)(1)
Largest Company in
$285 $212 $174 TBD $154 $58 $156 $323 $6 $110 $428 $451 $7 $110
Each Sector (USB$)2
$146.0
$119.3
$98.8
$82.1 $81.2
$67.3
$29.0 $26.5 $22.2 $21.9 $19.4 $19.3 $17.2
$3.9
(1) Euromonitor, BDSA, Jefferies Estimates; Jefferies Initiation Report on US Cannabis dated July 7, 2021, Market opportunity for THC in the U.S. will
depend on anticipated Federal legalization, clarity and harmonization of state regulations in the U.S., and Valens being able to pursue the same T S X : V L N S | N A S D A Q : V L N S 15
under TSX and Nasdaq rules
(2) S&P Capital IQ as of December 31, 2021, See Appendix A sector cohortsLONG TERM MARKE T O PPO RTUNITY
UNDERFORMANCE OF GROWTH STOCKS IN THE BACK HALF OF 2021
• Cannabis companies faced a challenging 2021 with the 2021 Share Price Performance(1)
most pain felt in less liquid, small-mid capitalization
companies The Valens Company Inc. -37%
US Listed Canadian LPs
• Despite having the lowest enterprise value of the top Tilray Brands, Inc. -15%
Canadian LPs, Valens outperformed half of its peer Canopy Growth Corporation -65%
group Aurora Cannabis Inc. -35%
Village Farms International, Inc. -37%
HEXO Corp. -81%
• In general, growth stocks experienced a sharp pullback
OrganiGram Holdings Inc. 31%
into 2022, with inflation and other macroeconomic
Cronos Group Inc. -44%
worries at the forefront of conversation
Average -35%
• Valens believes the pullback in its shares presents an
attractive entry point for investors
(1) S&P Capital IQ as of December 31, 2021
T S X : V L N S | N A S D A Q : V L N S 16LONG TERM MARKE T O PPO RTUNITY
VALUATION MULTIPLES
• Valens trades at a significant discount of 1.0x EV/Revenue 2022E compared to its US Listed Canadian LP peers at 3.6x
• Valens also trades at a significant discount compared to mature CPG industries (tobacco, pharmaceuticals, and household
products), despite having the highest growth rate
EV/Revenue Revenue Growth
20 22 20 23 20 22 20 23
The Valens Company Inc. 1.0 x 0 .7 x 10 8% 37 % Valens trades at the
lowest multiple with
US MSOs 3.3x 2.7 x 4 2% 23% the highest forecasted
US Listed Canadian LPs 3.6x 2.8x 37 % 32% growth rate – we aim
Technology 8.6x 6.8x 31% 26%
to change this over
time as Valens
Non-Alcohol 6.5x 5.6x 24 % 18%
achieves its growth
Packaged Foods 2.9x 2.6x 7% 5% objectives and
Alcohol 4 .8x 4 .5x 8% 5% demonstrates its
Household Products 4 .0 x 3.9x 4% 3% ability to manage the
Tobacco 4 .6x 4 .5x 3% 3% growth
Pharmaceuticals 4 .3x 4 .4 x 1% -3%
Source: S&P Capital IQ as of January 31, 2021. Consensus research analyst estimates. See Appendix B for industry constituents
T S X : V L N S | N A S D A Q : V L N S 17LONG TERM MARKE T O PPO RTUNITY
INSTITUTIONAL OWNERSHIP
• Valens recently listed on the Nasdaq and anticipates a catch-up in institutional adoption versus its Nasdaq listed LP peers
• Institutional ownership in the sector is ~44% lower than the average of mature CPG industries, cannabis is still in the early
innings of attracting institutional capital(1)
Institutional Ownership(1)
The Valens Company Inc. 12.6%
TM
US MSOs 4.3% 14.7%(1)
US Listed Canadian LPs 15.6% Valens has a clear near-
Non-US Listed Canadian LPs 5.9% term catch-up opportunity
with institutional investors
Technology 71.8%
compared to some of its
Non-Alcohol 52.0% TM
U.S. Listed Canadian LP
18.3%(1)
Packaged Foods 59.7% peers
Alcohol 60.2%
Household Products 76.2%
TM
Tobacco 73.7%
23.6%(1)
Pharmaceuticals 76.9%
(1) S&P Capital IQ as of January 31, 2022. See Appendix B for industry constituents
T S X : V L N S | N A S D A Q : V L N S 18LONG TERM MARKE T O PPO RTUNITY
GROWTH RATES OF CANADA VS U.S.
• Canada has grown 12.5% in the 6-months from June to November 2021, growing faster than all U.S. states with over $100 million
in monthly sales(1)
• Canada has grown faster month-over-month than the leading top three U.S. States by total sales from June to November 2021(1)
Growth Rates (Jun-Nov 2021)(1)
12.5%
4.0% 3.3%
1.3%
-1.8%
-5.2% -5.5%
-10.8%
-19.2%
(1) Stifel Financial estimates
T S X : V L N S | N A S D A Q : V L N S 19LONG TERM MARKE T O PPO RTUNITY
CANADIAN MARKET LANDSCAPE
Licensed Cultivators, Processors, & Sellers
in Canada(1)
• There are currently over 800
companies competing in the
Canadian cannabis
marketplace today 1
1
• Valens anticipates that there 8 NFLD
will be bankruptcies and with it 207
opportunities to take market
share in 2022
90
17
• Valens is competing in strategic 8 PEI
35
categories and price points, 271 122
with the known expectation of
further declines in pricing for
dried cannabis 37 Nova Scotia
23 New
Brunswick
(1) Health Canada as of February 5, 2022
T S X : V L N S | N A S D A Q : V L N S
20LONG TERM MARKE T O PPO RTUNITY
CLEAR IDENTIFICATION OF ADVANTAGES
1. One of the most innovative manufacturing platforms in Canada
Fully built and comprehensive manufacturing and distribution platform
which utilizes the latest forms of innovation and automation
2. Strategically positioned downstream from cultivation
Use of contract growing partners combined with spot purchases provides
efficient use of capital during a period of excess capacity and oversupply
3. Valens is an innovation machine in developing new products
Leveraging decades of experience to facilitate the development and
production of in demand products faster than its Canadian competitors
4. Prominently positioned in the US with a top CBD brand
Significant exposure to the US market via Green Roads, a leading CBD brand,
positioned to capitalize on any future changes in regulations
Rightsized for the market today, constantly optimizing for the future
T S X : V L N S | N A S D A Q : V L N S 212021 REVIEW & RECAP TS X : VLNS NASDAQ:VLNS
DELIVERING O N CO MMITME NTS
EXITED 2021 AS A COMPLETELY DIFFERENT COMPANY THAN WHEN VALENS ENTERED

                      Expanded Domestic & Global Footprint:                                        8     Provinces &
                                                                                                         Territories   50            States
                                                                                                                                                         10                  Countries

                                                                                      Corporate                            Shareholder
                      Began Trading on NASDAQ:                                                             Liquidity
                                                                                      Visibility                           Base

                      Entered US Market:                                           Top 10 CBD Brand(1)

                      Expanded into Brands:                                            Edibles                    Flower                            Pre-Rolls

                      Successfully Commissioned K2 & Pommies:                                                Economies of Scale

 (1)   Based on estimates from Brightfield for latest quarterly period (Q3 2021)
                                                                                                                           T S X :   V L N S   |   N A S D A Q :   V L N S         23
2 02 1 REVIEW & RE CAP
VALENS IN THE VALUE CHAIN
Branded products across
specialized categories
CORE OPERATIONS 255 PROVINCIAL LISTINGS ACROSS 5
PRODUCT BRANDED SALES & OWNED BRANDS IN-MARKET TODAY
MANUFACTURING PRODUCTS DISTRIBUTION
RECENTLY ADDED
OPERATIONS
IP portfolio creates a Strong relationships
sustainable competitive with supporting sales
advantage teams generates
strong listing
FORMULATION performance
Scale and efficiency makes
Valens a low cost producer
PURIFICATION
One of the largest
buyers of biomass in 70+ PRODUCTS ACROSS 50 STATES –
Canada The only LP in Canada with
a full suite of extraction
ONLINE + 7,000 RETAIL LOCATION
capabilities
CULTIVATION EXTRACTION / BIOMASS SOURCING
T S X : V L N S | N A S D A Q : V L N S 242 02 1 REVIEW & RE CAP
B2B SALES - FEWER, BIGGER, BETTER
• Engaged in highly-selective and strategic co-manufacturing opportunities designed to:
1 Increase productivity and improve asset utilization
2 Provide services from manufacturing to sales and distribution
3 Simplify relationships with “Fewer, Bigger, Better” strategy
4 Provide platform for CPG branding, marketing and distribution
5 Provide a licensed entryway for top tier consumer brands
T S X : V L N S | N A S D A Q : V L N S 252 02 1 REVIEW & RE CAP
PROVINCIAL SALES - DEMONSTRATED SALES EXECUTION ACROSS INDUSTRY LEADING PRODUCTS
• Valens is one of the fastest growing Canadian LPs by provincial listings - offering consumers and the provinces with the
products they want at attractive price points
Provincial Listings
Province Q1 2021 Q4 2021 Jan 2022
ON 22 52 57
AB 22 56 62
BC 18 35 38
SK 13 27 33
MB 0 33 33
Other 0 16 32
Total Listings 75 219 255
Total Provincially-Listed SKUs 28 78 89
Listings-to-SKUs Ratio 2.7 2.8 2.9
T S X : V L N S | N A S D A Q : V L N S 262 02 1 REVIEW & RE CAP
LARGEST GROWTH IN RETAIL SALES AMONG PEERS
• Valens had the largest Y/Y growth in retail Retail Sales Growth(1)
sales among peers in its largest provincial
Nov-Jan 2022 Nov-Jan 2022
markets
Rank Company Y/Y % Q/Q %
• 374% sales growth Y/Y 1 Valens 374% 40%
• 40% sales growth Q/Q 2 Cronos 112% 25%
3 Auxly 145% 19%
4 Decibel 131% 18%
• Strong progress demonstrates Valens’ clear 5 Organigram 142% 8%
execution ability and success in launching
6 Indiva 72% 8%
and growing its owned brands
7 Village Farms 48% -2%
8 Hexo -10% -9%
9 Canopy -25% -18%
10 Tilray -29% -21%
11 Aurora -58% -22%
(1) As per Hifyre data for Ontario, Alberta, British Columbia and Saskatchewan for the three months ended January 2022 vs the year-ago period, and vs
the prior three-month period T S X : V L N S | N A S D A Q : V L N S 272 02 1 REVIEW & RE CAP
ONE OF THE LARGEST PLAYERS IN ONTARIO – CANADA’S LARGEST MARKET
• Valens has demonstrated success in Ontario,
OCS Market Share of Depletions(1)
Canada’s largest market, achieving the 8th highest
market share of OCS depletions in January 2022 Dec 2021 Jan 2022 M/M
Rank Company % Share % Share Change
1 Hexo 10.85% 10.41% -0.44%
• Strong momentum in January 2022 with the
2 Auxly 8.58% 8.90% 0.32%
largest M/M increase in market share of OCS
depletions among the top 8 players 3 Village Farms 7.58% 7.84% 0.26%
4 Organigram 8.16% 7.29% -0.88%
5 Tilray 6.74% 6.67% -0.07%
• Importantly, the Versus and Contraband products 6 Canopy 5.50% 4.57% -0.93%
were only launched in the last 2 weeks of January 7 Cronos 4.80% 3.51% -1.29%
2022 – placing Valens in a strong position entering
8 Valens 2.82% 3.25% 0.43%
February
(1) As per OCS depletions data in dollars encompassing online sales on OCS.ca and wholesale sales to private retailers
T S X : V L N S | N A S D A Q : V L N S 282 02 1 REVIEW & RE CAP
STRATEGIC ACQUISITIONS COMPLEMENT VALENS ECOSYSTEM
Green Roads Citizen Stash
• One of the oldest and most trusted • Strategic expansion into flower and
brands in the US CBD industry pre-rolls with a strong genetics
library and contract grow network
• Early issues surrounding the B.C.
floods have been largely mitigated
7,000 200,000+ but have still impacted the supply
Retail locations Customers currently opted- chain (i.e., trucking and shipments)
in to Green Road’s email list
Verse LYF Food Technology
• Strategic expansion into the value • Team has 25+ years experience in
segment with a leading brand portfolio food manufacturing, with thorough
spanning all major product categories knowledge in developing innovative
confectionary goods
• Valens has been able to leverage Verse's
innovative product portfolio and value • 20+ products in market today listed
price to showcase the advantages of its across Canada
low-cost, industry leading • Edibles expected to drive 12 - 15% of
manufacturing capabilities provincial and B2B sales in 2022
A W A R D E D T O P E X T R A C T I O N C O M P A N Y T S X : V L N S | N A S D A Q : V L N S 29CHANTEL POPOFF CHIEF OPERATING OFFICER
OPERATIONS : 2 0 2 1 RE V IE W & RECAP
SIGNIFICANT MILESTONES DESPITE A CHALLENGING ENVIRONMENT

      K2 Commissioned         ✓ Enables Valens to leverage its low-cost cannabis platform to drive product sales
                              ✓ Launched flower, pre-rolls, and topicals as new product verticals in 2021
                              ✓ Doubled vape manufacturing capacity in 2021
                              ✓ Installed pre-roll manufacturing equipment with a capacity to produce 8.6MM annually
                              ✓ Installed Nitrotin packing line, with a capacity to produce 720,000 units of 3.5g premium flower offering

   Pommies Commissioned
                              ✓ Provides Valens with a cannabis-infused beverage innovation, manufacturing, and distribution hub
                              ✓ Ability to produce 8+ million units per year on a single shift
                              ✓ Production of both cannabis-infused beverages in cans and PET bottles across various sizes and formats

    Operational Constraints
                              x COVID induced supply chain complications combined with packaging and shipping cost overruns
                              x Navigating a challenging labour market, absentees and utilizing temporary labour staff
                              x Regulatory environment continues to add significant complexities

                                                                                                            T S X :   V L N S   |   N A S D A Q :   V L N S   31
OPERATIONS : BE S T IN CL AS S PRODUCT INNOVATION
ONE OF THE MOST INNOVATIVE & DIVERSIFIED MANUFACTURING PLATFORMS IN CANADA
JANUARY 2021 JANUARY 2022
• Distillate, Full Spectrum • Live Terpenes, Live Resin • Value & Premium offering
• 1g format • 1g format • 3.5g, 7g, 14g, 28g formats
• Doubled manufacturing • Nitrotin Packing Line
capacity • Contract grow allows for
consistent quality
• Commissioned Pommies Facility,
• SoRSE emulsion: water soluble, quick • Fully automated, capable of
capable of 8+ million beverages /
onset, no taste/smell, shelf stable producing 8+ million pre-roll/
year
• 355 ml PET bottles year
• 355 ml resealable cans
• Iced Tea (2 flavours) • 0.35g, 0.5g, 1g formats
• Seltzers (4 flavours)
• Commissioned commercial- • Catalogue of premium flower
• Hydrocarbon, Solvent, & Solventless
scale LYF Facility genetics
• 1g format
• 400,000+ gummies capacity • Access to rare cannabinoids
• One of the first LPs to introduce crumble
• Gummies, Chocolate, (CBN, CBG, CBC THCA)
Confectionary • Continuous IP development
• Access to proprietary transdermal • Sugar Diamonds, Resin, Hash
delivery system
INNOVATION LEADS IN 2021 • Roll-On, Cream, Bath Bombs
• 1g format
T S X : V L N S | N A S D A Q : V L N S 32OPERATIONS : 2 0 2 1 RE V IE W & RECAP
DEMONSTRATED EXECUTION ABILITIES IN RECORD YEAR
• 2021 was an increasingly complex environment for Valens operations team, not only as order flow ramped up significantly but
also due to heightened lead times and costs stemming from the pandemic
January 2021 January 2022 Y / Y Increase
Pallets Shipped 90 290 +3.2x
Work Orders 220 850 +3.9x
International Lead Times(1) 4 weeks 8 - 12 weeks +3.0x
Trucking Costs(2) $4k $12k +3.0x
Sea Freight Costs(3) $5k $30k +6.0x
Number of Full Time
85 152 +1.8x
Production Employees
(1) Average production lead time for shipment from Asia
(2) Average cost for Less Than Truckload shipments from British Columbia to Ontario T S X : V L N S | N A S D A Q : V L N S 33
(3) Average cost for shipping full containers from AsiaOPERATIONS : 2 0 2 1 RE V IE W & RECAP
EXITING 2021 WITH THE BEST POSITIONED ASSET BASE
• One of the premier manufacturing platforms for cannabis in the world, right sized for the current state of the market
• Large investments have been made into automation equipment and best practices which help drive efficiencies
• Platform is highly flexible and is constantly innovating in extraction technology and product manufacturing
• Constraints remain in managing global supply challenges, all things shipping, trucking, and packaging materials
K2
K1
• Location: Kelowna, BC
• Location: Kelowna, BC
• Comprehensive
• Extraction hub inclusive of
manufacturing hub
Ethanol, CO2, and
• Building advanced IP
Hydrocarbon
• Capacity: 8.6MM pre-rolls
Canada
Pommies
LYF
K1 K2
• Location: GTA, ON
Pommies • Location: Kelowna, BC
• Leading beverage
• Leading edible platform
platform
• Capacity: 60.0MM units
• Capacity: 8.0MM units
Note: Capacity figures based on one shift and five days per week, ability to scale as demand increases
T S X : V L N S | N A S D A Q : V L N S 34ADAM SHEA CHIEF COMMERCIAL OFFICER
2 02 2 BUS INES S PL AN
KEY OBJECTIVES FOR CANADIAN PROVINCIAL SALES AND B2B

• Successful transition to branded                • Provincial Sales anticipated to drive 40% - 50% of 2022E
  product sales and finished goods                  revenue
  manufacturing for B2B customers from
                                                       • Provincial listings' growth of 141% from Q1 2021 to Q3
  toll processing and strictly B2B in 18
                                                         2021
  months
                                                       • Listening to the provinces and providing them with
                                                         the products they want – acceptance rates are
  Key objectives for 2022:                               industry best

  1.   Vapes, Edibles, Beverages - Top 5 player        • Big bets on flower, pre rolls, vapes, edibles and
                                                         beverages
  2.   Flower Products – Top 10 player

                                                  • B2B Sales anticipated to be 15 - 25% of 2022E revenue
                                                       • Focus on “Fewer, Bigger, Better”

                                                                                  T S X :   V L N S   |   N A S D A Q :   V L N S
                                                                                                                                    36
2 02 2 BUS INES S PL AN
COMPETING IN EVERY MAJOR CATEGORY & PRICE POINT
FLOWER PRE-ROLL VAPE CONCENTRATES EDIBLES BEVERAGES
PREMIUM
CORE
VALUE
BY THE END OF 2022, VALENS MORE BRANDS ARE EXPECTED TO BE CONTRAST THIS VERY
THIS PORTFOLIO WILL RUN ACROSS
EXPECTS TO HAVE LISTINGS IN EVERY ADDED IN 2023 & 2024 TO SATISFY COMPREHENSIVE PORTFOLIO VS
FOUR KEY BRANDS: VERSUS, CITIZEN
MAJOR CATEGORY ACROSS ALL THE WIDE VARIETY OF CONSUMER JUST TWO YEARS AGO WHEN VALENS
STASH, CONTRABAND & VACAY
THREE MAJOR PRICE POINTS TASTES & REGIONAL PREFERENCES ONLY COMPETED IN VALUE
T S X : V L N S | N A S D A Q : V L N S 372 02 2 BUS INES S PL AN
COVERING THE MARKET WITH A TIGHT SET OF BRANDS
FLOWER PRE-ROLL VAPE CONCENTRATES EDIBLES BEVERAGES
PREMIUM
CORE
VALUE
CITIZEN STASH IS EXPECTED TO CONTRABAND IS VALENS’ FIRST
BUILD ON ITS SUCCESS IN FLOWER & LAUNCHED PREMIUM BRAND IN THE VACAY IS EXPECTED TO CONTINUE TO
VERSUS IS OUR VALUE PLAY ACROSS
PREROLLS & ADD VAPES / FLOWER, PREROLL, VAPE & BUILD ON ITS EDIBLES PORTFOLIO AT
ALL MAJOR CATEGORIES & WILL BE
CONCENTRATES IN 2022, WITH THE CONCENTRATE CATEGORIES. IT IS MULTIPLE PRICE POINTS (DEPENDING
THE OVERALL VOLUME & REVENUE
BRAND BUILDING MIGHT OF VALENS EXPECTED TO BECOME THE GO-TO ON THE FOOD FORMAT) & ADD
LEADER FOR VALENS
BEHIND IT TO GIVE IT THE BOOST IT LIFESTYLE BRAND FOR URBAN BEVERAGES IN 2022
DESERVES MUSIC, FASHION & ART ENTHUSIASTS
T S X : V L N S | N A S D A Q : V L N S 382 02 2 BUS INES S PL AN
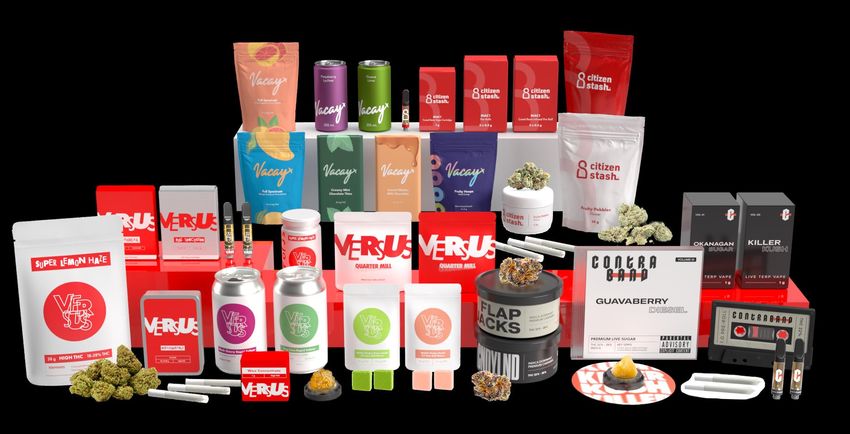
VALENS HOUSE OF BRANDS
T S X : V L N S | N A S D A Q : V L N S 392 02 2 BUS INES S PL AN
PROVINCIAL SALES - CROSS CANADA PENETRATION
• Increasing retail relationships through regulated trade activity and budtender education to drive product awareness
• Current exposure to 80%+ of the Canadian market and actively working for a solution to its footprint in Quebec
Current Retail Footprint
Retail Footprint in Development
S H I N Y B UD
T S X : V L N S | N A S D A Q : V L N S 402 02 2 BUS INES S PL AN
B2B SALES - FOCUS ON FEWER, BIGGER, BETTER
Legacy B2B Business New B2B Business
Working with many LPs and Brand Partners Working with 5 / 7 largest LPs - Fewer, Bigger, Better
• Lack of consistency in order volumes ✓ Commitments for repeated order volumes
• Higher quantity of customer touch points ✓ Less customers leads to less touch points
• Smaller order quantities ✓ Larger order quantities
• Disadvantaged by long term consolidation ✓ Advantage in long term consolidation
• Lower margins and profitability ✓ Higher margins and profitability
T S X : V L N S | N A S D A Q : V L N S
T S X : V L N S | N A S D A Q : V L N S
412 02 2 BUS INES S PL AN
END TO END SOLUTION PROVIDER FOR LARGE SCALE CPG
• OTC CBD sales will likely be permitted in Canada, much the like U.S., opening the door for a significant increase in distribution
• Valens has been working with large CPG companies in the R&D stage to develop products for the market once open
Testing & R&D Commercialization Product Launch
T S X : V L N S | O T C Q X : V L N C F 42QUINN SHISKIN DIRECTOR PRODUCT INNOVATION
2 02 2 BUS INES S PL AN
THE SECRET SAUCE - VALENS IS AN INNOVATION MACHINE

EXTENSIVE MANUFACTURING                 DEEP CANNABIS FORMULATION +                      LOWEST COST EXTRACTION
  ASSETS & TECHNOLOGY                    CPG PRODUCT DEVELOPMENT                           & BIOMASS SOURCING
                                                 EXPERTISE
•   CO2, Ethanol, Hydrocarbon       •   R&D Scientists                               •       Largest Consumer of Flower
    Extraction                      •   Extract Specialists                                  Biomass in Canada
•   Automated Soft Chew Line        •   Cannabis 2.0 Formulation Specialists         •       Lowest Cost Biomass
•   Automated Chocolate Line with   •   Liquid Formulation Specialists               •       Canada’s Largest Extractor
    Filling Capabilities            •   Master Chocolatiers & Bakers                 •       Lowest Cost of Extract in
•   Canning & Bottling Line         •   Confectionary Experts                                Canada (the key input to
•   Automated Pre-Roll Line         •   Tier-1 CPG Level Innovation, Marketing,              Cannabis 2.0 new products)
•   NitroTin Line                       Operations and Supply Chain
•   Vape Filling Line               •   Legacy Market Expertise
•   Topicals Line
                                                                                  T S X :    44
                                                                                            V L N S   |   N A S D A Q :   V L N S
                                                                                                                                    44
2 02 2 BUS INES S PL AN
SELECTION OF 2022 TARGETED INNOVATION
FLOWER PRE-ROLL VAPE CONCENTRATES EDIBLES BEVERAGES
PREMIUM • Flap Jacks 3.5g • 1 x 1g CNDYLND • CNDYLND Cured Resin 1g • 1 x 1g BIG WILLIE Live Resin • 10mg THC Creamy Peanut • Pineapple Mandarin Orange
• Flap Jacks 7g • 1 x 1g Flap Jacks • Flap Jacks Cured Resin 1g Infused Preroll Butter Cup (Half Time by Low Dose Tropical Soda 2mg
• Platinum Cookies 3.5g • 1 x 1g Platinum Cookies • Platinum Cookies Cured • CNDYLND Cured Resin Vacay) THC
• Platinum Cookies 7g • 1 x 1g Oreoz Resin 1g Badder 1g • Key Lime Cherry Low Dose
• Oreoz 3.5g • Oreoz Cured Resin 1g • Platinum Cookies Cured Soda 2mg THC
• Oreoz 7g Resin Badder 1g
CORE
• 14g MAC1 • Citizen Stash Preroll Variety • MAC1 Cured Resin 1g 510 • 2 x 0.5g MAC1 Cured Resin • 10mg THC Creamy Dark • 4-Pack Pineapple Mandarin
• 14g Sunset Sherbert Pack 4 x 0.5g (MAC1, Sunset Thread Vape Cartridge Infused Preroll Chocolate Mint Orange 2mg THC Low Dose
• 14g Fruity Pebbles Sherbert, Fruity Pebbles, • 10mg THC Creamy Milk Soda
• 14g Jungle Breath Jungle Breath) Chocolate Caramel Mocha • 4-Pack Key Lime Cherry 2mg
THC Low Dose Tropical Soda
VALUE
• Super Lemon Haze 28g • BC God Bud 1 x 1g • Citrus OG 1g • White Rhino Wax 1g • Strawberry Mother Puckers • Key Lime Rapid Seltzer 10mg
Whole Flower • Dreamweaver 1 x 1g • Menthol Magic 1g • Super Lemon Haze Wax 1g 10mg THC Super Sour Chews THC
• Black Mountain Skunk • Spr Lemon Hz 1 x 1g • Hoppy Haze 1g • 1 x 1g Distillate Infused Preroll • Peach Mother Puckers 10mg • Mango Rapid Seltzer 10mg
Quarter Mill 7g • Super Lemon Haze 12 x 0.5g • Super Lemon Haze 1g Super Sour Chews THC
• Sun Valley Diesel Quarter Mill • BC God Bud 1g • Apple Mother Puckers 10mg • Black Cherry Rapid Seltzer
7g • Dreamweaver 1g Super Sour Chews 10mg THC
T S X : V L N S | N A S D A Q : V L N S 452 02 2 BUS INES S PL AN
INNOVATION SPOTLIGHT - INFUSED PRE-ROLLS
• As consumers look for new and innovative products in the market, California 2021 Pre-Roll Sales(1)
infused pre-rolls are anticipated to gain market share in Canada
Infused Pre-Rolls Non-Infused Pre-Rolls
• An infused pre-roll is manufactured with a mixture of flower
and concentrates/extracts
46%
• subcategory Valens believes will gain significant traction in the 54%
Canadian market, looking at California, the subcategory represented
46% of all pre-roll sales in 2021(1)
• Infused pre-rolls are growing rapidly, positioned to be
consumers go-to over non-infused in mature markets
California 2021 Y/Y Growth in Pre-Rolls (1)
• Valens is best suited to own this category given its leading expertise 99%
in concentrates/extracts, pre-roll manufacturing, and innovating in
categories where complexities are apparent
5%
Non-Infused Pre-Rolls Infused Pre-Rolls
(1) BDSA data for the California market
T S X : V L N S | N A S D A Q : V L N S 462 02 2 BUS INES S PL AN
INNOVATION SPOTLIGHT - SORSE EMULSION TECHNOLOGY
Failed Emulsion(1)
EMULSIONS ARE NOT CREATED EQUALLY
FAILED EMULSION
• Proven stability of emulsion
• Low sensory impact (cannabis taste free)
• Repeatable experience 12
Months
SōRSE Emulsion(1)
SōRSE BY VALENS - PROVEN STABILITY
• No creaming, clarification or sedimentation
• First sip is the same as your last, complete
12
homogeneity Months
(1) SoRSE Technology
T S X : V L N S | N A S D A Q : V L N S 47JEFF FALLOWS PRESIDENT
2 02 2 BUS INES S PL AN
US CBD MARKET POSIED FOR GROWTH

• The U.S. CBD market presents a compelling opportunity                U.S. CBD MARKET FORECAST (C$B)(2)
       • Significant revenue growth potential
       • Strong gross margins (50%+)
       • Strategic entry into the U.S. ahead of regulatory                                                                         $14.8
         changes that can create a demand explosion                                                                  $13.3
       • Increased access to international markets with fewer
                                                                                                    $11.6
         regulatory restrictions on export
                                                                                     $9.4
• Consolidation and industry shake-up is creating
                                                                              $7.2
  opportunity
                                                                $5.7   $5.9
       • ~3,500 companies at peak to under 2,000(1) today
       • Mass Covid-related shutdowns will benefit (and is
         already benefiting) the larger players in the market

• The timing is ideal for a Valens push into the U.S. market
                                                                2020   2021   2022   2023           2024            2025           2026

 (1) Brightfield “US CBD Competitive Landscape”
 (2) Brightfield CBD Industry Analysis                                               T S X :   V L N S   |   N A S D A Q :   V L N S       49
2 02 2 BUS INES S PL AN
THE GREEN ROADS BRAND IS STRONG AND WELL POSITIONED
• The Green Roads brand continues to perform well Sales Per $MM ACV of the Top 5 Brands(1)
despite limited investment in the last two years
• An industry leader in terms of brand $600 $565
awareness Green Roads has one of the highest
sales per retailer where the brand is
• Strong ability to convert awareness and $500 sold
consideration to purchase $415
• Creates value for carrying retailers $400
Aware : Aware : Consider : $300
Consider Purchase Purchase
Brand % Rank % Rank % Rank $200 $172 $168
$140
$121
CBD Brand 1 69.1% 1 45.3% 1 65.6% 2 $100
CBD Brand 2 58.0% 2 37.3% 2 64.4% 4
$0
CBD Brand 3 55.7% 3 32.2% 5 57.8% 29
CBD Brand 4 51.9% 4 34.2% 3 65.8% 1
Green Roads 50.8% 5 33.2% 4 65.3% 3
(1) Nielsen, 52 weeks ending September 11, 2021. Represented in USD. ACV stands for “all commodity volume”. Chart displays retail sales by brand per
million dollars of ACV for the stores that sold the brand’s items. T S X : V L N S | N A S D A Q : V L N S 502 02 2 BUS INES S PL AN
WE HAVE BEEN BUSY – NOW POSITIONED FOR SIGNIFICANT REVENUE GROWTH
Initiative Rationale
✓ Solution-based products simplify the consumer buy decision and allow us to
1. Maximize the strength of the Green Roads brand
interact with them every day
✓ Market has shifted and so has where consumers look for CBD-based health and
2. Distribution channel review and alignment
wellness products
✓ Simplified portfolio with greater focus on target areas and “Solutions” which
3. Full portfolio product review and rationalization
brought new formats and pricing strategies designed for each channel
4. Enhance online infrastructure ✓ Green Roads now has one of the most prolific online infrastructure in the space
5. Team support and buildout ✓ Key positions and experience being added to drive the go forward strategy
✓ Cross border relationships introduced to drive new B2B business while
6. Cross platform collaboration to drive value
operational and supplier challenges were solved to manage target volumes
T S X : V L N S | N A S D A Q : V L N S 512 02 2 BUS INES S PL AN
SELLING SOLUTIONS – IT’S MORE THAN JUST SELLING CBD … SO MUCH MORE
We believe you
can do more
than just “get
through” the
day. We believe
you can OWN it.
And we’re here
to help
T S X : V L N S | N A S D A Q : V L N S 522 02 2 BUS INES S PL AN
THREE PATHWAYS TO MARKET – RETAIL, ONLINE AND WHITE LABEL
• Opportunities for significant growth are available in each path Revenue Segmentation
• Growth drivers differ and require considerable operational 2021 2022
efficiency and coordination across the business 5% 5%
35%
35%
• Contribution is expected to change as the online business gains
momentum 60%
60%
• Brand campaign to drive volumes at Retail and Online
• Sophisticated on-line marketing strategy and E- Online Retail B2B
commerce platform to generate outsized growth
Estimated Product Breakdown
• White label business offers low hanging fruit Gummies 30.0% - 40.0%
• Opportunities to leverage Valens cross border and other Topicals 15.0% - 25.0%
relationships
Oils 15.0% - 20.0%
• Asset utilization and sharing of overhead burden to
support strong margin performance Vapes 8.0% - 12.0%
Capsules 7.5% - 12.5%
Other 5.0% - 10.0%
T S X : V L N S | N A S D A Q : V L N S 532 02 2 BUS INES S PL AN
RETAIL STRATEGY – BRICK-AND-MORTAR LOCATIONS
1. Strategies must be channel specific – one size does not fit all Green Roads Channel Review
• Target the channels that best position our Solutions
Channel Target
• Align products, formats and pricing strategies
• Experienced salespeople paired with strategic broker Smoke & Vape Defend and Grow
relationships
Independent Pharmacies Defend and Grow
2. Capitalize on existing brick-and-mortar retail relationships as Medical and Specialty Defend and Grow
the market awakens from COVID
• 7,000+ doors - early signs are positive Convenience Expand Presence
Food & Mass Expand Presence
3. Identify and penetrate new retail relationships in target
channels
Chain Pharmacy Penetrate
• Differentiated Solutions offering is well positioned
Vitamin & Natural Penetrate
4. Support retail strategy roll-out with effective marketing
assets Pet Penetrate
• Promotional and education materials
• In store support with new products and starter bundles
T S X : V L N S | N A S D A Q : V L N S 542 02 2 BUS INES S PL AN
RETAIL STRATEGY – ONLINE D2C
1. Green Roads first ever brand campaign launched in
January 2022 – “Own The Day”
2. Online strategy was synchronized with the launch TM TM
• Search, affiliate, email, social, programmatic bidding
3. Strategies designed to attract consumers at all levels of the
funnel TM TM TM
• One simple objective: drive consumers to Green
Roads website
4. Smart marketing spend and focused execution is already
driving growth TM TM TM
• 13MM users reached with over 40MM impressions
• Organic web sessions are up by more than 15%
• Conversion rate on website already showing growth
T S X : V L N S | N A S D A Q : V L N S 55SUNIL GANDHI CHIEF FINANCIAL OFFICER
2 02 2 BUS INES S PL AN
REVENUE SEGMENTATION

                     Retail/B2C Segments
           Provincial Sales                Green Roads /            B2B                                       Other
                                           International

              40 - 50%                       25 - 35%            15 - 25%                                     2 - 5%

                                                                5 of the top 7
                                                                Canadian LPs

                                                           TM

           PARTNER BRANDS

                                                                            T S X :   V L N S   |   N A S D A Q :   V L N S   57
2 02 2 BUS INES S PL AN
COST SYNERGIES AND OPTIMIZATION
The next phases of our ‘Launch, Grow, Optimize’
strategy are well underway after a highly successful
‘Launch’ phase that positioned Valens as a leading
2021 was a highly transformational year for cannabis consumer products company
Valens including the integration of strategic
acquisitions: Optimization strategies are underway and $10MM in
annual cost efficiencies have been identified through
operational process efficiency gains, reductions in
manufacturing and sourcing costs, organizational
realignment and realization of M&A synergies
Valens is targeting additional annual cost efficiencies
of $10MM and monetization of $5 - 10MM in surplus or
unnecessary assets and tighter working capital
management by the end of 2022
Valens has now entered the ‘Grow &
Optimize’ phases of its strategy, with
significant cost savings identified for 2022
T S X : V L N S | N A S D A Q : V L N S
582 02 2 BUS INES S PL AN
INITIAL $10MM OF COST EFFICIENCIES IDENTIFIED
Breakdown of Initial Cost Efficiencies
Initiative Estimated Range
Organizational Realignment and M&A Synergies $2MM - $4MM
Optimized Sourcing of Input Costs $3MM - $4MM
We are now capturing the first wave of
synergies through operational and
Automation & Process Improvements $3MM - $4MM
organizational changes that will not only
Total $10MM
improve our efficiencies but also drive Management overlap, back-office support, centralization
the business towards becoming EBITDA of labour to Kelowna K1/K2
positive in fiscal Q4 2022 Centralized bulk sourcing and purchasing of biomass
and other inputs reduces costs and improves quality
Automation and process improvements drive down
labour and inventory costs and increases throughput
T S X : V L N S | N A S D A Q : V L N S 592 02 2 BUS INES S PL AN
M&A INTEGRATION PROGRESS
FINANCIAL SYSTEMS OPERATIONS COMMERCIAL COMMENTS
• Successfully licensed and commissioned
• Supply chain, regulatory and quality processes
in place
• ERP implementation complete
• Operating at high capacity
• Successful launch of numerous new products,
both Valens branded and B2B
• ERP integration underway
• Retail distribution plan underway
• New international export pathways unlocked
• ERP integration planned
• New products launched
• Transition of brand to Versus underway
• Packaging and pre-roll production moved to K2
• Rationalization of products underway
• ERP integration underway
602 02 2 BUS INES S PL AN
COST EFFICIENCIES THROUGH OPTIMIZED BIOMASS SOURCING AS THE MOST SIGNIFICANT INPUT COST
• Valens is unique relative to other Canadian licensed producers in that it doesn’t own or operate material cultivation operations,
instead choosing to source biomass from a diversified network of growers
• Acquisition of Citizen Stash brought its network of craft contract growing partners into Valens sophisticated ecosystem
Source Biomass from Diversified Demand Driven Asset Light, Cost
Network of Growers Supply Chain Efficient Sourcing
1. Leverage position as one of the largest
bulk purchasers of biomass in the
Canadian market – centralized
purchasing increases buying power
Greenhouse, 2. Balance spot biomass purchases with
Indoor and longer term contract growing
Outdoor arrangements to ensure consistency of
supply at predictable prices.
T S X : V L N S | N A S D A Q : V L N S 612 02 2 BUS INES S PL AN
COST EFFICIENCIES THROUGH ENHANCED AUTOMATION & PROCESS IMPROVEMENT
• During 2021, Valens was focused on launching new products in the various provinces which was initially supported by largely
manual processes
• In 2022, the focus has shifted to automation & standardized processes which are expected to have a positive impact as follows:
1 2 3 4
Reduced Labour Cost Per Unit Increased Production Capacity Higher OTIF Rates Optimized Inventory Levels
Automated equipment reduces Higher throughput will allow Higher production run speeds and Higher capacities and run speeds
reliance on manual labour, Valens to meet the strong more consistency will enable will allow Valens to better optimize
reducing staffing costs and consumer demand for its products higher OTIF rates with provincial inventory levels, boosting the
expanding margins – driving higher revenue over its distributors – reducing missed overall efficiency of its operating
existing cost base sales opportunities and facilities and improving working
maximizing the value of our capital management
distribution footprint
T S X : V L N S | N A S D A Q : V L N S 622 02 2 BUS INES S PL AN
IMPROVING MANAGEMENT OF WORKING CAPITAL
• Valens expects to see a gradual decline in its accounts A/R and Inventory as a % of Quarterly Revenue(1)
receivables as a % of revenue throughout 2022
Accounts Receivables Inventory
• Receivables were elevated in 2021 as B2B composed a
substantial portion of the historical revenue base, but 220%
the ongoing shift toward B2C revenue is expected to Gradual Declines Expected With
drive a consistent decline in accounts receivables 200% Increasing B2C Revenue and
balances as a % of revenue Normalization of Inventory Levels
180%
160%
• Inventory is another area where Valens expects to drive
improvement in 2022 140%
• By the end of 2022, the company is targeting more 120%
normalized inventory levels of ~90 days on hand
100%
Q3/21 Q4/21 Q1/22 Q2/22 Q3/22 Q4/22
(1) Chart displays trade and other receivables, and inventory from published financial statements as a percentage of net revenue generated in the
given quarter T S X : V L N S | N A S D A Q : V L N S 632 02 2 BUS INES S PL AN
MAJOR CAPITAL PROJECTS COMPLETED, ANNUAL RATES OF EXPENDITURE TO NORMALIZE IN 2022/2023
• Valens has invested heavily into its world class facilities and is well positioned to take advantage of its buildout
• Remaining expenditures in 2022 and 2023 relate to automation equipment to drive efficiencies and margin improvement as
well as investments in ERP and data analytics platforms
$25.0
$23.4
$20.2 $20.0
$20.0
Capital Expenditure ($MM)
$15.0
$15.2
$10.0
$5.7
$5.0 $4.0 $3.5
$0.0
2018 2019 2020 2021 2022 2023
Note: Valens has already incurred $15.2M in capital expenditure in the first three quarters of fiscal 2021. Upper end of range has been provided for Q4
estimates T S X : V L N S | N A S D A Q : V L N S 642 02 2 BUS INES S PL AN
THE PATHWAY TO PROFITABILITY AND POSITIVE CASH FLOW
• Valens expects to achieve positive EBITDA in Q4/22 through strong Expected Cadence of Financial Results
revenue growth and sustainable margin expansion as follows:
• First wave of cost efficiencies expected to be realized in Q2 2022
with most of the impact falling in the H2FY22
• Benefits of enhanced automation are expected to be realized as
early as H1FY22, with further benefits through the year
• Margin benefit of optimized sourcing is expected to be reflected in
H2FY22 financial results
• Key ingredients are in place to put Valens on track towards
decreasing the current level of cash burn and achieving positive
cash flow Q1/22 Q2/22 Q3/22 Q4/22
• Improved profitability Net Revenue Gross Profit EBITDA
• Improvements in working capital management
• Reduced planned capital expenditures
• Valens is in a solid position having raised $40MM in December 2021
T S X : V L N S | N A S D A Q : V L N S 65JEFF FALLOWS PRESIDENT
2 02 2 BUS INES S PL AN
VALENS HAS BEEN FOCUSED ON DRIVING SHAREHOLDER VALUE

• Valens has achieved the highest revenue per dollar                                                                       Cannabis Revenue per Dollar Invested(1)
  invested amongst its peers(1)

• Achieved through the following key initiatives:                                                         140%

                                                                                                           120%
1.     Investing in strategically important and high                                                                                                         Investing in the right assets
       return assets and opportunities                                                                                                                         and opportunities drives
                                                                                                          100%                                              long term shareholder value
2.     Driving revenue growth through industry leading
       product innovation                                                                                  80%

3.     Higher penetration into flower products utilizing
                                                                                                            60%
       an asset-light approach

4.     Increased operational outputs and efficiencies                                                      40%
       through higher asset utilization and automation
                                                                                                            20%

                                                                                                             0%
                                                                                                                     VLNS       LP 1      LP 2      LP 3       LP 4         LP 5         LP 6          LP 7      LP 8

 (1)   Company filings, S&P Capital IQ. Chart displays the ratio of incremental cannabis revenue generated to the net amount of equity capital raised and
       invested by the respective company since January 2017                                                                                                   T S X :   V L N S   |   N A S D A Q :   V L N S          67
UNDERS TANDING TH E V AL UATION GAP
FACTORS LEADING TO THE VALUATION GAP BETWEEN VALENS AND OTHER LPs
EV EV / 2022E Portfolio of Exposure to Full Pathway to
(C$MM)(1) Revenue(1) Dual Listing US Exposure Brands Canadian TAM Profitability
$180 1.0x
$4,182 4.8x
TM
$3,770 6.2x
TM
$1,085 4.2x
TM
$607 2.3x
TM
$501 3.4x
TM
$405 2.7x
TM
Targeted areas where Valens intends to close the loop to narrow valuation gap vs other large/mid cap Canadian LPs
T S X : V L N S | N A S D A Q : V L N S 68
(1) S&P Capital IQ as of January 31, 20222 02 2 BUS INES S PL AN
POSITIONED TO CLOSE THE VALUATION GAP
The Valuation Gap Closing the Valuation Gap (EV / 2022E Revenue)(1)
Valens trades at 1.0x EV / 2022E Revenue compared
to average cannabis peers at 3.6x(1) 3.6x
KPI Execution to Close the Gap
1. Fundamentals focused: Short-term voting machine,
long-term weighing machine
2. Revenue growth: as provincial sales growth 1.0x
materializes Valens deserves a higher multiple
3. EBITDA positivity: higher EBITDA margins through the
deployment of production automation and efficiencies
4. US development: deeper involvement in the large US
market, through CBD or other CPG channels
(1) S&P Capital IQ as of January 31, 2022. Average cannabis peers refers to the US Listed Canadian LPs cohort in Appendix B
T S X : V L N S | N A S D A Q : V L N S 69TYLER ROBSON CHIEF EXECUTIVE OFFICER & CHAIRMAN
S UMMARY & CO NCL US IO N

                            T S X :   V L N S   |   N A S D A Q :   V L N S   71
QUES TIONS AND CO MME NTS
T S X : V L N S | N A S D A Q : V L N S 72APPENDIX A
SECTOR COHARTS
Category
Soft Drink Coca-Cola
Beer AB Inbev
Tobacco Philip Morris International
Cannabis Curaleaf
Coffee Starbucks
Wine Constellation
Spirits Diageo Brands
Digital Entertainment Comcast
Craft Beer Boston Beer
Chocolate Mondelez International
Bottled Water Nestle
OTC Pain Medication Johnson & Johnson
Gums & Mints Mondelez International
T S X : V L N S | N A S D A Q : V L N S 73You can also read