INVESTIGATING THE ROLE OF CEREBELLAR PURKINJE CELLS IN CONTROL OF THE TONGUE IN MARMOSETS
←
→
Page content transcription
If your browser does not render page correctly, please read the page content below
INVESTIGATING THE ROLE OF
      CEREBELLAR PURKINJE CELLS IN
       CONTROL OF THE TONGUE IN
              MARMOSETS

                                 by
                           Nikhil Dave

A thesis submitted to Johns Hopkins University in conformity with the
   requirements for the degree of Master of Science in Engineering

                        Baltimore, Maryland
                             May 2021

                        © 2021 Nikhil Dave
                         All rights reserved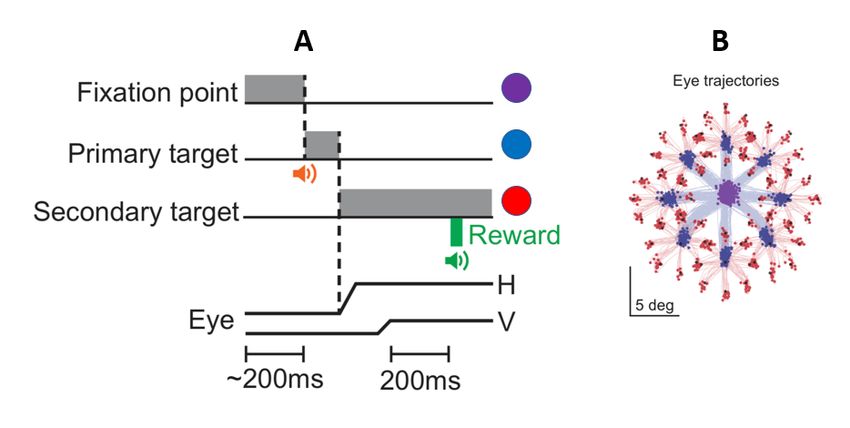
Abstract
The common marmoset (Callithrix jacchus) is a promising non-human primate model for studying

cerebellar contributions to motor control. Critical in many of the marmoset’s behaviors, marmosets use

their specialized tongue to feed and even send visual cues to potential mates. The objective of this

analysis is to elucidate the characteristics of marmoset licking behavior within the framework of our

experimental setup and to provide a characterization of marmoset cerebellar Purkinje neuron responses

to licking behavior at both a cellular and population level. Recording cerebellar Purkinje cells (P-cells) in

awake marmoset subjects completing saccade related tasks, tongue movements were recorded using a

video camera and tracked. In total, 63 Purkinje cells were recorded from lobule VI of the marmoset

cerebellum and analyzed. Analysis was done on Purkinje cells identified as tongue related through visual

and auditory feedback during recording. The simple spike firing rates of these cells were compared to

tongue behavior quantified through tracking. It was observed that P-cells differ in their simple spike

modulation from a baseline firing rate in response to the onset of licking bouts. Rhythmically firing P-

cells were observed to differ in their phasic relationship to rhythmic licking.

Thesis Readers

Dr. Reza Shadmehr, PhD (Principal Investigator)
        Professor
        Department of Biomedical Engineering
        Johns Hopkins University

Dr. Joshua Vogelstein, PhD
        Assistant Professor
        Department of Biomedical Engineering
        Johns Hopkins University

Dr. Kechen Zhang, PhD
        Associate Professor
        Department of Biomedical Engineering
        Johns Hopkins University

                                                      ii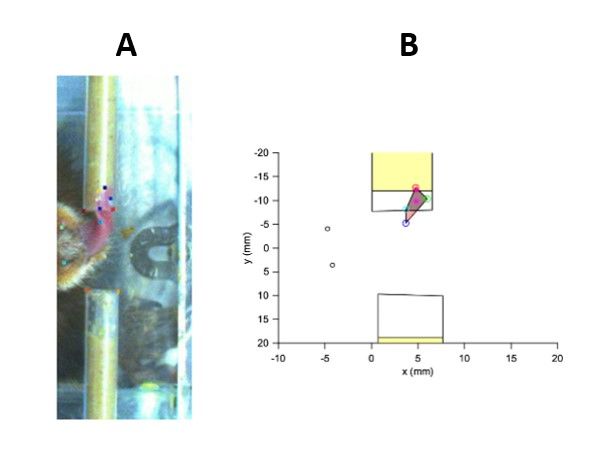
Acknowledgements
The work reported in this paper was supported by grants from the National Science Foundation (CNS-

1714623), the NIH (R01-EB028156, R01-NS078311), and the Office of Naval Research (N00014-15-1-

2312).

This work would not be possible without the contributions of lab members at the Laboratory for

Computational Motor Control at Johns Hopkins School of Medicine. A tremendous amount of work was

done by members of the Laboratory for Computational Motor Control in caring for the marmoset

subjects used in this analysis. Members of the lab were responsible for creation of the experimental

setup. Paul Hage, Ehsan Sedaghat-Nejad, and Jay Pi were all responsible for the electrophysiological

recording of the marmoset subjects. Paul Hage, Jay PI, Ehsan Sedaghat-Nejad, and Dr. Reza Shadmehr

sorted the Purkinje cell data in preparation for analysis. In Kyu Jang was responsible for enabling the 3-D

markerless pose estimation used to quantify marmoset lick movements. Vivian Looi was responsible for

ensuring the quality of the markerless tracking. Without all of their contributions, this work would not

be possible.

I would like to acknowledge the leadership and mentorship of Paul Hage throughout development of

this work. Paul Hage’s coordination of a team effort to tackle the investigation of marmoset licking

behavior was integral in making this work possible. His guidance and mentorship were essential for the

formation of this thesis. Paul, it was a joy to work with you throughout my time at the lab. Thank you for

helping me become a better engineer and scientist.

I would also like to thank Dr. Reza Shadmehr for this mentorship throughout my time as a master’s

student in the lab. His willingness to work with and mentor new students despite roadblocks posed by

                                                     iii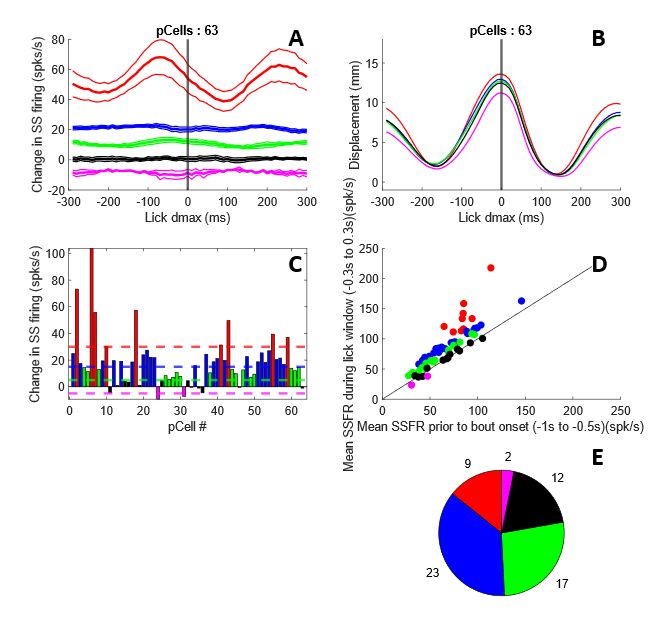
the COVID-19 pandemic was sincerely appreciated. Dr. Shadmehr’s guidance was instrumental in the

formation of this thesis.

Finally, I would like to acknowledge Ehsan Sedaghat-Nejad for his help in creating the analytical

framework used in this analysis.

                                                    iv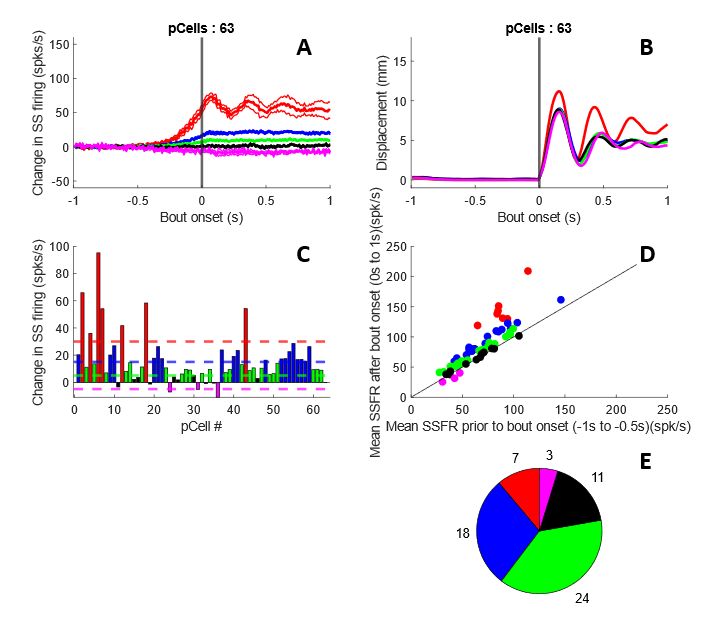
Dedication
This thesis is dedicated to my mother, father, and sister for their love and support.

                                                     v
Contents
Abstract ......................................................................................................................................................... ii
Acknowledgements...................................................................................................................................... iii
Dedication ..................................................................................................................................................... v
List of Figures ............................................................................................................................................. viii
Chapter 1. Introduction ................................................................................................................................ 1
1.1 Lingual Anatomy ................................................................................................................................. 1
1.1.1 Musculature ................................................................................................................................. 1
1.1.2 Innervation ................................................................................................................................... 1
1.1.3 Behavioral Coordination .............................................................................................................. 2
1.2 Feeding Behavior ................................................................................................................................ 2
1.2.1 Appetitive and Consummatory Stages......................................................................................... 2
1.2.2 Feeding Electromyography (EMG) Studies .................................................................................. 2
1.3 Temporal Sequence of the Consummatory Response and Spatial Mapping in the Brainstem .......... 3
1.4 Rhythmic Oromotor Movement ......................................................................................................... 4
1.4.1 Types of Movements.................................................................................................................... 4
1.4.2 Rhythmic Oromotor Behavior ...................................................................................................... 4
1.5 Central Pattern Generators (CPG) Contribution to Rhythmic Movement .......................................... 5
1.5.1 Central Pattern Generators (CPGs) .............................................................................................. 5
1.5.2 Rhythmic Licking and CPGs .......................................................................................................... 5
1.6 Cerebellum’s Contribution to Oromotor Movements ........................................................................ 7
1.6.1 Rat Cerebellectomy and Inactivation Studies .............................................................................. 7
1.6.2 Guinea Pig Ablation Studies ......................................................................................................... 7
1.6.3 Cerebellum and Oromotor Movement ........................................................................................ 8
1.7 Spatial Representation of Lingual System in Primate Cerebellum ..................................................... 8
1.7.1 Non-Human Primate Stimulation Electromyography (EMG) Studies .......................................... 8
1.8 Dysfunctional Cerebellum Effect on Oromotor Control ..................................................................... 9
1.8.1 Dysarthria (Motor Speech Disorder) ............................................................................................ 9
1.8.2 Dysphagia (Swallowing Disorder)............................................................................................... 10
1.9 Marmoset Model .............................................................................................................................. 10
1.9.1 Geography .................................................................................................................................. 10
vi1.9.2 Characteristics and Lifespan ...................................................................................................... 11
1.9.3 Contribution of Tongue Control in Critical Behaviors ................................................................ 11
1.9.4 The Marmoset Brain .................................................................................................................. 12
1.10 Specific Aims ................................................................................................................................... 13
Chapter 2. Materials and Methods ............................................................................................................. 14
2.1 Experimental Setup ........................................................................................................................... 14
2.2 Identifying Tongue Related Purkinje Cells ........................................................................................ 17
2.3 Tongue Tracking Using DeepLabCut (DLC) ........................................................................................ 18
2.4 Data Preprocessing ........................................................................................................................... 19
2.5 Psort: Open-Source Cerebellar Neurophysiology Software.............................................................. 19
2.6 Data Postprocessing .......................................................................................................................... 20
Chapter 3. Results ....................................................................................................................................... 24
3.1 Investigating P-cell Response Properties to Lick Behavior ............................................................... 28
3.2 Categorizing P-cells Based on their Response Properties to Lick Bouts ........................................... 29
3.3 Categorizing P-cells Based on their Response Properties to Lick dmax............................................ 31
3.4 Categorizing P-cells Based on Directional Response to Licking ........................................................ 33
3.5 Identifying P-cell Responses to Licking as Non-rhythmic or Rhythmic ............................................. 35
3.6 Phasic Analysis of Simple Spike Firing Rates ..................................................................................... 38
Chapter 4. Discussion .................................................................................................................................. 45
Reference List.............................................................................................................................................. 49
viiList of Figures
Figure 2-1. The experimental setup. ........................................................................................................... 14
Figure 2-2. Task design and saccade results. .............................................................................................. 16
Figure 2-3. Example of tongue tracking. ..................................................................................................... 18
Figure 3-1. Median lick characteristics for unique recorded cells. ............................................................. 25
Figure 3-2. Median lick kinematic characteristics for unique recorded cells. ............................................ 26
Figure 3-3. Median lick bout characteristics. .............................................................................................. 27
Figure 3-4. Categorizing P-cells based on their response properties to lick bouts..................................... 29
Figure 3-5. Categorizing P-cells based on their response properties to lick dmax. .................................... 31
Figure 3-6. Categorizing P-cells Based on Directional Response to Licking. ............................................... 33
Figure 3-7. Identifying P-cell Responses to Licking as Non-rhythmic or Rhythmic. .................................... 35
Figure 3-8. Distribution of frequencies (Hz) at max power (dB). ................................................................ 36
Figure 3-9. Phase difference between simple spike firing rates and tongue tip displacement.................. 38
Figure 3-10. Normalized SSFR signals corresponding to cells categorized as laggers, in-phase, leaders,
and anti-phase. ........................................................................................................................................... 40
Figure 3-11. Mean normalized simple spike firing rate and tongue tip displacement of cells categorized
into laggers, in-phase, leaders, and anti-phase groups overlayed with respect to max displacement of
licks (dmax). ................................................................................................................................................ 41
Figure 3-12. Mean tongue tip displacement and velocity of rhythmic cells overlayed with normalized
SSFR of laggers, in-phase, leaders, and anti-phase groups with respect to max displacement of licks
(dmax). ........................................................................................................................................................ 42
Figure 3-13. Mean tongue tip displacement and velocity of rhythmic cells overlayed with normalized
SSFR of laggers, in-phase, leaders, and anti-phase groups with respect to max velocity of licks (vmax). . 43
Figure 3-14. Mean tongue tip displacement and velocity of rhythmic cells overlayed with normalized
SSFR of laggers, in-phase, leaders, and anti-phase groups with respect to max velocity of licks (vmin). .. 44
viiiChapter 1. Introduction
1.1 Lingual Anatomy
1.1.1 Musculature (Kim & Naqvi, 2020)
Lingual anatomy is characterized by its complex musculature involving intrinsic and extrinsic muscles.
The four extrinsic muscles are the genioglossus, hyoglossus, styloglossus, and the palatoglossal. The
genioglossus is responsible for drawing the tongue forward from the root of the tongue. The hyoglossus
muscle is used to retract the tongue and depress its sides. The styloglossus muscle’s role is to draw the
tongue upward. The palatoglossal muscle is responsible for raising the posterior region of the tongue
(Rathee & Jain, 2020).
The four intrinsic muscles are the superior and inferior longitudinales, verticalis, and the transversus (Lin
& Barkhaus, 2009). These muscles function to change the shape of the tongue by shortening, curving,
and narrowing its shape (Lin & Barkhaus, 2009).
1.1.2 Innervation (Kim & Naqvi, 2020)
The tongue musculature is innervated by the efferent hypoglossal nerve. The hypoglossal nerve
originates from the lower medulla in the brainstem and migrates down to the tongue. It is also referred
to as the 12th cranial nerve (CN XII) and is primarily a motor, somatic nerve. This nerve innervates all the
intrinsic and extrinsic muscles with exception to the palatoglossal muscle of the tongue. The
palatoglossal muscle is motor innervated by the vagal nerve (CN X).
11.1.3 Behavioral Coordination
The tongue’s multiple functions in different behaviors such as chewing, swallowing, speech, and
breathing typically involves coordination and coupling between multiple neural systems and
musculature. Along with tongue involvement, chewing requires the coordination of face and jaw
muscles. Similarly, swallowing involves coordination with the pharynx and speech with the larynx. Even
more complex, breathing involves synchrony of respiratory muscles in the diaphragm, abdomen, neck,
and ribs.
1.2 Feeding Behavior
1.2.1 Appetitive and Consummatory Stages (Travers et al., 1997)
When describing feeding behavior, it can be generally defined as having appetitive and consummatory
stages. Appetitive movements, in regard to their motor function, are both highly adaptable and diverse.
In contrast consummatory movements are highly stereotyped, if not completely reflexive. While
fundamental movements, like licking, are generally invariant, they are still receptive to stimuli like
accessibility (Marowitz & Halpern, 1973), taste (Davis & Smith, 1992), and aversive stimuli (Wiesenfeld
et al., 1977). The latter is capable of suspending licking behavior after it is initiated, however,
downstream movements like swallowing are typically reflexive and will continue to completion once
initiated (Wiesenfeld et al., 1977).
1.2.2 Feeding Electromyography (EMG) Studies (Travers et al., 1997)
Electromyography studies examining feeding behavior have elucidated the adaptability of licking in rat
animal models (Travers & Norgren, 1986). Researchers have recorded EMG data from four different oro-
pharyngeal muscles, specifically the genioglossus, anterior digastric, styloglossus, and pharyngeal
2constrictor muscles responsible for tongue protrusion, jaw opening, tongue retraction, and swallowing
respectively, in two experimental conditions (Travers & Norgren, 1986). In the first case, the recordings
correspond to behavior in which animals licked from a water bottle (Travers & Norgren, 1986). In the
second case, animals were delivered food via intra-oral cannula forcing them to lick intra-orally (Travers
& Norgren, 1986). Comparing the data from both cases, the experimenters concluded that there
appears to be a common masticatory-lingual motor pattern typified by a tongue protrusion and jaw
opening phase followed by a tongue retraction and jaw closing phase (Hiiemae & Crompton, 1985). The
timing this motor pattern appears to differ according to specific behavioral demands and illustrates the
adaptability of licking as a mechanism for retrieval and intra-oral transport (Halpern, 1977).
1.3 Temporal Sequence of the Consummatory Response and
Spatial Mapping in the Brainstem (Travers et al., 1997)
The temporal sequence of the consummatory response is as follows peri-oral (jaw opening), licking, and
swallowing. In this order these movements are characterized as being the most flexible and adaptable to
being the most reflexive, with jaw opening being the most adaptable and swallowing being the most
reflexive. Additionally, each of these behaviors are possibly spatially organized in the brainstem to some
degree. Peri-oral function involves the most rostral sites and also involves the anterior medullary and
pontine circuits. Licking function involves circuits immediately caudal to the ones corresponding to jaw
opening function and relies on complex multisynaptic RF pathways. Caudal to the circuits corresponding
to peri-oral function are those required for the generation of swallowing behavior. These medullary
circuits have some overlap with those for licking. Additionally, swallowing involves direct projections
from NST neurons to esophageal motoneurons in the nucleus ambiguous (Cunningham & Sawchenko,
1989). These NST neurons receive input from the superior laryngeal nerve (Cunningham & Sawchenko,
1989).
31.4 Rhythmic Oromotor Movement
1.4.1 Types of Movements
When describing movements three categories are used: reflexive, voluntary, and rhythmic (Bryant,
2010). Reflexive movements are defined as being the simplest type of movement and are involuntary in
nature (Hooper, 2001). These types of movements can be described as stereotyped and require a
sensory input to illicit a response. Such sensory inputs require no threshold to be surpassed but must
have a stimulus large enough to activate the relevant sensory pathway (Hooper, 2001). Corresponding
to their distinction as the simplest type of movement, reflexive movements do not require higher brain
centers to take place (Bryant, 2010). In contrast, voluntary movements are goal-driven and are
characterized by directed movements like reaching for example (Hooper, 2001). These movements are
more complex and are not stereotypical or repetitive (Hooper, 2001). As opposed to reflexive
movements, voluntary movements can be improved through learning and repetition (Bryant, 2010).
Rhythmic movements incorporate aspects of both reflexive and voluntary movements making them an
interesting point of study (Bryant, 2010). Uniquely, they are considered to be complex in contrast to
reflexive movements and both repetitive and stereotyped in contrast to voluntary movements (Hooper,
2001). Rhythmic motor patterns typically involve the activation of either the brainstem or spinal cord
and can be initiated by external, goal-oriented stimulus (Bryant, 2010).
1.4.2 Rhythmic Oromotor Behavior
Rhythmic oromotor behavior is comprised of a number of different related movements as exemplified
by the ingestion process (Hooper, 2001). The motor patterns associated with this process are
characterized by a distinct sequence of movements coordinating a variety of anatomical structures
including but not limited to the tongue and jaw (Travers et al., 1997). Looking closely at the
4consumption of food, regardless of the type of food (solid versus liquid), the expression of common
motor patterns is conserved (Hiiemae & Crompton, 1985; Threxton, 1992; Travers et al., 1997; Zeigler,
1991). While mastication involves the strategic repositioning of food during chewing and the
corresponding continuous sensory monitoring, consumption of liquid foods via licking is relatively simple
(Travers et al., 1997). With that said, rhythmic licking still involves the coordination of jaw opening,
tongue protrusion, tongue retraction, and jaw closing (Bryant, 2010). This behavior is strongly
stereotyped and appears to be conserved across numerous mammalian species (Bryant, 2010).
1.5 Central Pattern Generators (CPG) Contribution to
Rhythmic Movement
1.5.1 Central Pattern Generators (CPGs)
Central pattern generators, or CPGs, are neural networks that produce rhythmic outputs without the
presence of rhythmic inputs, regardless of their sensory or central origin (Hooper, 2001). The
rhythmically patterned outputs of these neural networks regulate the generation of most rhythmic
motor patterns (Hooper, 2001). CPGs have been a popular subject of study and their behavior has made
them excellent models for understanding neural network function (Hooper, 2001). CPGs have been
found to produce repetitive, periodic neural firing that can stabilize motorneuron firing, in studies
related to rhythmic oromotor behavior patterns (Bryant, 2010; Nistri et al., 2006).
1.5.2 Rhythmic Licking and CPGs
Searching for the origin of rhythmic motor patterns, the first evidence for the proposition that they may
be centrally generated came from experiments involving the locust nervous system (Hooper, 2001). It
was observed that the nervous system of the locust would produce similar rhythmic output when
5isolated from the animal as it would during flight (Hooper, 2001; Wilson, 1961 cited in Marder and
Calabrese, 1996).
Due to the nature of rhythmic licking as a strongly stereotyped behavior and motor pattern, it is natural
to pursue the discovery of its potential connection to CPGs and whether they could be potentially
organizing such rhythmic motor patterns (Travers et al., 1997). Studies involving rat models have
demonstrated evidence that 6-8 Hz modal frequency licking is controlled by a central timing mechanism
that is to some extant immune to interruptions or disruptions (Travers et al., 1997). Studies involving
experiments in which a rat’s rhythmic licking is interrupted have shown evidence to suggest that such
interferences do not reset rhythm generators (Hernandez-Mesa et al. 1988; Travers et al., 1997). In
particular, these experiments have provided indications of central rhythmic activity in periods of time
between licking (Hernandez-Mesa et al. 1988; Travers et al., 1997). In these experiments researchers
observed the presence of electric field potentials in the proximity of the hypoglossal nucleus (mXII) in
the periods between licking (Hernandez-Mesa et al. 1988; Travers et al., 1997). Similar to that of the
early locust experiment other studies have also observed central hypoglossal activity in the absence of
visible licking, suggesting the preservation of central rhythmic activity despite the lack of visible licks
(Wiesenfeld et al., 1977; Travers et al., 1997).
Currently, the physiological properties and identity of the neurons and networks that make up CPGs are
not anatomically well defined. However, it is known that rhythmic tongue movements are driven by the
hypoglossal nuclei in the medulla. Looking closer at CPGs, motor programs seem to exist among
premotor neural networks that transmit rhythmic inputs to collections of motor neurons that innervate
the cranial nerve nuclei V, VII, and XII (Bryant, 2010; Nakamura & Katakura, 1995; Travers et al., 1997).
There is also evidence to suggest that among premotor neurons in the medullary reticular formation
(RF), a substrate for rhythmic licking is organized (Bryant, 2010). These neurons are encompassed
within a larger, complex network of interconnected nuclei within the medullary and pontine reticular
6formation (RF) that drive greater oromotor function. For example, the premotor neurons of extrinsic
and intrinsic tongue muscle groups have been located within numerous medullary and pontine RF cell
groups (Bryant, 2010; Kandel et al., 2000b cited in Bryant, 2010; Travers & Rinaman, 2002). In particular
to rhythmic licking, rhythmically active neurons have been found in the parvocellular and intermediate
zones of the RF (Bryant, 2010; Travers et al., 1997).
1.6 Cerebellum’s Contribution to Oromotor Movements
1.6.1 Rat Cerebellectomy and Inactivation Studies
Studies focused on understanding the role of the cerebellum in fluid licking have investigated how the
temporary or permanent loss of cerebellar function effects rhythmic licking behavior (Bryant et al.,
2010). Functional rat ablation studies have resulted in a considerable reduction in lick frequency
consistent with studies that involved permanent removal of the rat cerebellum as well as the temporary
block of cerebellar spike output, illustrating commonality across different mammalian species (Bryant et
al., 2010; Vajnerová et al., 2000). In studies involving mice animal models, the partial, short-term
inactivation of cerebellar output through muscimol injections into the cerebellar nuclei resulted in a
substantial slowing of lick rhythm compared to pre-treatment behavior and saline control (Bryant et al.,
2010). The same study also examined the lick rhythm of cerebellectomized mice models and found a
similar slowing of lick rhythm. They also noted a reduction in lick efficiency reflected by a decrease of
fluid intake measured in volume per lick in both cerebellectomized and muscimol groups (Bryant et al.,
2010).
1.6.2 Guinea Pig Ablation Studies (Byrd & Luschei, 1980)
Studies examining the mastication cycle of guinea pigs (Cavia porcellus) before and after gross ablation
of the cerebellum noted that the rodents’ behavior was extremely ataxic exemplified by a lack of
7balance during locomotion. However, mastication was distinctly not impaired. The experimenters found
that mastication cycle duration time increased while the variability of mastication cycle duration time
decreased after ablation. It was also noted that the complex bilateral chew cycle of the guinea pigs was
conserved post-ablation.
1.6.3 Cerebellum and Oromotor Movement
These studies go on to suggest that the cerebellum is involved, at some capacity, in the coordination of
licking temporally (Bryant et al., 2010). Critical movements like licking, breathing, and swallowing have
been shown to be controlled by central pattern generators (CPGs) (Barlow, 2009; Bryant et al., 2010;
Cifra et al., 2009; Nistri et al., 2006). It is possible that cerebellar coordination of CPGs has an anatomical
substrate, based on evidence of cerebellar nuclei projections into the brainstem corresponding to areas
associated with licking, breathing, and swallowing CPGs (Asanuma et al., 1983; Bryant et al., 2010;
Teune et al., 2000). In mice with their deep cerebellar nuclei and cerebellar peduncles removed, a
slowing of lick rhythm was observed indicating that the cerebellum is not necessary for the generation
of tongue and general oromotor movements (Bryant et al., 2010).
1.7 Spatial Representation of Lingual System in Primate
Cerebellum
1.7.1 Non-Human Primate Stimulation Electromyography (EMG) Studies (Aldes
& Bowman, 1979)
Researchers have investigated the representation of the tongue within the cerebellar nuclei of old-world
rhesus macaques (Macaca mulatta) using electrophysiologic techniques. The experiments involved
stimulating cerebellar nuclei while simultaneously recording the electromyography of tongue
musculature, both externally and internally through needle electrodes. Analysis of the experimental
8EMG results revealed that the tongue is represented in all four deep cerebellar nuclei (DCN). However, it
was noted that this representation was not equivalent in each DCN.
1.8 Dysfunctional Cerebellum Effect on Oromotor Control
Dysfunction of the cerebellum can hinder lingual and general oromotor control. Two specific medical
conditions that exemplify this include dysarthria and dysphagia. Dysarthria being a motor speech
disorder and dysphagia being a disorder characterized by a difficulty swallowing.
1.8.1 Dysarthria (Motor Speech Disorder)
It is known that cerebellar lesions of any kind can be the cause of dysarthria (Amarenco & Hauw 1990;
Gordon, 1996). To take a closer look at the relationship between cerebellar disease in humans,
researchers have investigated areas of cerebellar damage associated with dysarthria (Lechtenberg &
Gilman, 1978). Cerebellar lesions like vascular malformation, tumors, abscesses, hemorrhages, and
infarctions were all found to be linked to dysarthria (Lechtenberg & Gilman, 1978). Examining clinical,
surgical, and autopsy data, these investigators noted that there was no correlation between the degree
of cerebellar vermal damage and the development of disordered speech (Lechtenberg & Gilman, 1978).
However, dysarthria was found to occur in the aftermath of resections into the cerebellum extending
into the paravermal region, particularly that of the left hemisphere (Lechtenberg & Gilman, 1978). Other
studies have also called attention to this region, noting that cerebellar lesions that involve the
paravermal rostral zone are particularly associated with dysarthria (Amarenco & Hauw 1990; Gordon,
1996).
91.8.2 Dysphagia (Swallowing Disorder) (Rangarathnam, 2014)
While it is often taken for granted, swallowing is a complex process involving salivation, sensory
processing, both voluntary and reflexive motor control, as well as other processes (Zald & Pardo, 1999).
Hence it follows that swallowing involves oromotor anatomy and contributions from numerous systems
including both cortical and subcortical structures. Dysphagia is characterized by an impairment of the
motor aspects of swallowing and more specifically by abnormal bolus flow (Robbins et al., 1999) Bolus
refers to food that has been chewed and rounded, ready for swallowing. In trying to understand the
connection between the cerebellum and dysphagia, investigations relating cerebellar lesions with
dysphagia have yielded inconclusive results. Examining results across many human subject studies,
dysphagia is present in subjects with cerebellar lesions, but not to such a severe degree as in individuals
with wide-spread lesions. While it is important to note that cerebellar lesions could be the cause of
dysphasia, there are discrepancies within literature.
1.9 Marmoset Model
1.9.1 Geography (Downey, 2017)
The common marmoset Callithrix jacchus, is a promising non-human primate model for studying
cerebellar contributions to motor control. A new world monkey, the common marmoset’s original
habitat was comprised of the northeastern coast of Brazil in the country’s Atlantic coastal forests,
however, human pressure on these ecosystems and increasing habitat destruction in the region has
forced these animals to seek new environments throughout Brazil. The common marmoset is known for
being able to adjust and flourish in new environments which other animals may find to be inhospitable.
The species has been seen in dry secondary forests, riverine forests, and savanna forests, attesting to its
10highly adaptable nature. It is important to note that common marmosets are most commonly found at
the edge of these habitats as opposed to their center.
1.9.2 Characteristics and Lifespan (Downey, 2017)
The common marmoset is a small monkey species with characteristically long tails. Males tend to exceed
females in size with a male-to-female body mass ratio of ~0.964 (Smithsonian). The average body length
for males is roughly 19 cm and that of females is 18.5 cm. The average body weight of males is 256 g
versus females’ 236 g. The monkey’s characteristically long tail can add another ~30cm of length to the
animal. As an animal model, the common marmoset has been of interest to scientists due to its short
gestation period of just ~5 months, propensity to give birth to non-identical twins or triplets, and
biological adaptation to give seasonal births typically resulting in two pregnancies a year. This high
breeding efficiency indicates potential for germline transmission of genetically modified models. A
defining feature of the species, common marmosets exhibit social behavior and exist in family units. One
such social behavior is cooperative infant care in which fathers, older siblings, and even extended family
will contribute to a child’s care.
1.9.3 Contribution of Tongue Control in Critical Behaviors (Downey, 2017)
Stemming from their nature as a social species, the common marmoset utilizes a collection of
vocalization patterns to communicate information. Vocalizations include but are not limited to the alarm
calls, trill calls, and phee calls. Alarm calls can be vocalized in two forms, but the purpose is the same: to
warn other members of the group of a potential danger. They can either be sequence of repeated calls
of increasing tone or a series of abbreviated, gradually appearing calls that can be either intermittent or
continuous. Trill calls are low in pitch and are characterized by a vibrato sound that fluctuates in
frequency. These calls are used by all members of the group regardless of their gender or age and are
11used by the monkeys to keep track of each other’s whereabouts, especially in low visibility areas. Phee
calls are high pitched whistles consisting of a series of one to five notes lasting typically two seconds
each and are sounded by marmosets in defending territory, attracting a potential mate, locating a lost
member, and in support group cohesion.
The common marmoset is not limited to vocalization as a method of communicating to other members
of its species. While vocalization is a tool marmosets utilize when communicating over long distances,
they can use visual cues to share information with each other at close range. Many of these visual
signals involve the oromotor system. A partial open mouth stare can be a signal for alarm and a frown
can be a sign of aggression. Interestingly, female marmosets will flick their tongue in a distinctive
manner to solicit potential male partners.
The diet of the common marmoset consists primarily of exudates and insects. Making up 70% of the
marmoset diet, plant exudates are the secretions of plants like sap, resin, and gum. The monkeys are
uniquely adapted to this obtaining this food source. Using their claws as anchors to cling to the sides of
trees, they will prompt the flow of the exudates by using their teeth to gnaw a hole into the trees. Using
their specialized tongue, they will then lick their food for nourishment.
1.9.4 The Marmoset Brain (Fujita et al., 2010)
The marmoset cerebellar cortex demonstrates organization by transverse foliation and longitudinal
compartmentalization. The folial and compartmental organization of the marmoset cerebellum
resembles that of the macaque cerebellum. The outer shapes and major fissures of the cerebella of both
animals appear to be very similar, however, it is important to note that they differ in size. The marmoset
cerebellum is smaller in size and is roughly half the length of the macaque cerebellum. Additionally, the
vermis of the marmoset tends to be wider and the hemisphere smaller than that of a macaque.
Researchers have examined molecular compartmentalization as a tool to understand the organization of
12the mammalian cerebellum. In particular, it has been shown that cerebellar expression of aldolase C and
its corresponding compartmentalization may be used to understand the fundamental functional
organization of the cerebellar cortex. Studies comparing the compartmental organization of aldolase C
in marmosets and rodents reinforces the notion that the marmoset cerebellum reflects the common,
phylo-genetically preserved fundamental organization of the mammalian cerebellum.
1.10 Specific Aims
The first specific aim of this analysis is to elucidate the characteristics of marmoset licking behavior
within the framework of our experimental setup. The second objective of this paper is to provide a
characterization of marmoset cerebellar Purkinje neuron responses to licking behavior at both a cellular
and population level.
13Chapter 2. Materials and Methods
2.1 Experimental Setup (Sedaghat-Nejad et al., 2019)
A detailed description of the experimental setup used to acquire the data analyzed in this paper is
described in the following paper: Behavioral training of marmosets and electrophysiological recording
from the cerebellum (Sedaghat-Nejad et al., 2019). To summarize the experimental setup, the following
description is provided.
Figure 2-1. The experimental setup. AcB, EpC, BC, and EC represents the acquisition board, electrophysiological
computer, behavioral computer, and eye computer, respectively. From Sedaghat-Nejad et al., 2019.
In order to record from the cerebellum, a stable subject is necessary to allow for the mobility of
electrodes and longevity of recording sessions. The marmoset subjects thus required head-fixation prior
14to recording. First a pre-operative CT was done of each of the marmoset subjects which was when used
to create a 3D model of each subject’s skull using open-source software 3D Slicer (Fedorov et al., 2012).
These models were used to guide the design of each subject’s custom titanium head-post, base
recording chamber, and protective chamber cap. The biocompatible titanium head-post and chamber
were then implanted into the subjects by a surgical team supported by veterinarians and veterinary
technicians.
To plan electrode trajectories a post-operative CT was done on the subjects with a specially designed
reference ruler placed in the base chamber. Registration between the pre-operative CT, pre-operative
MRI, and post-operative CT provided a full representation of each subject’s brain, skull, and reference
ruler. This was used calculate the electrode trajectories to record from specific points in the cerebellum.
The planned trajectories designed to originate from the desired recording locations, converged at the
location of a burr hole and extended past the base chamber. An electrode guidance tool was designed
using these trajectories and was attached to the base chamber. This tool provided a physical reference
of the planned electrode trajectories and contained several cylindrical cutouts leading to the burr hole
that would provide the electrodes with guidance to the desired recording locations within the
cerebellum. The electrodes would be advanced into the brain using a microdrive attached to a
stereotaxic micromanipulator following an alignment procedure. A craniotomy was done to create the
burr hole and was sealed using a transparent silicone gel. Three types of electrodes were used to record
from the subjects including quartz insulated, metal core 4 fiber tetrode and 7 fiber heptode electrodes
from Thomas Recording. Additionally, 64 contact high density silicon probes from Cambridge Neurotech
were also used. The open-source electrophysiology software OpenEphys (Siegle et al., 2017), was used
for data acquisition purposes and interfaced with a RHD2000 communication system from Intan
Technologies, USA.
15During experiments the marmoset subjects were seated in an experiment chair in front of a TV screen
and were tasked with making saccades to targets displayed on the TV screen. During this time, their eye
movements were tracked by an EyeLink-1000 eye tracking system from SR Research, USA at 1000Hz. If a
successful saccade was done by the subject a distinct auditory tone was played and a food pump was
encaged that pushed food through a food tube placed just adjacent to the subject’s mouth. One food
tube was placed to the right of the subject and one to the left. Subjects were able to retrieve reward at
their own discretion once it was within the reach of their tongues. During this time, a micropositioner
along with a data acquisition system was used to drive probes to record signal from desired locations in
the brain. Additionally, a photo diode was used in the experiments to measure screen delay. Finally, an
overhead lick camera was used to observe and quantify licking behavior in the marmoset subjects.
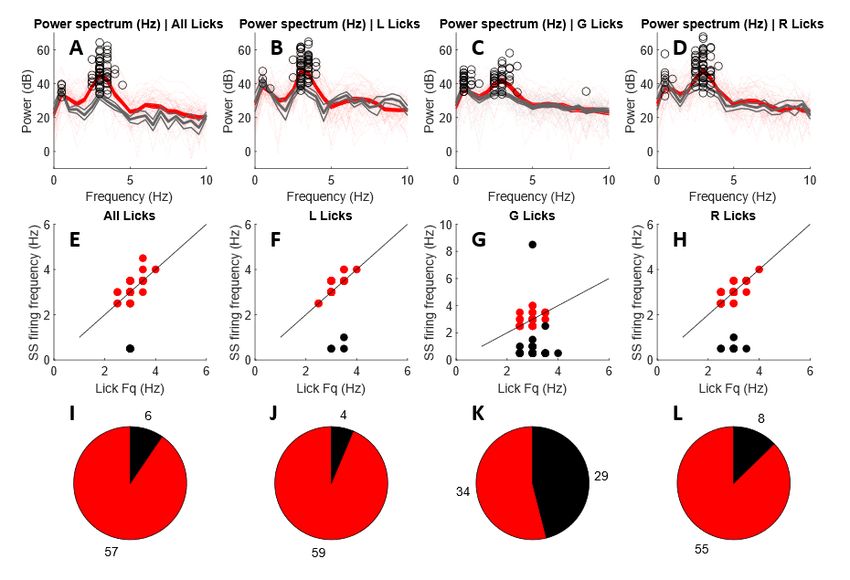
Figure 2-2. Task design and saccade results. A. Overview of task design. B. Example of recorded eye trajectories
during the task. From Sedaghat-Nejad et al., 2019.
While in the experiment chair the subjects completed a task involving saccades to receive reward. The
trials begin with the subjects fixated on a central target for 200ms. After this time, a primary target
would appear at a random location within a distance of 5-6 degrees from the central target. As the
16subject made its saccade to the primary target it was erased, and a new secondary target was generated
2-2.5 degrees from the primary target. If the subject was able to make the corrective saccade to the
secondary target after making a saccade to the primary target and fixated on the secondary target for
200ms, they were given reward.
Due to the nature of the electrodes, it is possible that the recorded signal is from a number of cells and
not a single Purkinje cell (P-cell). Thus, it is important to identify if the recorded signal is from a single or
multiple P-cells. Since simple spikes from a single cell produce a refractory period, the probability that a
simple spike occurred at a time t after a simple spike occurred at time zero, Pr(S(t)|S(0)), should present
a low probability during a period of 10ms centered at time zero. As simple spikes are suppressed by
complex spikes, the probability that a simple spike was generated at a time t following a complex spike
generated at time zero, Pr(S(t)|C(0)), should indicate a long duration of low simple spike probability
after time zero. By comparing the histograms of these two probabilities it could be determined that
recorded complex and simple spike data was from the same cell.
2.2 Identifying Tongue Related Purkinje Cells
To identify P-cells related to lick behavior, P-cell responses were confirmed via visual and audio
feedback. Specifically, it could be seen during recording that a neuron’s firing rate was modulated by
licking behavior. Lick related P-cells were labeled based on visual and audio feedback that indicated a
significant difference in neuron firing during licking bouts versus before licking bouts. In total, 63 P-cells
across lobule VI of the marmoset cerebellum were recorded and then analyzed in this paper. The
recorded cells were from two marmoset subjects: subject M and subject R.
172.3 Tongue Tracking Using DeepLabCut (DLC)
Figure 2-3. Example of tongue tracking. A. Example video frame with markerless tracking points visible. B. Example
of polygon fitting to the markerless tracking data.
In order to quantify the movement of the tongue, DeepLabCut was used to perform 3D marker-less pose
estimation on the tongue, food tube, and marmoset head position (Mathis et al., 2018). DeepLabCut is
an open-source software that is able to execute 3D marker-less pose estimation with minimal training
data through transferring learning with deep neural networks (Mathis et al., 2018). Several video frames
of the lick camera recordings were labeled and were used as a training dataset for a custom network
using the DeepLabCut toolbox to provide generalized tracking across lick camera videos. Markers were
placed on the nostrils of the marmoset subjects, the left and right edges of the end of each food tube,
the food in the tube at its most dense location, the tip of the tongue, the approximate midpoint of the
18tongue, and the left and right edges of the tongue at the middle point of the length between the
midpoint and the tip of the tongue. Tracking of these points allowed for the quantification of the tongue
angle, velocity, and displacement away from the mouth. Fitting polygons to the markers allowed for the
determinization of the outcome of the subject’s licks, like whether or not the subjects retrieved reward,
if the tongue missed the tube, and other outcomes. A robust quality assurance process was done to
check and improve the custom network’s tracking. ResNet-152 was used as the base network for the
transfer learning necessary to train the custom network to track licks using the DeepLabCut toolbox (He
et al., 2016).
2.4 Data Preprocessing
Given the number of sources of data used in analysis, it was paramount that all data sources be properly
aligned in time in order to accurately be able to gain insight into the relationship between tongue
behavior and neuron firing. The lick camera data was synchronized to the neural recordings using the
LED photo diode from the experimental setup. Since the LED was visible to the lick camera, it could be
used as an alignment tool as it could be seen flashing in the video and its source signal was known. Using
the reference LED, dynamic time-wrapping and cross-correlation analysis was done to align the lick
camera recordings with the neural data recordings. The output of the pre-processing alignment process
was an alignment file used for use in post-processing. These files were created for each session.
2.5 Psort: Open-Source Cerebellar Neurophysiology Software
(Sedaghat-Nejad et al., 2021)
Recording and analyzing electrophysiological data from the cerebellum and specifically Purkinje cells (P-
cells) is a complex endeavor involving multiple challenges. Purkinje cells are characterized by their ability
to produce both simple and complex spikes (Thach, 1967). This property makes them unique in the
19cerebellum and is also what researchers can use to determine if a recorded neuron is a P-cell.
Specifically, the generation of a complex spike is followed by the suppression of simple spikes (Eccles et
al., 1966; Sato et al., 1992). Utilizing this property, statistical methods can be used to identify P-Cells
when analyzing data recorded from the cerebellum. The open-source software Psort was used to both
detect simple and complex spikes from recordings as well as to identify if the spikes were generated by
the same P-cell. Psort requires user interaction to sort P-cells and is not an automated sorter. As a
result, this work would not be possible without the help of Dr. Reza Shadmehr PhD., Paul Hage, and Jay
Pi and their efforts in sorting recorded P-cells.
2.6 Data Postprocessing
The data corresponding to each cell analyzed in this paper was made up of data from multiple recording
sessions with the subjects, however some cells were only recorded in one session. Prior to cellular level
analysis, each sessions data was extracted individually and organized based on analysis needs. Data
postprocessing was done in MATLAB by Mathworks, USA and involved data from alignment
preprocessing, DLC kinematic analysis, and Psort output. The .psort file outputted from Psort, contained
data corresponding to all of the identified simple spikes (SS) and complex spikes (CS) from the entire
neurophysiological signal of the session. Since the neurophysiological data was recorded at 30,000Hz it
was down sampled in post-processing to 100Hz, as data corresponding to lick camera videos were
approximately recorded at 100Hz. These 100Hz spike trains were arrays the length of the recording
session in time, with the number of spikes detected saved at each sample point in the array. The data
file outputted by the alignment process was used to pick apart the SS and CS spike trains and align them
corresponding to a particular kinematic event for each lick made by the subject in the session. These
kinematic events included the onset of licking (lick onset), time of max protrusion speed (vmax), time of
max retraction speed (vmin), and time at which the tongue was at its farthest point (dmax).
20Corresponding to each lick, the spike train data was parsed and centered at the kinematic point of
interest. The result of this process was the creation of a 2-dimensional array in which the rows
corresponded to the SS or CS spike data for a single lick, 2 seconds before and 2 seconds after the
kinematic point of interest. The number of rows of this array represented the number of licks analyzed
from the session. In this way, it was possible to observe the nature of neuron firing at particular tongue
kinematic events. Due to the large time window used to align the SS and CS spike trains to the kinematic
events, the spike data for some licks had to be discarded as they occurred to close to the beginning or
the end of the recording session and spike data 2 seconds before and 2 seconds after the kinematic
point of interest did not exist.
The tongue kinematic data, distance of tongue tip from mouth (dtip) and velocity of tongue tip (vtip),
that corresponded to the SS and CS train data was imported from the output of the DLC analysis for that
specific session. Since the tongue kinematic data was sampled at a different frequency than the SS and
CS trains, it was interpolated using timing data from the alignment process through the MATLAB
function interp1 to also be 100Hz. Then this data was also parsed and centered at each kinematic point.
The result of the process was similar to what was done to the SS and CS spike trains in that a 2-
dimensional array was created in which each row corresponded to the tongue kinematic data for a
single lick, 2 seconds before and 2 seconds after the kinematic point of interest.
Several 1-dimensional logical arrays were imported from the DLC analysis and used to classify licks based
on their type. Licks were separated into the following types for analysis:
• The initial lick of a bout.
o Bouts consisted of licks done in rapid succession. Marmoset rhythmic licking behavior is
almost exclusively characterized by these occurrence of these bouts.
• Leftward reward-driven licks.
21• Rightward reward driven licks.
• Grooming licks.
o These are licks in which the animal does not try to retrieve reward from the food tubes,
but rather licks itself to groom itself.
Using these logical arrays, it was possible to extract the specific SS and CS spike trains as well as tongue
kinematic data, centered at each kinematic time point (lick onset, dmax, vmax, vmin), for each lick class.
Within the data post-processing code, the SS and CS spike trains along with the tongue kinematic data
(dtip and vtip), for each of the lick classes were saved for the analysis process. It is important to note
that the post-processing code saved the spike trains and tongue kinematic data corresponding to the
initial licks of bouts were saved with only 1 seconds before and 1 seconds after kinematic points of
interest. All other data associated with the other lick classes consisted of data corresponding to 2
seconds before and 2 seconds after kinematic points of interest. Spike trains and kinematic data
corresponding to the initial lick of a bout were also parsed and save based on whether bouts were
leftward or rightward.
In addition to this data, different characteristics of each of the licks within a recording session were also
imported from the DLC analysis output file and saved for analysis. These include the following:
• The max distance of the tip of the tongue from the mouth during licking (mm).
• The max protrusion velocity of the tip of the tongue (mm/s).
• The max retraction velocity of the tip of the tongue (mm/s).
• The inter-lick interval (ILI) of between the lick and the one after it (s).
• The instantaneous lick rate (ILR) at the time of the lick (Hz).
• The time duration of the lick (s).
22Each of these characteristics were also parsed and saved occurring to the lick classifiers. ILI was
calculated by taking the difference between the times of lick onset. ILR was calculated by taking the
inverse of ILI (1/ILI).
Additionally, information regarding the number of licks recorded in the session, the number of licks
within a bout, the duration of licking bout, and the number of bouts within a session was extracted from
the DLC analysis output file and saved for analysis. Using classifiers similar to those used for individual
licks, data concerning the number of licks within a bout and the duration of licking bouts was separated
for leftward and rightward bouts and saved for analysis.
Given that the above post-processing process was done for each individual session, a special script was
written to run the post-processing protocol for each recording session and save each individual
corresponding post-processing output file. Then, a separate script was written to concatenate the data
from each recording session corresponding to each cell. This script aggregated the concatenated post-
processing data for each cell into a single, large output file that was used for analysis.
23Chapter 3. Results
All analysis was done in MATLAB. Following the post-processing process, the singular output file
containing data for each of the 63 cells was imported into an analysis pipeline script. The cross-session
vertical concatenation of the 2-dimensional arrays containing the SS/CS spike data or tongue kinematic
dtip/vtip data yielded large 2-D matrices in which the rows still corresponded to the SS/CS spike data or
tongue kinematic dtip/vtip data for a single lick, 2 seconds before and 2 seconds after a specific lick
kinematic point (lick onset, dmax, vmax, vmin). However, the number of rows now corresponded to the
total number of licks across all the recording sessions of that particular cell. Matrices specific to the
initial licks of bouts, leftward reward-driven licks, rightward reward driven licks, and grooming licks were
all extracted from the post-processing output file. Up to this point all spike train and kinematic data for
each lick from across recording sessions was conserved in these matrices. In order to gain insight into
how this data looked like at a cellular level, the mean of these matrices was taken across rows. This
yielded a singular row vector for each lick class. In this way, the mean of the cell neuromodulation and
tongue kinematic behavior centered at each kinematic time point (lick onset, dmax, vmax, vmin) was
obtained across all licks corresponding to each lick classifier (initial licks of bouts, leftward reward-driven
licks, rightward reward driven licks, and grooming licks). During this step, the mean SS/CS spike trains for
each cell were multiplied by 100 to yield the SS/CS firing rate. After this process was done for each cell,
new matrices were constructed in which the rows corresponded to the mean SS/CS spike firing rate or
tongue velocity/displacement values across licks within a cell’s recording session. Separate matrices
were created centered at each of the different kinematic time points (lick onset, dmax, vmax, vmin). The
number rows in these matrices matched the total number of cells.
24You can also read