Internet, Social Media, and the Behavior of Politicians: Evidence from Facebook in Brazil* - Filipe ...
←
→
Page content transcription
If your browser does not render page correctly, please read the page content below
Internet, Social Media, and the Behavior of
          Politicians: Evidence from Facebook in Brazil*
 Pedro Bessone†            Filipe Campante‡             Claudio Ferraz§           Pedro CL Souza¶

                                               May 2022

                                                 Abstract

      Recent years have witnessed the remarkable diffusion of social media, in tandem with the
      spread of mobile phones that are, in many places, the key tool for accessing those media.
      We ask whether this has affected the communication and responsiveness of politicians to-
      wards voters. Using data on the spread of the 3G mobile phone network in Brazil, and self-
      collected data on the universe of Facebook activities by federal legislators, we examine how
      legislators respond when municipalities that are part of their electoral base obtain access
      to the 3G technology. We find that politicians increase their online engagement with vot-
      ers that gain 3G mobile access but decrease their offline engagement measured by speeches
      and earmarked transfers towards connected localities where they have a large pre-existing
      vote share. Our results suggests that instead of increasing responsiveness, social media
      may enable politicians to solidify their position with core supporters using communication
      strategies, while shifting resources away towards localities that lag in social media access.
      Keywords: Internet; Mobile Phones; Social Media; Accountability; Legislative Behavior;
      Elections.
      JEL Codes: D72, H72, L86, L96.
   * We  are grateful to Ruben Durante, Patrick Francois, Ben Olken, Erik Snowberg, Francesco Trebbi, Romain
Wacziarg, Noam Yuchtman and seminar audiences at ASSA, CERGE-EI, Chicago-Harris, George Mason, IMF,
INSEAD, Johns Hopkins SAIS, LACEA, LMU Munich, Northwestern, Princeton, PSE, UBC, Warwick, the DCPEC
Research Workshop, and the EBRD Conference on Corruption and Anti-Corruption Policies (Kyiv) for valuable
comments and suggestions. All remaining errors are our own.
   † Uber
   ‡ Johns Hopkins University & NBER
   § UBC, PUC-Rio, BREAD & NBER
  ¶ Queen Mary University of London
1      Introduction
The role of media in disclosing information, monitoring politicians, and making them ac-
countable is widely seen as central to the proper functioning of democracies. The recent
explosion of social media as another channel through which citizens can access news
and information can thus be transformative for the responsiveness and accountability of
politicians. At the same time, the political impact of social media has been the object of
increased skepticism, as they offer opportunities to affect content and manipulate infor-
mation in a way that can mislead voters and, some think, might threaten democracy.1
    A distinctive feature of social media is the possibility of direct communication be-
tween voters and politicians, which might affect politicians’ behavior differently than
traditional media. In spite of widespread evidence that traditional media can make politi-
cians more accountable and responsive (Besley and Burgess, 2002; Strömberg, 2004b;
Ferraz and Finan, 2008; Snyder and Strömberg, 2010; Strömberg, 2015; Varjão, 2019) and
that social media can affect the political behavior of citizens (Falck et al., 2014; Campante
et al., 2018; Enikolopov et al., 2020; Manacorda and Tesei, 2020; Guriev et al., 2021), we
still know relatively little about the impact of social media on the behavior of politicians.
    We examine the impact of social media on the responsiveness of politicians in the
context of the rapid expansion of 3G mobile internet in Brazil. Between 2011 and 2014,
the number of municipalities with 3G coverage more than doubled, going from 30% to
about 67% – an expansion reaching about 30 million people. This took place concurrently
with a remarkable dissemination of Facebook, which rapidly became the dominant so-
cial media platform in the country, and acquired commensurate prominence in Brazilian
politics. In a low-information setting regarding politicians and what they do, this new
media environment greatly enhanced the possibilities for interacting with and acquiring
information about elected representatives – in contrast with the media-saturated envi-
ronments of developed countries, where social media might crowd out other channels of
accountability.
    We find that access to 3G internet in a municipality is associated with greater online
interaction between legislators for whom the locality is important, relative to other mu-
nicipalities that remain off the network. This, however, comes at the expense of lower en-
gagement offline: those legislators become less likely to mention the municipality in floor
speeches, and crucially, bring fewer resources from discretionary transfers. Our evidence
thus indicates that the associated diffusion of social media and mobile phones gives rise
    1 This
         is most clearly exemplified by the phenomenon of so-called “fake news” (Allcott and Gentzkow,
2017; Allcott et al., 2019; Lazer and et al, 2018). For broader skeptical accounts, see for instance Vaid-
hyanathan (2018) or, for a media account, Madrigal (2017).

                                                    1
to a substitution between online and offline behavior: politicians react to Facebook entry,
within their base of support, by simultaneously increasing their online presence, and
reducing their offline activity.
Our empirical strategy leverages two features of the Brazilian setting. First, we take
advantage of the staggered rollout of the 3G network in Brazilian municipalities. This
allows us to adopt an event study design using within-municipality variation in 3G cover-
age. Second, we exploit a characteristic of the Brazilian system to elect federal legislators
to go beyond the standard differences-in-differences strategy: federal legislators com-
pete for votes in all municipalities of a given state, and multiple legislators are elected
in each state. This allows us to control for a richer set of fixed effects, including at the
legislator-municipality and municipality-year levels, thus alleviating concerns that unob-
served factors could confound our results – say, if legislators were more likely to focus
attention on strategically important locations, and also to facilitate access of those areas
to the 3G network by lobbying mobile operators.
We present three main sets of findings. First, we show that politicians use social
media extensively to communicate with their constituents, finely targeting different lo-
calities and covering policy-relevant topics. To study that, we scraped the universe of
posts from all Facebook-active members of the Brazilian lower house (Câmara dos Deputa-
dos) over the 2011-2014 legislature from their public Facebook pages. We then developed
and applied an algorithm that classified which municipalities, if any, each post men-
tioned, and combined that with a topic modeling algorithm to classify the content of the
posts. The 513 legislators in our sample posted over 460,000 times between 2011-2014,
receiving millions of likes, shares, and comments on their posts. Of those, almost 170,000
mentioned at least one municipality and virtually all municipalities in the country were
mentioned at least once. We also find that a significant number of those posts have policy
content, discussing issues such as education, health, or public works.
Second, we show that politicians change their online behavior swiftly and intensely
on the Facebook platform when a municipality is covered by the 3G network. Legislators
increase mentions to those municipalities by 15.7% compared to uncovered municipali-
ties. We also find that voters interact more with those Facebook posts, as measured by
likes, shares, and comments. This suggests that increased access to social media by con-
stituents indeed raises the incentives of politicians to interact with them. Importantly,
however, we find that these results are much more pronounced when considering mu-
nicipalities that are part of the politicians’ base of support (in the sense of providing a
large share of their votes). For a municipality in the top decile of electoral importance for
the politician, 3G is associated with an increase of 60% in Facebook mentions and over
280% of comments, shares, and likes. From a theoretical perspective, it is not obvious that
this should be the case, as one might expect politicians to target municipalities with the
largest number of swing voters, rather than those where they are ex-ante more popular.
This underscores the peculiarity of social media, in which politicians mostly reach voters
that chose to follow them in the first place, and could plausibly have consequences for
polarization, as social media disproportionally increase the politicians’ communication
capacity with those core supporters.
For our third main set of results, we turn our attention to how the impact translates
into the offline realm. Even though the increased communication has policy-relevant
content, it is not obvious how it affects the incentives to use traditional political tools. In
an environment with very low accountability such as in Brazil, social media communi-
cation could just be cheap talk, with politicians ignoring voters’ social media presence in
whatever else they do. Moreover, even if there is any effect, it is unclear ex-ante whether
online and offline behaviors would be complements or substitutes. On the one hand,
legislators might be induced to do more in their legislative activity because of the en-
hanced ability to get that across to voters; on the other hand, they could instead get away
with doing even less, as the impact of any legislative accomplishment on votes could be
increased by boasting about it on social media.
We study two margins of legislative activity. We first focus on congressional speeches,
which are a significant part of the politicians’ daily routines, and in which they express
their opinions and support for various types of bills and propositions (Moreira, 2019;
Moreira, 2020). We analyze the contents of the universe of speeches and find that legisla-
tors respond to the entry of a municipality into the 3G network by mentioning it less often
– and once again, more strongly when it is part of their base of support. We interpret
this as an immediate response to the entry of 3G: with easier internet access by citizens,
politicians need to make less use of speeches to reach their supporters, substituting away
to online platforms.
We then turn to the choices made by legislators on allocating earmarked transfers
across municipalities. The analysis explores a feature of the Brazilian setting in which,
on a yearly basis, legislators propose amendments to the federal budget.2 This pork-
barrel spending is typically used by politicians to showcase improvements they bring to
communities of their choice – roads, schools and healthcare units are often funded in this
way – such that proposed earmarked transfers tie the actions of a legislator to specific
municipalities. We find that politicians devote fewer resources in earmarked transfers
2 These amendments are strictly capped at the level of legislators, implying a strong opportunity cost of
targeting the resources. See Ames (1995a), Firpo et al. (2015) and Finan and Mazzocco (2021) on determi-
nants and effects of earmarked resources in Brazil.
3to their core base of electoral support in response to the introduction of 3G. In other
words, when 3G arrives to a municipality in a legislator’s base of support, they react by
transferring resources to other municipalities in their base that are left without 3G access.
While this pattern could be partly due to technological substitution between online
and offline engagement, it can emerge simply from the interplay of communication,
transfers, and political competition. We show this in a simple model of “persuasion and
pork-barrel,” with the key assumption that (online) communication is especially effec-
tive in reaching core supporters within those municipalities, in line with the social media
feature that, to be reachable by the politician, one has to choose to follow them in the
first place. In contrast, transfers benefit the municipality as whole, which makes them
relatively more effective in attracting swing voters. In this model, a shock that makes
communication more effective, such as the arrival of 3G, leads to increased communi-
cation efforts by politicians; this increases the attachment of core supporters, thereby
reducing the number of swing voters and making transfers relatively less effective as a
way of garnering additional votes. The politicians thus find it optimal to divert trans-
fers to the municipalities that remain without 3G. Consistent with the model, we find
electoral losses in the subsequent election, within the politicians’ electoral base, in mu-
nicipalities that receive 3G (relative to those that do not). Furthermore, the response in
terms of reducing transfers comes entirely from legislators with relatively safe seats, for
whom presumably the attachment of core supporters would be stronger.
In sum, we find evidence that access to social media increases the responsiveness of
politicians, but only in the online realm. This comes at the expense of offline responsive-
ness, suggesting that there are real costs for voters. Intuitively, politicians can use social
media to increase the attachment of core supporters, thereby increasing their political
“market power” against voters. While what we capture is a short-run response – even-
tually one would expect 3G and social media access to become universal – it is not hard
to imagine that these changes might be persistent. In particular, one might speculate
that the consolidation of core supporters persists over time, so that places that got earlier
access to social media may end up with fewer swing voters even in the long run, and
receive less offline attention as a result. More broadly, our findings stress the fact that
social media is an inherently different arena, relative to other media environments, in
that its low barriers to entry in the broadcasting of content entail that politicians can also
use it as a tool to strengthen their position relative to voters.
Our paper relates to a number of different strands of literature. We add to the bur-
geoning empirical literature looking at the political impact of social media or mobile
phones (Tufekci and Wilson, 2012; Bond et al., 2012; Pierskalla and Hollenbach, 2013;
4Halberstam and Montagnes, 2015; Flaxman et al., 2016; Acemoglu et al., 2018; Chris-
tensen and Garfias, 2018; Larson et al., 2019; Enikolopov et al., 2020; Manacorda and
Tesei, 2020; Allcott et al., 2020; Levy, 2020; Guriev et al., 2021; Fergusson and Molina,
2021). These contributions have focused mostly on the impact of social media on col-
lective action and the flow of political information, while our focus is on the behavior
of politicians.3 Similarly, the literature on the political impact of the internet has mostly
focused on voter turnout (e.g. Falck et al., 2014; Gavazza et al., 2019). Campante et al.
(2018) also focus on the interplay between online and offline activities, but again on the
side of citizens rather than politicians.4
More broadly, many have studied the political impact of the introduction of new
media technologies (see for instance the survey by Prat and Strömberg, 2013). Most of
the literature focuses on the behavior of voters – in terms of participation (Strömberg,
2004a,b; Gentzkow et al., 2011) or the ability to impose accountability by voting out in-
cumbents (Ferraz and Finan, 2008). More closely related are papers that study impact of
the media on the behavior of politicians, and the degree to which they respond to con-
stituents (Snyder and Strömberg, 2010; Gavazza et al., 2019). We extend this literature to
the context of social media, and of a relatively unsaturated media environment in terms
of political coverage, and show that the impact of this particular new media technology
can actually go in the direction of reducing the (offline) responsiveness of politicians.
The remainder of the paper is organized as follows: Section 2 provides relevant
background on the Brazilian context, regarding the expansion of Facebook and mobile
phones, the political environment, and describes our data sources and key variables. Sec-
tion 3 describes our empirical strategy. Section 4 discusses the results. We rationalize the
results with the model in Section 5, where we also discuss additional evidence. Section
6 concludes.
2 Background and Data
2.1 The expansion of 3G internet in Brazil
Mobile internet was launched in Brazil in 2005, but until 2007 it had limited penetration
with a small number of firms using their existing mobile phone concessions to implement
the third generation of wireless mobile telecommunications (3G) transmission in 850
3 On politicians, see Petrova et al. (2021) on the impact of politicians’ entry into social media (Twitter)
on the volume of contributions they obtain.
4 For additional references, see Zhuravskaya et al. (2020) and references therein.
5MHz frequencies.5 Because only 20 percent of households in Brazil had access to the
internet from a home-based computer, there was a large demand for the 3G internet
expansion. At the end of 2007, Brazil’s Telecom regulator (Anatel) designed a spectrum
auction where 11 service areas were auctioned out. To promote regional competition,
Anatel awarded four blocks of spectrum in each lot. Another auction took place in 2010
for Band H and the remaining personal mobile service radio frequencies for 3G use.6
Because some regions were more economically attractive than others, Anatel intro-
duced several contractual obligations for the winning firms. First, companies that ob-
tained a block of spectrum to serve the richest parts of Brazil also had to serve a poor
and unconnected region. For example, a company that won an auction to serve the
metropolitan region of São Paulo (Brazil’s richest region) also had to acquire and serve
the Amazon region. Second, Brazil’s telecom regulator introduced targets for the expan-
sion of the 3G network to 2,740 municipalities that were out of the 3G internet network.
First, all capitals and cities above 100,000 inhabitants needed to have full coverage of 3G
internet (80% of urban area) by May 2013. Second, all municipalities with populations
between 30,000 e 100,000 needed to be connected to 3G internet by June 2016, and 70%
of those needed to be connected by May 2013. Finally, for smaller municipalities with a
population of 30,000 people and below, companies were required to connect 20% of mu-
nicipalities by May 2013, 75% by June 2016, and all needed to be connected by December
2019.7
Telecom companies got a concession for a given area, but they were given a choice
over which municipalities to connect over time.8 After the auctions and the identity of
winners were disclosed, Anatel asked each Telecom company to select a list of municipal-
ities they wanted to connect. Because multiple companies were serving a given area, the
choice was made in sequential order where each firm chose 5% of municipalities taking
turns until no municipality in the pre-selected list by Anatel was left.9 After this pro-
cedure, Anatel signed a concession agreement with each Telecom company containing
specific municipalities and dates that 3G internet connections needed to be completed.10
Because the expansion was dictated by the commercial interests of large companies and
5 3G refers to the third generation of wireless mobile telecommunications technology, which greatly
increased the capabilities of mobile data transfer.
6 See https://ihsmarkit.com/country-industry-forecasting.html?ID=106597317.
7 A municipality being connected was defined as at least 80% of the urban area of the main district
having a 3G signal.
8 This original list was published in 2008 and appended with the last 3G spectrum auction in 2010.
9 See Edital 002/2007.
10 Note that, although firms needed to connect a pre-specified list of municipalities, they could speed up
the process and connect localities before the due date.
6strict rules based on population brackets set by the regulatory agency, politicians had a
limited ability to influence the choices made by Telecom firms regarding the cities that
received 3G. Thus in our empirical analysis, we use the staggered entry of 3G internet as
the main source of variation.
We obtained data on whether a municipality was connected to 3G internet from
Teleco, a telecommunications consultancy firm in Brazil.11 They built the dataset from
the information they collect directly from telecom companies. The dataset includes, for
each municipality, the month and year of the first 3G internet connection and the month
and year that other telecom companies entered the municipality. For our analysis, we
create a variable measuring the fraction of year t for which the municipality had 3G
internet.
Telecom companies complied with Anatel and starting in 2008 expanded the number
of municipalities covered by mobile internet. The expansion was considerable over the
period of our analysis. Between 2011 and 2014 the coverage more than doubled going
from 30 to 67% of municipalities connected to 3G internet as shown in Panel A of Table
1. This corresponds to more than 2,000 municipalities connected to Mobile internet in
this short spell. In terms of population, this expansion meant that, in four years, 30
million people gained access to broadband mobile internet coverage. While we do not
have municipality-level data on 3G accesses, in Panel A of Figure 1 we show the trend
in 3G access between 2008 and 2014. The figure shows a great expansion of access to 3G
networks during our study period.
The rise in access to 3G technology was accompanied by an increase in the connec-
tivity reported in the PNAD household survey. Table 1 shows that, at the start of our
sample period in 2011, 36.6 percent of the households used the internet and in 2014 this
share increased to 55 percent. The most common method of internet access was through
mobile phones: 80.4 percent of the households reported in 2014 that at least one of its
members used a mobile phone to connect to the internet.
2.2 The entry of Facebook and the rise of social media in political
communication
As the expansion of 3G internet took place, Facebook entered the Brazilian market.
Facebook registered the domain Facebook.com.br in 2007, and the company effectively
started operations in Brazil in 2008. It experienced a very rapid expansion from just over
4 million users as of mid-2009 to 92 million users in 2014 (about 45% of the total popu-
11 See https://www.teleco.com.br
7lation of the country). The availability of 3G internet was crucial for this expansion as
the access to social media in Brazil takes place largely via mobile phones. In fact, out
of those aforementioned 92 million Facebook users, no less than 77 million accessed via
mobile internet.12
Facebook became by and large the dominant social network platform in Brazil. In
Table 1 Panel B we show data from Facebook use based on the Latinobarómetro survey.
It shows an increase in the percentage of individuals that use Facebook from 13% in 2011
to 43% in 2013. Complementary data from Ibope Nielsen and Facebook show a similar
trend. We can also use data from Google Trends to compare the interest in several social
media platforms over time.13 The number of Google searches for the terms “Facebook,”
“Twitter,” and ”Orkut,” are displayed in Panel C, and reveal Facebook’s steep rise. While
Orkut was the first social networking website with a significant presence, it was in clear
decline when Facebook started growing, and eventually shut down operations in 2014.
Twitter, on the other hand, was not widely used in Brazil during our study period.
In the early 2010s, it was clear to many politicians that Facebook would become an
important source of political information, and the adoption of Facebook as a communica-
tion tool spread quickly. Out of 513 Federal Deputies elected for the 2011-2014 legislature,
415 had created an active public official Facebook profile by the end of their term. In Ta-
ble 2 we show that 17% of Federal Deputies had a Facebook account in the first year of
their legislative term in 2011, while by the end of the term in 2014 80% had one.
To study the online communication of legislators, we scraped the universe of their
Facebook profiles for their content, messages, and number of likes, shares, and com-
ments. We obtained a database of 460,540 posts from the 415 active public official Face-
book profiles. We show descriptive statistics of politician engagement on Facebook cal-
culated over the distribution of yearly activity across users in Panel A of Table 2. In line
with the idea that politicians increasingly used Facebook over this period, the average
legislator posted 24.5 messages in 2011; it increased almost twenty-fold to 484.2 messages
in 2014.
Our key outcome of interest that captures online activity is the number of times per
year a politician mentions a municipality in their posts. This allows us to analyze the
online engagement at the level of legislator-municipality pairs, and its evolution over
time, which as we will see, is crucial for our empirical strategy. The main challenge
for this task is that a considerable number of municipalities have names that also have
12 Source: Facebook, available at https://www.facebook.com/business/news/BR-45-da-populacao-
brasileira-acessa-o- Facebook-pelo-menos-uma-vez-ao-mes, accessed Jan 30th 2019.
13 The index is based on the number of Google searches, normalized by the maximum number of search
queries.
8other meanings in Portuguese. For example, whenever a politician said the word Natal, it
could either mean the municipality with that name or a reference to Christmas (the word
Natal means "Christmas" in Portuguese). To deal with that, we devised a text processing
algorithm that matches each of the 460,540 posts in our sample to the 5,545 Brazilian
municipalities.14 We tested the performance of our approach in a sub-sample, with the
algorithm providing a correct match for 89% of the true mentions, and a false match for
only 2% of the posts.
We find that 36.7% of posts (just under 169,000) mention at least one municipality.
These are the posts that constitute the core of our analysis, as they measure the engage-
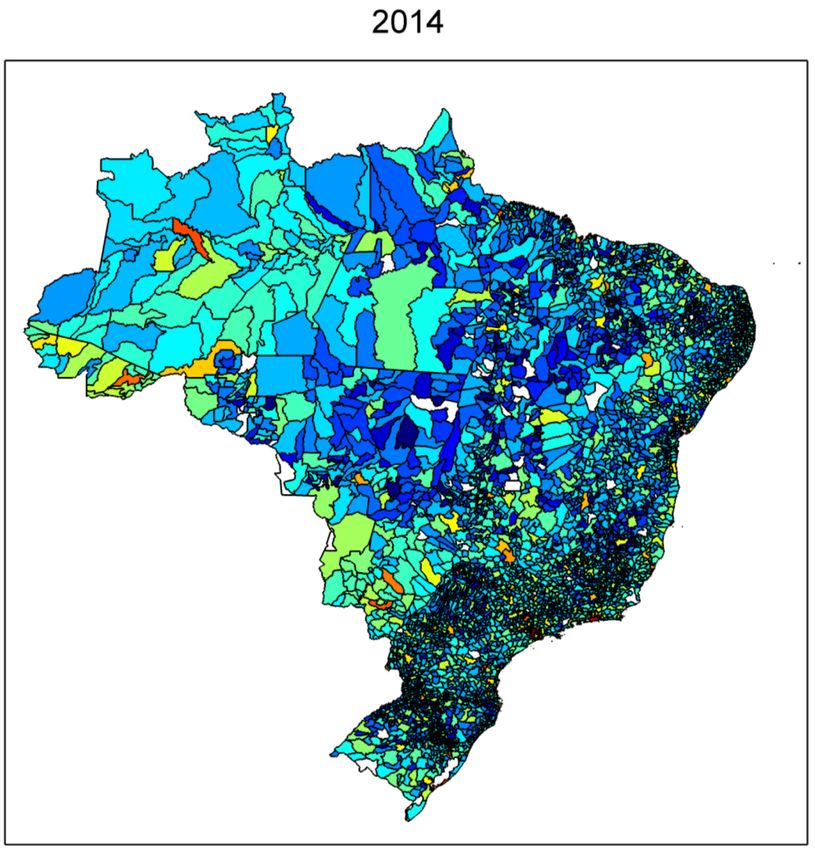
ment of the politician with the municipalities in their states of origin. Panel B of Figure
1 maps the incidence of the number of mentions to municipalities in 2011 and 2014, on
a logarithmic scale. In 2011 Facebook is sparsely used and few municipalities are men-
tioned. In contrast, virtually all municipalities were mentioned at least once in 2014.
We can also observe in the Figure the geographical concentration of Facebook posts in
municipalities that had 3G access in 2011.
Importantly, Facebook posts carry policy-relevant content. Among the posts that
mention a municipality, keywords that are related to congressional activity were used
in as many as 146,000. These keywords are, for the most part, the jargon used by the
politicians and Congress associated with legislative activity or political support for vari-
ous types of bills.15 The contents of Facebook posts also contained information on other
topics and public goods and services: keywords associated with education and health-
care were mentioned 27.3 and 23.2 thousand times, respectively. Finally, the database is
consolidated at the level of the politician-year-municipality triplet,
Besides the number of posts by a politician mentioning a municipality, we also gather
information on the sum of likes, shares, and comments on those posts. We use these
measures of interactions with posts to study how access to the internet affected the com-
munication between citizens and congress members. The limitation is that data from
the individual citizens’ Facebook profiles are typically private, unlike the politicians’
public profiles. This means that we cannot know how many of those likes, shares, and
comments are coming from citizens in a specific municipality. However, we use these
14 We manually classified the municipality names into “dubious”, ie names that could appear in contexts
other than mentioning the municipality, and “non-dubious”. We identified 898 municipalities with dubious
names. For this subset, we required that the municipality name was preceded by an expression that
commonly precedes a place in a sentence, such as “municipality of”, “mayor of”, or “airport of”. The
algorithm is presented in more detail in Appendix B.
15 More specifically, we looked for the following keywords “amendment”, “audience”, “committee”,
“commission”, “congress”, “deputy”, “law”, “party”, “plenary”, “project”, “proposition”, “agenda (or
pauta in Portuguese) ”, “voting”.
9measures as proxies for citizen engagement with a politician representing the municipal-
ity, assuming that locals will be a substantial part of the engagement obtained by posts
mentioning a municipality. In Panel A of Table 2, we observe a remarkable increase in
the interaction between Facebook users and legislators over time.
Between 2011 and 2014, Facebook use increased sharply, becoming adopted in Brazil
by politicians and citizens alike. It became a mainstream channel for politicians to ad-
vertise themselves and their legislative activity and interact with the general public. The
number of posts mentioning at least one municipality increased from an average of 4.44
per politician in 2010 to 177.56 in 2014. The behavior of the politicians was also met
with citizens’ engagement online. Messages posted by politicians that cited at least one
municipality received 17.21 million likes, obtained 6.64 million shares, and 1.56 million
comments over the years up to 2014.16
2.3 The Brazilian Congress
Brazil has a bicameral federal legislature (National Congress), with a lower house (Cham-
ber of Deputies) and an upper house (Federal Senate). The lower house has 513 federal
deputies (deputados federais) that represent each of the 26 states plus the Federal District.
Federal Deputies, the focus of our analysis, are elected under an open-list proportional
representation multimember district system. They have a four-year term and can run for
reelection without any term limit.17
The electoral system worked as follows. Voters could choose to vote for one candidate
or a party label. Political parties could form coalitions, and the allocation of seats in
a given state was chosen proportionally to the share of votes obtained by a party or
a coalition. The candidates who won those seats were the top individual vote-getters
within the party (or coalition) ticket. At the time of our analysis, there was no minimum
threshold for parties to enter parliament, and as a result, Brazil had a vast number of
parties represented in the federal legislature.
Generally speaking, the combination of open-list proportional representation and
large districts is seen as one of the main causes of poor accountability facing federal
legislators in Brazil (Ames, 2002). The problem is compounded by a sparse media envi-
ronment, with low newspaper penetration and an uneven presence of local radios and
TV stations (Ferraz and Finan, 2008). As a result, most individual legislators receive
very little media coverage and depend on local and visible achievements to make them-
16 During our study period politicians could not buy Facebook ads for campaigns. They were only
allowed in Brazil in the 2018 election.
17 See Ames (2002) for a detailed analysis of Brazil’s legislative electoral system.
10selves known to the electorate. In this context, voters typically have deficient levels of
knowledge regarding federal deputies.18 The fact that each state is a single multimember
district for the Chamber of Deputies implies that each candidate vying for congressional
office can get votes from any municipality across the entire state. As we will show later,
the distribution of votes for each candidate tends to be highly heterogeneous.
Once elected, the work of a legislator ranges from roll-call votes, public speeches,
bill propositions, and participation in special committees. Prior to the advent of Face-
book, politicians primarily used congressional speeches to communicate their legislative
achievements to the voters. Most interestingly, for our purposes, legislators can also pro-
pose amendments (emendas parlamentares, EPs) to the federal budget, with which they
earmark resources to specific projects in municipalities of their choice. These transfers
aim to provide public goods and cannot exceed a ceiling.19 This pork-barrel spending is a
major part of the typical legislator’s work: “Many if not most deputies spend the bulk of
their time arranging jobs and pork-barrel projects for their benefactors and constituents.”
(Ames, 1995b, pp. 407)
Legislative Activity We look at two dimensions of legislative activity, floor speeches
and budget amendments (emendas parlamentares, EPs), which we can be tied to specific
municipalities. For the former, we obtained the database of the universe of speeches
made in Congress, which is available on the Chamber of Deputies website. We use the
same algorithm from our Facebook analysis to detect if municipalities are mentioned
during those speeches. In Panel B of Table 2 we see that politicians, on average, make
two speeches per month. We also use the number of speeches as an outcome variable in
our subsequent analysis.
As for the budget amendments, we obtain the original list of amendments from the
government Open Data portal.20 The dataset contains, for every amendment, the leg-
islator responsible for it, the state and municipality targetted, the Ministry in charge, a
text description of the project and the monetary value. From this information we use
the amendments that are proposed by individual legislators and are targetted at munic-
ipalities (some amendments are proposed for whole states). We use the information of
the municipality to match with the 3G internet dataset. In Panel B of Table 2 we show
summary statistics of the amendments. The average legislator proposed 5.4 amendments
18 There is evidence that many voters forget which candidate they voted for, as soon as one month
after the elections. See http://media.folha.uol.com.br/datafolha/2013/05/02/intvoto_depfederal_
20092010.pdf.
19 The ceiling varied between 4.2 to 4.7 million US dollars for the 2011-14 period.
20 Source: https://dados.gov.br/dataset/emendas-parlamentares
11per year to 5.5 municipalities. Given that the average congressman has 253 municipalities
in his constituency (state), it is clear that politicians choose which localities will receive
transfers very carefully.
Electoral Support In our empirical analysis we explore heterogeneity on politician’s re-
sponse to the entry of 3G internet based on the vote share obtained across muniipalities
in the previous election. To capture the geographical variation in electoral support for
each legislator, we gather municipality-level election data made available by Brazil’s Elec-
toral Court (Tribunal Superior Eleitoral). We gathered data on the total valid votes obtained
by each elected legislator in each municipality. We then compute the vote share:
Votes of politician i in municipality m
VoteShareim = × 100,
Total votes of politician i
which represents the importance of municipality m for legislator i. Some deputies get
their votes from a few concentrated municipalities while others are elected from a much
more disperse base of support. This is potentially reflective of different electoral strate-
gies and the type of engagement between politicians and electorate. In fact, Ames (1995b)
describe the former as the “concentrated” types, characterized either by being a domi-
nant force in a municipality – their electoral bailiwicks, for instance –, or by specializing
in specific segments of the population that happen to be geographically clustered. In
contrast, the “scattered” types are often candidates that appeal to segments of the soci-
ety with state-wide representation, such as business owners, or are well-known figures
themselves (celebrities, ex-footballers). This is clearly exemplified in Figure 2, where we
show the map of vote shares for the top two legislators elected in the state of São Paulo in
2010 (Tiririca, a famous TV professional clown, and Gabriel Chalita, the 2008 most-voted
city council member in the city of São Paulo).
3 Empirical Strategy
Our goal is to examine the effect of citizens getting access to 3G internet on the behavior
of politicians. For that, our empirical strategy exploits two sources of variation. First,
there was a staggered entry of 3G across municipalities over time, which allows us to
compare the behavior of politicians before and after citizens get access to 3G. Second,
we explore the fact that candidates compete for votes across their entire home state,
which allows us to compare the change in the behavior of politicians across different
municipalities as some of them get access to the 3G network.
12In a context where a single politician represents a congressional district (e.g. in
Canada, U.K or the U.S.), we could use a two-way fixed-effect model and estimate the
following regression:
ymst = β · 3Gmt + λm + δst + ϵmst , (1)
where ymt is the behavior of congressperson m in year t, 3Gmt is an indicator of whether
there is 3G internet in constituency m in year t, λm is a politician and congressional
district fixed-effect that controls for unobserved time-invariant politician and locality
characteristics, δst is a state-by-year indicator that controls flexibly for unobserved state
trends, and ϵmst is an error term. The coefficient of interest is β, which captures the
causal effect of 3G under the identifying assumption that the behavior of politicians
across municipalities with and without 3G access are on parallel trends prior to the entry
of 3G.
Our context allows us to go further and separately control for legislator interacted
with municipality fixed effects. This is important as the legislator-municipality fixed
effects control for the possibility that legislators lobby the mobile operators to bring 3G
to their electoral turf. We can add this fixed effect because each state is a multi-member
district in which multiple legislators compete for votes. Moreover, we observe 3G entry
and political behavior at the municipality level, allowing us to observe the behavior of
multiple legislators in municipalities with and without 3G internet access. Formally, we
can estimate the regression
yimst = β · 3Gmt + λim + δst + ϵimst , (2)
This equation has two differences in comparison to equation 1. First, the unit of obser-
vation is now the triple legislator i, municipality m, and year t. We observe all pairs of
politicians and municipalities in their constituents (i.e., state). Second, we add politician-
municipality pair fixed-effect λim . Again, the coefficient of interest is β.
There are two potential issues with this specification. First, most politicians receive
a meaningful number of votes from a handful of municipalities in their state. As such,
the marginal impact of 3G on a municipality where a politician has little in the way of
electoral incentives should be very close to zero. This is especially true for earmarked
transfers, since the total number of transfers each politician can make are an order of
magnitude smaller than the number of municipalities in their state. Second, as is the
case for any application of difference-in-differences, our identification strategy will be
invalid in the presence of a time-varying omitted variable correlated with 3G entry. This
13would be the case, for example, if mobile operators enter first in, and politicians give
more attention to, municipalities with growing population or income. Although we
show in Section 4 that trends are parallel between municipalities receiving 3G at different
moments within our period of analysis, this could still be an issue.
We deal with both issues by leveraging the three-dimensional structure of our data.
Specifically, we exploit the fact that there is substantial variation in the vote share of
politicians across different municipalities. This allows us to employ a triple-difference
strategy in which we compare the outcome of legislator i before and after the entry of
3G internet across localities where they had different levels of electoral support in the
previous election. Specifically, we estimate the following regression:
yimst = γ · 3Gmt · VoteShareim + λim + δmt + ϕit + ϵismt (3)
where VoteShareim is the vote share of legislator i in municipality m, defined in Equation
(1). For ease of interpretation, we demean the variable VoteShare. This specification
allows us to control for politician-municipality and politician-time fixed effects (λim and
ϕit respectively). The latter fixed effects account for non-linear trends in politicians’
behavior, for example over the electoral cycles. We also control for municipality-time
fixed effects δmt , which helps addressing the concern that 3G entry could correlate with
time-varying unobservable variables in the municipality level.
The coefficient of interest in equation 3 is γ, which captures the difference between the
effect of 3G entry in municipalities where the politicians had more votes and the effect
in municipalities where they had fewer votes. This coefficient allows us to compare the
response of politicians across municipalities with and without 3G access, conditional on
how important those municipalities are for their electoral prospects.
We also estimate a more flexible model where we allow for the effects to be non-
linear with the vote share. For instance, we might expect that politicians will pay special
attention to their electoral strongholds. We thus make a final modification to equation
(3) and allow for non-linear effects, leading to our final specification:
10
yimst = ∑ γτ · 3Gmt · VoteShareDecileim
τ
+ λim + δmt + ϕit + ϵimst (4)
τ =3
τ
where VoteShareDecileim is equal to one if the vote share is in the τ-th decile, and zero
otherwise. In this specification, the main coefficients of interest are the parameters γτ .
All our dependent variables include a large number of zeroes. To deal with that,
unless otherwise stated, we apply the inverse hyperbolic sine transformation (IHS) to the
14dependent variable.21 Finally, the standard errors in specification 1 are clustered in the
municipality level, while specifications 2-4 are two-way clustered at the municipality and
politician levels (Cameron et al., 2011).
4 Results
4.1 Do Politicians Respond to 3G Access in Municipalities?
Municipality-Level Event-Studies
We begin by estimating regressions at the municipality level to examine whether the
introduction of 3G internet affects politicians’ social media activity, speeches, and ear-
marked transfers. These initial regressions help assess the validity of our difference-in-
differences research design. In our setting, we have three groups of municipalities. Those
that gained access to 3G internet before 2011, those that obtained 3G access between 2011
and 2014 (our period of interest), and those that remained unconnected as of 2014.22 The
middle group is “treated” during our period of analysis. However, the other two rep-
resent very different comparison groups regarding the potential impact of 3G access.
What is more, in Table 3, which presents characteristics of municipalities in these dis-
tinct groups, we see that municipalities that get early access to 3G are different in many
observable characteristics compared to those that get connected during our study period
(2011-2014) and afterward. They are, on average, wealthier, larger, and more urban, con-
sistent with telecom companies expanding 3G internet according to a profit-maximizing
objective and targeting first large and more affluent localities.
The identification of the 3G effects hinges on the assumption that municipalities that
gain 3G access between 2011 and 2014 would have, in the absence of connection, followed
trends similar to those in municipalities in the comparison group. To test for the implicit
parallel-trend assumption we adapt (1) in order to run the following event-study-type
specification:
2
ymst = ∑ β j · 3Gm,t+ j + λm + δst + ϵmt , (5)
j=−2
21 The IHS transformation is very similar to log away from zero, but has the advantage of being defined
when the dependent variable has value zero. All our results are robust to using log(1 + x ) transformation
instead.
22 Our primary data contains the month and year that 3G was made available. If the connection happened
after July, we coded the 3G entry for the following year.
15where 3Gm,t+ j is a variable that takes the value of 1 if municipality m gained 3G access
at time t + j, and zero otherwise, excluding municipalities that had 3G prior to 2011.
In Figure 3, we plot the coefficients from estimating equation (5) using two different
control groups: (i) the municipalities that remained unconnected as of 2014; and (ii)
those that were already connected as of 2011. As is clear from the figure, jurisdictions
connected to 3G internet prior to 2011 followed a different trend in Facebook posts and
targeted transfers. Based on the differences in characteristics and pre-trends, we proceed
to use as the control group the localities that remained without access to 3G internet
until after the 2011-2014 legislature. The focus on this group also underscores that the
more natural comparison is not with the municipalities that did not gain 3G access over
the period of analysis because they already had it, but rather with those that remained
without access: not having access at all is rather different from having it throughout.
Figure 4 plots the estimated coefficients from the event-study model using six depen-
dent variables. The first four use measures of Facebook engagement by politicians and
the response from their followers. The last two plots use speeches and targeted trans-
fers to measure politicians’ offline behavior. The results show a quick and meaningful
increase in Facebook activities by politicians and users after a municipality receives 3G
internet. One year after municipalities got 3G internet, politicians’ Facebook posts in-
creased by approximately 10 percent, reaching a 30 percent increase in two years. This
pattern is similar when we measure the number of likes, comments, and shares on these
posts.
The last two plots in Figure 4, in contrast, show a strikingly different story for the
offline behavior of politicians. When municipalities get 3G internet access, they receive
fewer mentions in speeches made in Congress by the legislators (4% fewer mentions in
the year of adoption, and 9% fewer two years later). Moreover, although noisy, we find
no evidence that municipalities getting access to 3G internet receive more transfers from
politicians.
We can aggregate the dynamic treatment effects into a series of differences-in-differences
estimates, which we show in Table 4: municipalities connected to 3G internet have a 16-
percent increase in the number of Facebook mentions by legislators, accompanied by a
4-percent decline in the number of citations in speeches, and an imprecise estimate for
targeted transfers.
Note that our setting displays the “staggered adoption” pattern that has been recently
shown to raise pitfalls for two-way fixed effects research designs. To address such con-
cerns, we implement the procedure suggested by Callaway and Sant’Anna (2021). We
show the results in Appendix Table A2. Panel A reproduces the baseline estimates for
16convenience, and we then adapt our specification to closely match the setting in Call-
away and Sant’Anna (2021) (Panel B), and implement their estimation for the average
treatment effect for the treated subpopulation (ATT, in Panel C).23 We find that all ATT
point estimates are statistically significant, and in fact slightly larger in magnitude than
in previous specifications – with the exception of the effect on transfers, which remains
insignificant and small throughout. This dispels the possibility that the effects we de-
tect are spuriously driven by the well-known biases in estimating two-way-fixed-effects
regressions.
Exploiting the Variation across Politicians and Municipalities
The evidence above is consistent with a substitution pattern between politicians’ online
and offline activities. However, this specification fails to capture heterogeneity in politi-
cian’s behavior in different municipalities. This is especially problematic in the case of
earmarked transfers since politicians only send transfers to a fraction of all municipali-
ties: five, on average, out of hundreds of municipalities in the typical state. To deal with
this issue, we move to the triple-difference model described by equation (3), in which we
interact the 3G entry dummy with the municipality’s share in the legislator’s vote.
In Table 5, we show results from this specification. Note that because we control for a
full set of fixed effects (including for municipality-time), the coefficient on 3G alone is not
identified, and we thus focus our interest on the interaction between the availability of 3G
internet and the vote share of politicians across municipalities, 3G × Voteshare. Column
(1) shows that the entry of 3G internet led the number of posts made by politicians citing
the newly connected municipality to increase by more in places that represented a larger
share of the politician’s vote. For a sense of magnitudes, an increase of one standard-
deviation in the vote share of politicians, relative to the mean, increases the number of
posts citing a municipality with 3G internet by 37 percent. Columns (2)-(4) in turn show
that followers also increased the number of likes, shares and comments to politicians’
posts by more in those localities that represented a large share of the politician’s total
vote in the previous election. Together, these results imply that politicians indeed com-
municate more through social media with voters in localities that are connected to 3G
internet, and particularly so in their political strongholds.
23 The changes with respect to the baseline model are: 1) replace the state-year fixed effects with less
flexible year fixed effects (all specifications have municipality fixed effects); 2) code the treatment variable
as a dummy equal to one if the municipality had 3G signal for more than six months in year t, as opposed
to the share of months with 3G signal we use in the baseline specification. Overall, as shown in Panel B, we
find that the coefficients are similar in magnitude (for the number of posts and speeches) or larger (likes,
shares and comments), or remain insignificant (transfers).
17We examine in columns (5) and (6) of Table 5 how the entry of 3G internet affects
the number of congressional speeches mentioning and of transfers targeted to a given
municipality, depending on its importance to the politician. Municipalities that are one
standard deviation above the average politician’s vote share have 30% less chance of ever
being mentioned in a speech in any given year. Similarly, these localities are also 56% less
likely to receive at least one transfer and receive on average 6.9% less resources, although
the latter estimate is not significant at conventional levels. Together with the results at
the municipality-level, we conclude that these municipalities are likely to have received
less political attention using traditional political tools such as Congressional speeches
and directed transfers.
The specification above already captures part of the heterogeneity in politicians’ be-
havior across municipalities. However, as we noted above, variables such as congres-
sional speeches and transfers, which have a high mass at zero, will likely have non-linear
treatment effects based on the municipality’s importance to the politician. To allow for
these non-linear effects, we estimate the semi-parametric specification from Equation (4),
which interacts the 3G indicator with the vote share decile. We show the results for all six
dependent variables in Figure 5 where each dot represents the γ coefficient for a given
decile with the respective 95% confidence interval in bars.
The first four figures show that access to 3G internet increases the posts made by
politicians, as well as likes, comments and share by Facebook users. These effects are
consistent with our previous results and are stronger for the top two deciles of vote
share, suggesting non-linear treatment effects based on the electoral importance of a
municipality. The bottom two figures show the effects for offline behavior as measured
by speeches and transfers to municipalities. We find that in the top decile – that is, the
localities that account for a large share of the votes obtained by the politician in question
– they reduce both the mentions of a municipality in speeches, as well as the transfers
directed to these municipalities.
In sum, the entry of 3G into a municipality induces politicians for whom that munici-
pality is important to interact more with it online, but also to redirect their offline efforts
away from them, and towards the municipalities in their base of support that remain
outside of the 3G network. In other words, we find a pattern of substitution in which
3G access induces an increase in online interaction at the expense of offline interaction,
relative to important municipalities without 3G.
18Robustness
We also conduct a number of exercises to confirm the robustness of our findings. Our
baseline results input a missing value for the variables that describe Facebook activity
if a politician did not have an open Facebook account in that period, which makes the
panel unbalanced, and we might worry that part of the effect of 3G internet entry comes
from politicians’ response by opening a Facebook account. Figure A1 balances the panel
by restraining the analysis to politicians who already had a public Facebook profile by
2011, and Figure A2 does so by setting values for politicians without an account to zero
instead of a missing value. The results are very similar.
Up to now we have considered that all municipalities are homogeneous, but some
localities are much larger than the others. Because legislators get elected based on total
votes, not vote shares, they might respond differentially to more populous jurisdictions.
In Panel C we account for this by estimating the triple-difference specification weighing
each observation by the population of the municipality. The results shown in Figure
A3 are qualitatively similar from our main specification. In Figure A4, we account for
the fact that 3G internet coverage does not stop at the administrative border between
municipalities, by excluding from the sample municipalities in years when they had not
obtained 3G, but neighboring municipalities already had access to the technology.24 De-
spite a smaller number of observations, results are qualitatively similar from our baseline
specification.
Finally, we also look at the possibility that there would be anticipation effects, where
leads of 3G entry would predict behavior, which could lead to concerns about some
form of endogeneity of entry that would not be picked up by the municipality-time fixed
effects. Figure A5 shows that leads are not significant predictors of politician behavior.
4.2 Looking at the Issues
What do politicians talk about on Facebook?
We have shown that politicians are more likely to mention municipalities on their Face-
book feeds when these municipalities get connected to 3G internet, especially those that
are politically important to them. But do these mentions contain any policy relevant
message? To answer this question we trained a topic modeling algorithm to detect the
24 We defined as neighboring municipality the ones for which the closest distance at any two points in
their polygons is smaller than 50km, which is the maximum coverage of 3G antennas. We also exclude
municipalities that are within the same “population arrangement”, as defined by the Brazilian Statistical
Bureau (IBGE).
19contents of the Facebook messages. We manually classified 2,000 posts into four topics:
two related to the provision of public goods – health and education – and two that mea-
sure direct parliamentary activity in the Congress – projects and amendments. The latter
category is particularly important because, as we have mentioned, transfers to munici-
palities are typically implemented through amendments to the annual budget law. We
then ran a penalized logistic regression to predict our manual classification, using the
count of words mentioned in those posts as explanatory variables. We use the trained
algorithm to automatically detect the topics in the remaining 169,000 posts.25
We use the posts classified by topic to estimate a series of semi-parametric regres-
sions as the ones specified by Equation (4), but replacing the dependent variable with
the number of posts where politician i cites municipality j for a given topic (e.g. educa-
tion). We show the results in Figure 6, panel A, where each color represents a different
topic. The results suggest that politicians indeed used their Facebook pages to con-
vey messages related to policy and legislative policy-making. As 3G internet enters a
municipality, politicians increase the mentions to that municipality in topics related to
education, health, amendments, and projects. Again, this increase is particularly mani-
fest in the politicians political strongholds as measured by share of votes in the previous
election.
What kinds of transfers do politicians shift around?
Along similar lines, we can also ask what kinds of tranfers are driving by the patterns
we have detected. In Figure 6, Panel B, we present results from the same specification,
but using as dependent variables the earmarked transfers classified by topic. To do
so, we use information on the Ministry or government agency that implemented the
earmarked transfer (e.g. Ministry of Education). We focus on spending pertaining to
the five biggest spending categories: 1) health, 2) education, 3) agriculture, development,
and environment, 4) industrial and urban development, and 5) integration and defense.
The results show that, unlike what was the case for online activities, the response in
transfers is more concentrated in some topics. Specifically, it is education- and agriculture-
related projects that are most responsible for the shift from connected to unconnected
municipalities that occurs at the top decile of support. Health and urbanization, in con-
trast, are largely unaffected. That said, we don’t have enough precision to establish
25 We also used combinations of two and three words. Prior to this step, we used the Portuguese dic-
tionary to stem the words, and eliminated the ones which are unlikely to carry predictive power such as
articles. We then evaluated the out-of-the-sample performance of the algorithm, and found that 96% of the
posts that mentioned amendments were correctly classified as such.
20You can also read