INTERIM REPORT 2022 - AWS
←
→
Page content transcription
If your browser does not render page correctly, please read the page content below
INTERIM REPORT 2022
—
                                                           KEY FIGURES
                                                                 —

                                        REVENUE                A DJ U S T E D E B I T                           N PAT

                                  $270.9m▲ 1 6.0%
                                                             $19.2m ▲ 79. 4%
                                                                                                     $6.1m
                                                                                        ▼ 55.5% F R O M A DJ U S T E D R E P O R T E D H Y 2 1
                                     20 21 : $ 2 33. 5 M         2 02 1: $10. 7 M                          2 0 2 1 : $1 3 .8 M

                                    SALES VOLUMES                  NET DEBT                       E M P L OY E E E N G A G E M E N T

                                  48.6k GWT
                                         ▼ 1 1 . 3%
                                                             $175.6m ▼ 3. 0%
                                                                                                   7.5/10       ▼ 2%
                                    20 21 : 54.9k GWT           2 02 1: $181. 0 M                          2 0 2 1 : 7.7/1 0

2   SANFORD INTERIM REPORT 2022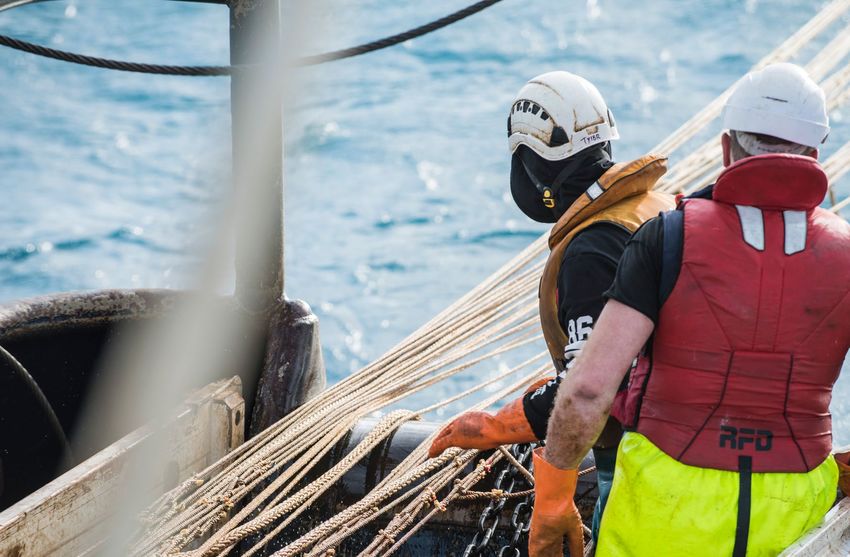
CHAIRMAN AND CEO REVIEW

                                    —                                              Net profit after tax (NPAT) for the first
                                                                                   half is $6.1 million. This would be an
                                                                                                                                       our share of New Zealand’s Quota
                                                                                                                                       Management System remains fixed
                      CHAIRMAN AND                                                 improvement on NPAT for the prior
                                                                                   comparable period, except that in 2021’s
                                                                                                                                       and caps our ability to grow volumes.
                                                                                                                                       Greenshell mussel volume growth has
                       CEO REVIEW                                                  first half NPAT was $13.8 million due to a
                                                                                   gain on sale of $13.4 million, from the sale
                                                                                                                                       also been impacted by the serious
                                                                                                                                       labour shortage being experienced by
                                    —                                              of our cold store facility in Tauranga.             New Zealand’s primary industries. We
                                                                                                                                       can only harvest what we can process and
                                                                                   Revenue has increased by 16.0% from
                                                                                                                                       the shortage of local labour coupled with
                                    Welcome to Sanford’s 2022 Interim              $233.5 million in the first half of 2021
                                                                                                                                       few available workers on working holiday
                                    Report, which lays out our results to          to $270.9 in 2022, due to stronger pricing.
                                                                                                                                       visas has meant we have been unable to
                                    31st March, 2022. In the six months            We are seeing this increased pricing in
                                                                                                                                       expand our processing capacity to meet
                                    covered here, we have seen evidence            the majority of our product categories,
                                                                                                                                       the increased demand.
                                    of a global demand recovery, as food           particularly in some of our whitefish
                                                                                   species. Details of this can be found in            The first half of 2021 was impacted
                                    service re-bounds from the impacts of
                                                                                   the section on wildcatch in this Review.            by Covid-induced closures to foodservice
                                    Covid-19. Through these six months,
                                                                                                                                       worldwide. Results from OpenTable, an
                                    we have leveraged this recovery to             Naturally we have a limited accessible
                                                                                                                                       organisation which surveys approximately
                                    focus on the priorities we previously          resource in our wildcatch division, as
                                    laid out for 2022:
              Sir Robert McLeod
                                    • Rebuild mussel profitability
                  CHAIRMAN
                                    • Grow developing opportunities
                                       in wildcatch
                                    • Retain salmon profitability and
                                       prepare for future growth
                                    Our challenges over this period have
                                    moved from demand for seafood, to
                                    challenges of supply. This explains the
                                    overall picture you will see laid out in the
                                    following pages, of increased revenue and
                                    higher margins, alongside lower volumes.
                                    Adjusted Earnings Before Interest and
                 Peter Reidie       Tax (Adjusted EBIT) was $19.2 million,
          CHIEF EXECUTIVE OFFICER   representing a 79.4% increase on the same
                                    period last year ($10.7 million).              ABOVE   Seafood on display at Sanford and Sons at the Auckland Fish Market.

3   SANFORD INTERIM REPORT 2022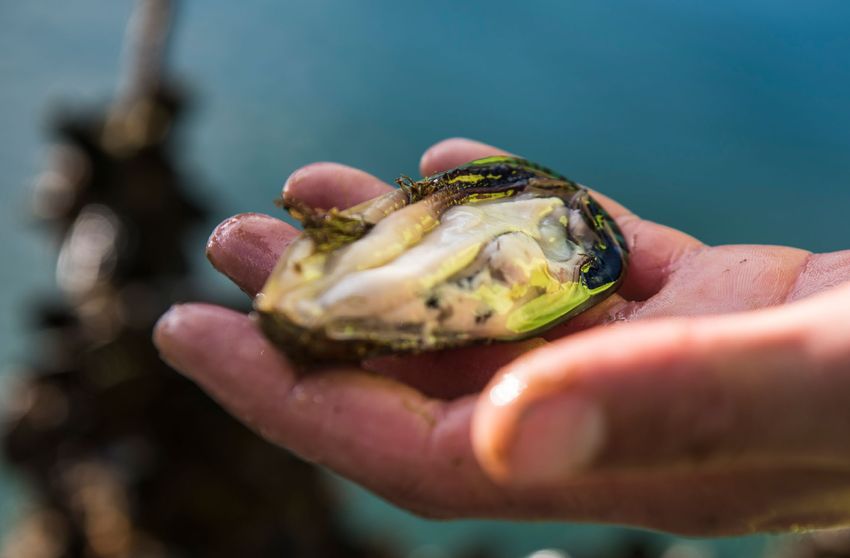
CHAIRMAN AND CEO REVIEW

               20,000 restaurants globally (mostly in                                    prior comparable period (54.9k GWT)             WILDCATCH – FEELING THE GLOBAL                      for whitefish. Sales volumes for deepwater
               North America, Europe and Australia),                                     where we were clearing frozen inventory,        BOUNCE BACK                                         species such as squid and orange roughy
               showed that numbers of seated diners in                                   which had built up due to covid demand          Wildcatch Financial Overview                        were depressed somewhat, due partly to
               food service restaurants dropped 100%                                     impacts. It is worth noting that last year                                                          a slightly later than usual start to the squid
                                                                                         we were maintaining sales volumes by            % Versus            FY      H1     H2          H1   season which we are not expecting to
               compared to pre-pandemic levels from
                                                                                                                                         Last Year         2021    2021    2021       2022
               March through to May of 2020. In March                                    clearing frozen product. That is no longer                                                          catch up, but also some unexpected vessel
               2021, numbers hovered around 40% below                                    the case, and our sales volumes in the first    Sales volumes     7.4% 20.1% -3.5% -20.4%           outages. The strong margins were
               pre-pandemic levels.                                                      half of 2022 are a more direct reflection       Revenue           1.6% -5.6%      2.3%       9.2%   particularly evident in scampi, toothfish
                                                                                         of what we are harvesting, rather than          Profit           11.0%    4.4%   18.7% 108.4%       and hoki.
               This year, we have seen the return of out of                              selling down inventory.
               home dining in the key markets surveyed.                                                                                  contribution                                        In the last two weeks of March, we did see
               Diner numbers for March 2022 have sat at                                  Given the early stage of our recovery, the                                                          some disruption from Covid related impacts
               or above comparable pre-pandemic levels                                   Board has determined not to pay an              Sales volumes for our wildcatch division at         on crew numbers, which meant we were
               in 2019. With around 70% of seafood                                       interim dividend. It remains focused on         29.3k GWT were lower than the previous              not able to operate our deepwater fleet at
               consumed out of home, this is good news                                   returning to normal dividend payments as        comparable period in 2021 (36.7k GWT). The          full capacity. This has been well managed
               for our industry and for Sanford.                                         soon as it is financially prudent to do so.     profit contribution from this division was          by the team in Timaru who have been adept
                                                                                         We are committed to taking a step towards       strong (up 108.4% on the prior comparable           at sourcing crew at short notice and
               Our overall sales volumes were 48.6k                                      this with a modest final dividend payment       period). This was due to improved pricing,          minimising disruptions to fishing schedules.
               greenweight tonne (GWT) for the first half                                at the end of this financial year.              driven by a significant lift in global demand
               of our 2022 year, down by 11.3% on the

                                  Seated Diners in Foodservice Restaurants – Change Relative to 2019, Global

                                            100%
                                             80%
    CHANGE RELATIVE TO PRE-PANDEMIC(2019)

                                             60%
                                             40%
                                             20%
                                              0%
                                            -20%
                                            -40%
                                            -60%
                                            -80%
                                            -100%
                                                    Mar 20   June 20   Sep 20   Dec 20   Mar 21   June 21   Sep 21    Dec 21    Mar 22
               Data source: OpenTable state-of-the-industry, sample of 20,000 restaurants.                                               ABOVE   Sanford’s Ikawai and crew at work.

4              SANFORD INTERIM REPORT 2022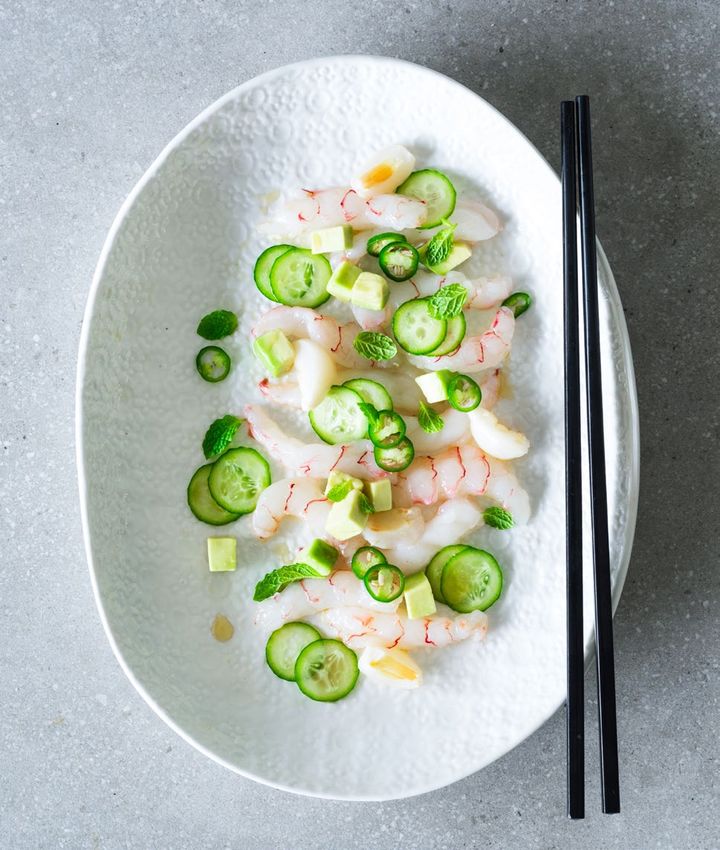
CHAIRMAN AND CEO REVIEW

    FISHING METHODS                                The proportion of catch may be large,
    Despite the excellence of our product,         but the areas where trawling happens
    our real and ongoing commitments to            are small. New Zealand commercial fishers
    sustainability and the importance of our       trawl in less than five percent of our
    industry to New Zealand, commercial            territorial waters. A huge proportion
    fishing’s reputation is often under attack.    (thirty percent) of our territorial seas
    Certain groups have fixated on criticism of    are locked up in benthic protection
    fishing, using exaggeration or distortion to   areas where bottom trawling is excluded.
    paint a picture of the industry which simply   This is something Sanford supports.
    does not match the reality of the one we       Our vessels habitually return to the
    work in every day. An area where this is       same, well established fishing grounds
    particularly acute is trawling. The vast       because that is where the fish are.
    majority of our seafood in New Zealand is      Typically, these grounds are over a
    caught this way – Ministry for Primary         mud or sand bottom. Venturing outside
    Industries (MPI) figures show that around      our usual spots can result in the snagging
    80% of New Zealand’s commercial catch is       of fishing gear, an expensive and time-
    caught by a trawl method.                      consuming mistake which no fisher would
                                                   seek to make.                                  ABOVE   Harvesting mussels in Coromandel.

                                                   In our view, the argument about trawling       which is not acknowledged by critics        MUSSELS – CONSTRAINTS SHIFT TO
                                                   needs to mature and take a step forward        whose minds are often still on the          PRODUCTION
                                                   to focus on location rather than fishing       pre-Quota Management System failures
                                                   method. We support working with all                                                        Greenshell Mussels Financial Overview
                                                                                                  of four decades ago.
                                                   interested parties to make decisions about                                                 % Versus           FY     H1     H2      H1
                                                   where to allow fishing and what areas to                                                   Last Year        2021   2021    2021   2022
                                                   set aside for conservation, as long as these
                                                                                                                                              Sales volumes    4.1% -18.3% 22.9%     5.8%
                                                   decisions are guided by science. Ensuring
                                                   fishing happens in the right places is                                                     Revenue         -16.4% -38.1%   9.7% 24.1%
                                                   something that is much easier with                                                         Profit       -94.7% -95.2% -93.9%      4.5%
                                                   today’s technology, including the recent                                                   contribution
                                                   developments in electronic geo-fencing
                                                   which help ensure our vessels go only                                                      Sales volumes for our Greenshell mussels
                                                   where they should. Mistakes can happen,                                                    were up on the previous comparable
                                                   but we seek, and are making, continuous                                                    period at 16.5k GWT (versus 15.6k GWT for
    ABOVE Looking out from the wheelhouse          improvements in our fishing, something                                                     the first half of the 2021 year).
    on the San Granit.

5   SANFORD INTERIM REPORT 2022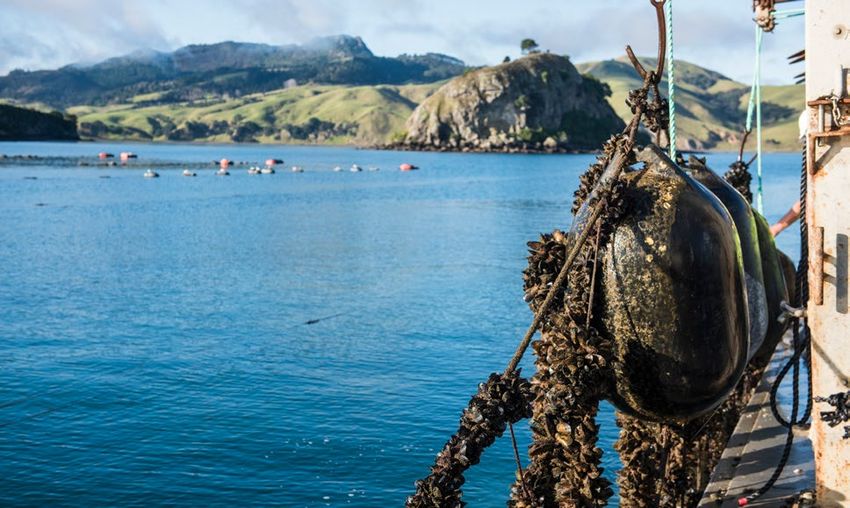
CHAIRMAN AND CEO REVIEW

    Our Greenshell mussel division was the last    the current situation while current
    to be hit by Covid-related market impacts      immigration settings remain in place.
    and has been the last to recover. This is
                                                   We are pleased to report that
    partly because of the nature of our supply
                                                   construction work on our Marine Extracts
    contracts for this product, where prices
                                                   Centre is well underway. This site will allow
    are locked in for defined durations.
                                                   us to double our mussel powder output,
    Our mussels are mostly sold frozen to food     going from the current two dryers to four.
    service venues in the US and Asia and          We already have the demand to absorb this
    these areas are now benefiting from the        increased production and the new site will
    return to out of home dining. As a result,     have the space to allow us to eventually
    we are seeing an improvement in pricing        house eight dryers. With building
    and our outlook for mussel demand is           progressing rapidly, we are confident we
    positive. The challenge we face is on the      will have this facility open and producing
    supply side with an increase in freight        mussel powder from four dryers by the
    costs and with labour shortages in             end of the 2022 calendar year.
    New Zealand impacting our ability to                                                           ABOVE   Sanford’s Big Glory Bay branded salmon.
    process our mussel products. Our               SALMON – STEADY GROWTH IN VOLUMES
                                                   AND REVENUE                                     partly due to increased costs associated          January 2022, spiking earlier than we would
    Havelock and NIML plants are currently
    understaffed and our best efforts to                                                           with managing the risks from warmer               normally see, but have returned to average
                                                   Salmon Financial Overview
    attract new talent have not yielded                                                            waters, increased feed costs and covid            levels in subsequent months. This initiated
                                                   % Versus          FY      H1    H2        H2    impacts on production and staffing levels.        an earlier rise in summer fish mortalities.
    significant results. We, like most primary
                                                   Last Year       2021    2021   2021     2022                                                      These were slower to reduce than we would
    production businesses, are finding there                                                       Readers of this report will have likely
    are simply not enough work-ready               Sales volumes 40.6% 25.4% 58.9% 16.9%                                                             normally observe, however remained small,
                                                                                                   encountered recent publicity about
    New Zealanders available to fill the roles                                                                                                       at around 3.5% of all fish stock from
                                                   Revenue        32.0%    11.8% 57.2% 35.9%       elevated water temperatures in the
    we have and competition for labour is                                                                                                            January to March and were well managed
                                                   Profit          8.5% -22.3% 226.8%      0.8%    Marlborough Sounds, aggravating
    intense. This is a nationwide issue but is                                                                                                       by our Stewart Island team, who have made
                                                   contribution                                    mortality levels for farmed salmon.
    one that is particularly acute in the                                                                                                            several changes to the farm to minimise
                                                                                                   Our farm is in the waters of Stewart Island,
    regional areas where Sanford’s operations                                                                                                        temperature impacts, such as reducing
                                                   Our salmon division has seen continued          seven degrees of latitude south of the
    are based.                                                                                                                                       stocking densities and introducing
                                                   volume and revenue growth in the first          Sounds. We are grateful to be there,
                                                                                                                                                     oxygenation and aeration measures.
    We are seeking to address this challenge       six months of our 2022 year. Sales volumes      in the cooler southern waters, surrounded
    as best we can with a number of initiatives,   were up at 2.9k GWT (versus 2.5k GWT            by a national park.                               Demand for our salmon remains high,
    including increasing the competitiveness       for the prior comparable period), as was                                                          both domestically, where it is available
                                                                                                   That is not to say we are immune
    of our employment terms. However, we           revenue for this area. However, salmon’s                                                          through Foodstuffs’ North Island
                                                                                                   from climate change impacts. Water
    do not see any immediate relief from           profit contribution was only marginally                                                           supermarkets, and internationally.
                                                                                                   temperatures were unusually high in
                                                   higher than the prior comparable period,                                                          Our North American customers continue

6   SANFORD INTERIM REPORT 2022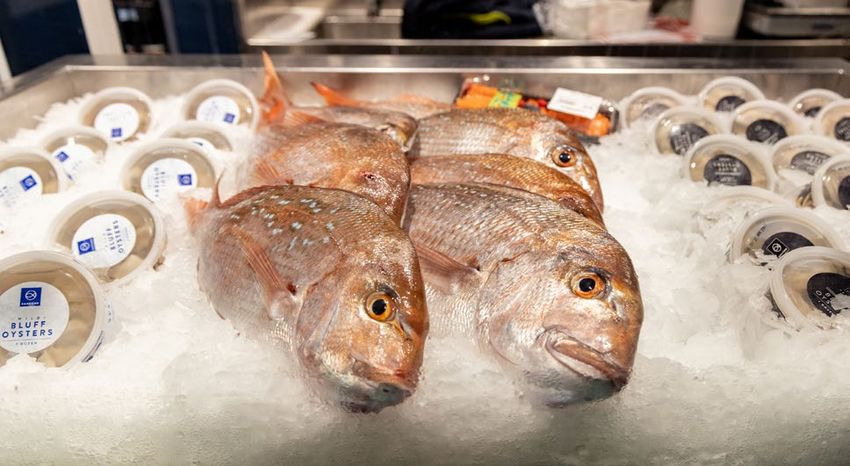
CHAIRMAN AND CEO REVIEW

    to appreciate the quality of our King         carries cameras already – and we are
    salmon and we have continued to see           currently working positively with the
    our Big Glory Bay brand go from               regulator to expand this number.
    strength to strength. This brand is now
                                                  This is a challenging time to be in
    represented in approximately 150 retail
                                                  commercial fishing when there are
    stores in America with ambitions
                                                  considerable forces ranged against our
    to reach 500 over the next 12 months.
                                                  profession. We seek to communicate
    SUSTAINABILITY – NO COMPROMISE                with all stakeholders, to dispel
                                                  misinformation and always make
    Sustainability remains a non-negotiable
                                                  sustainable choices in our business.
    for Sanford. We understand the business
                                                  We intend to lead by example.
    fundamental that there is no Sanford if
    there are no fish. We have been fishing       SANFORD PEOPLE
    since Albert Sanford first went out on the    – COVID’S DOMESTIC IMPACT
    Hauraki Gulf in 1864. We intend to fish       While we have clearly seen the recovery
    and farm in such a way that we are still      in international markets, Covid-19
    fishing, proudly and with respect, in the     made its presence felt domestically in
    next century and beyond.                      our second quarter. After two years
    We have mapped our carbon reduction           of keeping the pandemic largely at bay,
    pathway in line with our emissions            Omicron began its march across
    reduction goals, targeting a 25% reduction    New Zealand, after first being detected
                                                  in the country on the 16th of December,      ABOVE   Luis Fidalgo and Tailo Duffy, members of Sanford’s sales team in the Auckland Office.
    in our operational carbon emissions by
    2030. Steps on this path will include new     2021. Many weeks passed before
    vessels and Tier 3 engine replacements,       Sanford was impacted directly. This was      distancing and other hygiene and safety              reducing the probability of a positive case
    which will introduce lower emissions          not simply a result of good luck. Our        controls, was another tool to keep our               on any vessel which would be at sea for a
    profiles to our fleet; phased rollout of      emphasis on health, safety and wellbeing     people safe from Delta, which was the                period of weeks at a time. In this, we had
    sustainable marine fuels; new ballast water   ensured we had a full suite of controls in   then dominant strain. This policy came into          considerable success, although when
    systems; changes to newer more efficient      place to minimise the risks to our people    effect from the 1st of January 2022.                 Covid community case numbers
    boilers; innovative waste treatment           and to production. We worked closely                                                              rose dramatically, we were forced to make
                                                                                               We sought to acquire Rapid Antigen Tests
    systems; lighting upgrades and changes        with our people to introduce a Covid-19                                                           many last minute crew changes, which
                                                                                               from November, when we applied to the
    to our refrigeration technologies.            vaccine mandate, requiring our staff,                                                             challenged our usual efficiency with
                                                                                               Ministry of Health for a licence to import
                                                  visitors, contractors and sharefishers                                                            getting our vessels to sea.
    We also seek to be a leader in transparency                                                our own kits. We introduced these into the
                                                  to have had two doses of an approved
    and in our work with the wider community.                                                  business as soon as we received stocks in            In the latter part of this half, we also
                                                  Covid-19 vaccine in order to enter a
    We have long supported cameras on                                                          December, prioritising our deepwater fleet           faced considerable staffing challenges in
                                                  Sanford site. This, alongside PPE,
    fishing vessels – half of our inshore fleet                                                based in Timaru. Our focus was on                    our production facilities. Covid-19 induced

7   SANFORD INTERIM REPORT 2022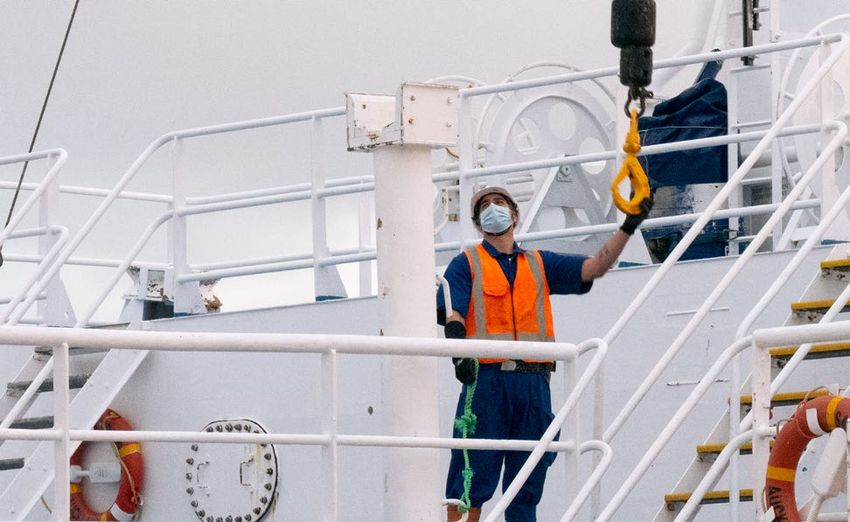
CHAIRMAN AND CEO REVIEW

    absenteeism became an issue in our                Covid hit later and subsequently are        to feed New Zealand and the world while
    Auckland factory first, seeing absences           delayed in emerging from its effects.       keeping our people safe and secure.
    peak at around 52%. The high numbers
                                                      Our ongoing focus on health, safety         It is heartening to see that our
    off work were a combination of actual
                                                      and wellbeing sees us continue to use       engagement scores have not decreased
    Covid cases and staff impacted by the
                                                      Rapid Antigen Testing, masks, other         significantly over the last six months,
    requirement to isolate because of sick
                                                      PPE, screening and all requisite hygiene    despite the difficulties introduced by the
    family members or housemates. The use
                                                      measures to keep our people safe.           pandemic. Our overall engagement
    of Rapid Antigen Testing kept positive
                                                                                                  score remains 7.5/10.
    cases away from our production facilities,        Great credit is due to our teams for
    but the necessary work to maintain                managing their way through these            SUPPLY CHAIN PICTURE IMPROVES
    Covid-free sites has impacted production          challenges. The careful planning done in
                                                                                                  Capacity remains constrained in sea and
    levels. Post the close of the half year, by       2021 paid off. With Covid management
                                                                                                  air freight and we are seeing increased
    mid-April, our Auckland team were seeing          procedures shared, understood and tested,
                                                                                                  costs in this area. However, we have          capacity in the second half of 2022, with
    a return to normal absenteeism. South             teams knew what to expect and how to
                                                                                                  benefited from our contract with Kotahi       passengers returning to the skies, capacity
    Island production facilities however, saw         minimise impacts, making good on our
                                                                                                  which began on the 1st of October, 2021.      for freight is reduced but there is a lag
                                                      pandemic response mission: to continue
                                                                                                  This arrangement will operate for a           before additional flights are introduced.
                                                                                                  minimum of two years and gives Kotahi         We do not anticipate this impact will
                                                                                                  responsibility for all of our frozen export   continue in the longer term.
                                                                                                  product. So far, we have had no issues
                                                                                                  getting our seafood onto vessels, thanks      Our inventory is back to pre-Covid levels.
                                                                                                  to this arrangement – supply chain access     We are seeing good sell-through of
                                                                                                  and capacity issues are better than twelve    product as it is produced or landed and we
                                                                                                  months ago, although we recognise that        expect this to continue. We do not intend
                                                                                                  global capacity is reduced, and we are        to hold significant levels of inventory over
                                                                                                  continuing to see localised constraints.      the second half of 2022.
                                                                                                  For example, issues remain with some          Labour shortages are also impacting our
                                                                                                  foreign ports particularly into parts of      supply chain partners from trucking
                                                                                                  China and the US. We are also seeing          companies to cold stores as businesses
                                                                                                  rising fuel costs produce a significant       across New Zealand feel the effects of the
                                                                                                  cost impost and we expect this to             tight jobs market. This has meant we have
                                                                                                  continue in the second half of the year       had to cast our net wider than usual in
                                                                                                  with both a domestic impact and an            order to get temporary labour to help load
                                                                                                  impact on the cost of exporting. We           containers and perform other duties
                                                                                                  expect to see a reduction in air freight      typically handled by contractors. So far, we

    ABOVE   Crew member Quinten Kino on the San Aspiring berthed in Timaru.

8   SANFORD INTERIM REPORT 2022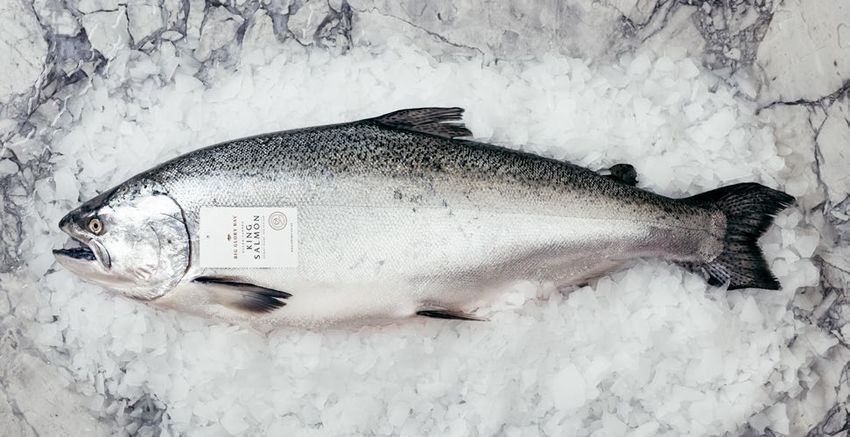
CHAIRMAN AND CEO REVIEW

                                                 flows are strong, and we have around           represented 5.0% of CRA2, 0.3% of CRA7          supporting our hardworking teams,
                                                 $90 million headroom on our current            and 2.3% of CRA8. The sale of our rock          growing our profitability and delivering
                                                 banking facilities.                            lobster shareholding in CRA7 and CRA8 to        what we have promised.
                                                                                                Fiordland Lobster Company and CRA2
                                                 CRAYFISH QUOTA SALE AND STRATEGY               shareholding to Southern Ocean Seafoods         THANKS
                                                 Our five year strategic plan will be shared    Limited will release a total of $54.1 million   As we continue to navigate our way
                                                 in detail with the market and via              for reinvestment into the business.             through the impacts of Covid-19, it is
                                                 publication on the NZX in June. However,                                                       fitting to end this Review with another
                                                                                                We also continue the work to replace our
                                                                                                                                                acknowledgement of the work of our
                                                                                                legacy business and information systems
                                                                                                                                                people. Every single person at Sanford has
                                                                                                through our SanCore programme. During
                                                  Rebuild mussel                                                                                been affected by Covid-19 in one way or
                                                                                                the six months covered by this report we
                                                  profitability                                                                                 another. Despite this, they have continued
                                                                                                successfully introduced Innova, a data
                                                                                                                                                to do what we have asked of them, while
                                                                                                management system which tracks and
                                                                                                                                                operating in very challenging circumstances.
                                                                                                labels our seafood, in our processing plant
                                                  Grow developing                                                                               This is greatly appreciated and it is
                                                                                                in Timaru and onto two of our deepwater
                                                  opportunities                                                                                 gratifying to see their efforts driving a far
    have managed this situation satisfactorily                                                  vessels.
                                                  in wildcatch                                                                                  more palatable result than a year ago. We
    and were able to work to plan in the first
                                                                                                LEADERSHIP CHANGES                              are not yet where we would like to be, but
    half of the year.
                                                                                                                                                our people continue to make an immense
                                                  Retain salmon                                 We now have an expanded and
    BALANCE SHEET AND CASHFLOW                                                                                                                  contribution to getting us there.
                                                  profitability and                             strengthened Executive Team at Sanford.
    We would describe our current debt levels     prepare for                                   We said goodbye to Chief Operating
    as satisfactory, putting us in a strong       future growth                                 Officer Clement Chia in mid-January. We
    position to commence with our strategic                                                     are grateful for the work he did developing
                                                 we have previously reported that we seek a
    plans, including capital spend.                                                             our outstanding operations team which is
                                                 number of primary strategic outcomes and
                                                                                                now ably lead by Acting Chief Operating
    We have managed our debt position out of     three of these, as mentioned at the start                                                      Sir Robert McLeod
                                                                                                Officer Peter Young and GM Fishing Colin
    Covid well and have kept net debt to a       of this Review are to:                                                                         CHAIRMAN
                                                                                                Williams, who also serves on the Executive.
    minimum at $175.6 million. Our balance
                                                 To do this, we need to invest in vessels and   Also strengthening our operational hand is
    sheet strength is good, operating cash
                                                 plants such as our RAS (Recirculating          Chief Supply Chain Officer Louise Wood,
                     NET DEBT
                                                 Aquaculture Systems) hatchery in               who has been part of the Executive since

         $175.6m       ▼ 3.0 %
                                                 Southland. The sale of our spiny rock
                                                 lobster quota in areas CRA2, CRA7 and
                                                 CRA8, announced on April 29th, will assist
                                                                                                January 1st. We are grateful for the depth
                                                                                                of experience these three represent as
                                                                                                they and the wider leadership team
                                                                                                                                                Peter Reidie
                                                                                                                                                CHIEF EXECUTIVE OFFICER

                  2 0 2 1 : $ 1 8 1 .0 M         with this. Sanford’s shareholding              continue to take Sanford forward,

9   SANFORD INTERIM REPORT 2022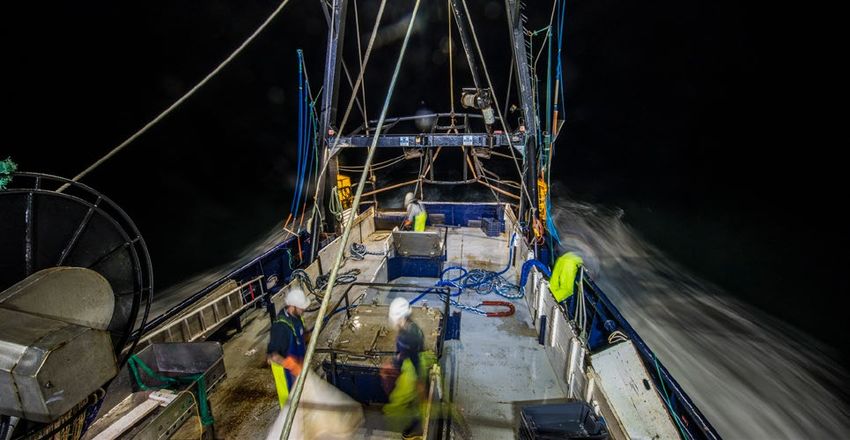
GAAP TO NON-GAAP RECONCILIATION

     Sanford’s standard profit measure prepared under New Zealand GAAP is net profit.          GAAP TO NON-GAAP RECONCILIATION
     Sanford have used non-GAAP measures when discussing financial performance in this
                                                                                                                                                                                       Unaudited
     document. The Directors and management believe that these measures provide useful                                                                             Unaudited            6 Months       Audited
     information as they are used internally to evaluate divisional and total Group                                                                                 6 Months               ended    12 Months
     performance and to establish operating and capital budgets. Non-GAAP profit                                                                                       ended            31 March        ended
                                                                                                                                                                   31 March                 2021 30 September
     measures are not prepared in accordance with NZ IFRS (New Zealand equivalents to                                                                                   2022          (Restated)*        2021
     International Financial Reporting Standards) and are not uniformly defined, therefore
                                                                                                                                                                        dollars               $000                    $000
     the non-GAAP profit measures included in this report are not comparable with those
     used by other companies. They should not be viewed in isolation or as a substitute for    Reported net profit for the period (GAAP)                                6,120              13,753              16,235
     GAAP profit measures as reported by Sanford in accordance with NZ IFRS.                   Add back:
                                                                                               Income tax expense                                                       3,171                1,632               3,800
     DEFINITIONS                                                                               Net interest expense                                                     4,291                4,656               9,011
     Adjusted EBITDA: Earnings before interest, taxation, depreciation, amortisation,          Net gain on sale of investments, property,
     one-off adjusting items, impairment and net gain on sale of investments, intangible and   plant and equipment and intangibles                                            –           (13,221)             (12,935)
     long-term assets.                                                                         Reported EBIT                                                          13,582                 6,820             16,111
     Reported EBIT: Earnings before interest, taxation, net gain on sale of investments,
     intangible and long-term assets.                                                          Adjustments:
     Adjusted EBIT: Reported EBIT adjusted for impairment, restructuring and other             Restructuring costs                                                          91                 233                    288
     one-off items.                                                                            Software as a Service (SaaS) expenditure                                 5,078                3,402               6,183
                                                                                               Other one-off items                                                        428                  219                    711
                                                                                               Adjusted EBIT                                                          19,179               10,674              23,293

                                                                                               Add back:
                                                                                               Depreciation and amortisation                                          13,274               15,140               29,310
                                                                                               Adjusted EBITDA                                                        32,453               25,814              52,603

                                                                                               * Refer to note 2 of the interim financial statements for details on restatement for the period ended 31 March 2021.

10   SANFORD INTERIM REPORT 2022
INTERIM FINANCIAL STATEMENTS
FOR THE SIX MONTHS ENDED 31 MARCH 2022
CONSOLIDATED CONDENSED INCOME STATEMENT 12
CONSOLIDATED CONDENSED STATEMENT
OF COMPREHENSIVE INCOME 13
CONSOLIDATED CONDENSED STATEMENT
OF FINANCIAL POSITION 14
CONSOLIDATED CONDENSED STATEMENT OF CASH FLOWS 15
CONSOLIDATED CONDENSED STATEMENT
OF CHANGES IN EQUITY 17
NOTES TO THE INTERIM FINANCIAL STATEMENTS 19
11 SANFORD INTERIM REPORT 2022INTERIM FINANCIAL STATEMENTS
CONSOLIDATED CONDENSED INCOME STATEMENT
FOR THE SIX MONTHS ENDED 31 MARCH 2022
Unaudited Unaudited Restated* Audited
6 months ended 6 months ended 12 months ended
31 March 2022 31 March 2021 30 September 2021
Note $000 $000 $000
Revenue 3 270,923 233,506 489,625
Cost of sales (222,615) (200,282) (417,991)
Gross profit 48,308 33,224 71,634
Other income 7 1,740 15,898 18,092
Distribution expenses (5,728) (4,893) (10,464)
Administrative expenses (19,029) (14,462) (31,490)
Other expenses 2 (11,747) (9,667) (18,787)
Operating profit 13,544 20,100 28,985
Finance income 176 135 266
Finance expense (4,467) (4,791) (9,224)
Net finance expense (4,291) (4,656) (8,958)
Share of (loss) profit of equity accounted investees 38 (59) 8
Profit before income tax 9,291 15,385 20,035
Income tax expense 2 (3,171) (1,632) (3,800)
Profit for the period 6,120 13,753 16,235
Profit attributable to:
Equity holders of the Company 6,132 13,746 16,263
Non controlling interest (12) 7 (28)
6,120 13,753 16,235
Earnings per share attributable to equity holders of the Company during the period (expressed in cents per share)
Basic and diluted earnings per share (cents) 2 6.5 14.7 17.4
* Refer to note 2 for details on restatement for the period ended 31 March 2021.
12 SANFORD INTERIM REPORT 2022INTERIM FINANCIAL STATEMENTS
CONSOLIDATED CONDENSED STATEMENT OF COMPREHENSIVE INCOME
FOR THE SIX MONTHS ENDED 31 MARCH 2022
Unaudited Unaudited Restated* Audited
6 months ended 6 months ended 12 months ended
31 March 2022 31 March 2021 30 September 2021
$000 $000 $000
Profit for the period (after tax) 6,120 13,753 16,235
Other comprehensive income
Items that may be reclassified to the income statement:
Foreign currency translation differences 402 269 (240)
Change in fair value of cash flow hedges recognised in other comprehensive income 7,587 19,382 15,302
Deferred tax on cash flow hedges (2,124) (5,427) (4,284)
Cost of hedging gains/ (losses) recognised in other comprehensive income 19 (455) (882)
Deferred tax on cost of hedging (5) 127 247
Items that may not be reclassified to the income statement:
Amount of treasury share cost expensed in relation to share-based payment 23 – 22
Other comprehensive income (loss) for the period 5,902 13,896 10,165
Total comprehensive income for the period 12,022 27,649 26,400
Total comprehensive income for the period is attributable to:
Equity holders of the Company 12,025 27,640 26,436
Non controlling interest (3) 9 (36)
Total comprehensive income for the period 12,022 27,649 26,400
* Refer to note 2 for details on restatement for the period ended 31 March 2021.
13 SANFORD INTERIM REPORT 2022INTERIM FINANCIAL STATEMENTS
CONSOLIDATED CONDENSED STATEMENT OF FINANCIAL POSITION
AS AT 31 MARCH 2022
Unaudited Unaudited Audited Unaudited Unaudited Audited
Restated* Restated*
6 months 6 months 12 months 6 months 6 months 12 months
ended ended ended ended ended ended
31 March 31 March 30 September 31 March 31 March 30 September
2022 2021 2021 2022 2021 2021
Note $000 $000 $000 Note $000 $000 $000
Current assets Current liabilities
Cash on hand and at bank 5,417 19,011 3,926 Bank overdraft and borrowings (secured) 4 46,000 55,000 55,000
Trade receivables 85,731 69,504 70,551 Derivative financial instruments 1,664 3,428 3,321
Derivative financial instruments 14,360 11,601 10,234 Trade and other payables 65,987 53,573 49,108
Other receivables and prepayments 7,942 12,041 7,529 Taxation payable 4,459 – –
Biological assets 43,217 27,913 40,240 Lease obligations 4,195 4,501 11,120
Inventories 64,671 85,101 75,499 Total current liabilities 122,305 116,502 118,549
Taxation receivable – 2,633 498
Non-current liabilities
Total current assets 221,338 227,804 208,477
Bank loans (secured) 4 135,000 145,000 127,500
Non-current assets Contributions received in advance 2,350 2,795 2,576
Property, plant and equipment 2 178,591 158,883 167,660 Employee entitlements 1,214 1,251 1,149
Right-of-use assets 30,514 34,912 35,655 Derivative financial instruments 15 5,470 3,181
Investments 3,776 3,991 4,096 Deferred taxation 2 27,710 29,648 28,019
Derivative financial instruments 8,521 14,846 9,051 Lease obligations 23,717 27,317 25,289
Biological assets 16,063 28,260 18,286 Total non-current liabilities 190,006 211,481 187,714
Intangible assets 2 499,624 494,625 497,132 Total liabilities 312,311 327,983 306,263
Total non-current assets 737,089 735,517 731,880
Equity
Total assets 958,427 963,321 940,357
Paid in capital 94,690 94,690 94,690
* Refer to note 2 for details on restatement as at 31 March 2021. Retained earnings 2 536,199 527,550 530,067
Other reserves 14,528 12,356 8,635
Shareholder funds 645,417 634,596 633,392
Non controlling interest 699 742 702
Total equity 646,116 635,338 634,094
Total equity and liabilities 958,427 963,321 940,357
14 SANFORD INTERIM REPORT 2022INTERIM FINANCIAL STATEMENTS
CONSOLIDATED CONDENSED STATEMENT OF CASH FLOWS
FOR THE SIX MONTHS ENDED 31 MARCH 2022
Unaudited Unaudited Audited Unaudited Unaudited Audited
Restated Restated
6 months 6 months 12 months 6 months 6 months 12 months
ended ended ended ended ended ended
31 March 31 March 30 September 31 March 31 March 30 September
2022 2021* 2021 2022 2021* 2021
Note $000 $000 $000 Note $000 $000 $000
Cash flows from operating activities
Receipts from customers 268,494 222,607 493,500 Cash flows from financing activities
Interest received 176 135 213 Proceeds from borrowings 4 27,500 20,000 50,000
Dividends received – – 7 Repayment of term loans 4 (20,000) (5,000) (52,500)
Payments to suppliers and employees 2 (227,611) (212,626) (451,165) Lease payments (9,049) (9,130) (11,017)
Income tax paid (779) (771) (1,191) Dividends paid to non controlling
Interest paid (4,444) (4,805) (9,131) shareholders in subsidiaries – (27) –
Net cash flows from operating Net cash flows from financing
activities 35,836 4,540 32,233 activities (1,549) 5,843 (13,517)
Cash flows from investing activities Net (decrease) increase in cash and
cash equivalents 10,356 18,070 3,233
Sale of property, plant and equipment – 24,011 23,419
Effect of exchange rate fluctuations on
Acquisition of shares in other companies (12) – –
cash held 135 194 (54)
Sale of investments 115 – –
Cash and cash equivalents at beginning
Dividends received from associates 250 – 177 of the period (51,074) (54,253) (54,253)
Purchase of property, plant and Cash and cash equivalents at end of
equipment and intangible assets 2 (24,284) (16,324) (39,079) the period (40,583) (35,989) (51,074)
Net cash flows from investing
activities (23,931) 7,687 (15,483)
Represented by:
Bank overdraft and borrowings
(secured) (46,000) (55,000) (55,000)
Cash on hand and at bank 5,417 19,011 3,926
(40,583) (35,989) (51,074)
* Refer to note 2 for details on restatement for the period ended 31 March 2021.
15 SANFORD INTERIM REPORT 2022INTERIM FINANCIAL STATEMENTS
CONSOLIDATED CONDENSED STATEMENT OF CASH FLOWS (CONTINUED)
FOR THE SIX MONTHS ENDED 31 MARCH 2022
Reconciliation of Profit for the Period with Net Cash Flows from Operating Activities
Unaudited Unaudited Audited Unaudited Unaudited Audited
6 months 6 months 12 months 6 months 6 months 12 months
ended ended ended ended ended ended
31 March 31 March 30 September 31 March 31 March 30 September
2022 2021* 2021 2022 2021* 2021
$000 $000 $000 $000 $000 $000
Movement in working capital
Profit for the period (after tax) 6,120 13,753 16,235
Increase in trade and other receivables
and prepayments (16,053) (18,777) (16,779)
Adjustments for non-cash items
Decrease in inventories 10,868 379 10,159
Depreciation and amortisation 13,274 15,140 29,310
Increase in trade and other payables
Depreciation – ACE 3,402 3,444 6,805 and other liabilities 16,923 6,530 1,670
Share-based payment expense 23 – 22 Increase in taxation payable 4,948 1,391 3,504
Share of loss (profit) of equity 16,686 (10,477) (1,446)
accounted investees (38) 59 (8)
Change in fair value of biological assets (755) (2,239) (4,593)
Items classified as investing activities
Change in fair value of forward
Loss (gain) loss on sale of property,
exchange contracts and foreign
plant and equipment – (13,221) (12,928)
currency options (799) (1,616) (1,367)
– (13,221) (12,928)
Decrease in deferred tax (2,425) (528) (893)
Net cash flows from operating
Decrease in contributions received
activities 35,836 4,540 32,233
in advance (266) (156) (375)
Unrealised foreign exchange losses 600 481 1,468 * Refer to note 2 for details on restatement for the period ended 31 March 2021.
Other 14 (100) 3
13,030 14,485 30,372
16 SANFORD INTERIM REPORT 2022INTERIM FINANCIAL STATEMENTS
CONSOLIDATED CONDENSED STATEMENT OF CHANGES IN EQUITY
FOR THE SIX MONTHS ENDED 31 MARCH 2022
Share Based Cash Flow Cost of Non
Share Payment Translation Hedge Hedging Retained Controlling Total
Capital Reserve Reserve Reserve Reserve Earnings Total Interest Equity
$000 $000 $000 $000 $000 $000 $000 $000 $000
Balance at 1 October 2021 (audited) 94,690 22 338 8,075 200 530,067 633,392 702 634,094
Profit for the period (after tax) – – – – – 6,132 6,132 (12) 6,120
Other comprehensive income
Foreign currency translation differences – – 393 – – – 393 9 402
Hedging gains/(losses) recognised in other comprehensive income – – – 7,587 19 – 7,606 – 7,606
Deferred tax on change in reserves – – – (2,124) (5) – (2,129) – (2,129)
Amount of treasury share cost expensed in relation to
share-based payment – 23 – – – – 23 – 23
Total comprehensive income – 23 393 5,463 14 6,132 12,025 (3) 12,022
Balance at 31 March 2022 (unaudited) 94,690 45 731 13,538 214 536,199 645,417 699 646,116
Restated Balance at 1 October 2020 (audited)* 94,690 – 570 (2,943) 835 513,804 606,956 665 607,621
Profit for the period (after tax) – – – – – 16,263 16,263 (28) 16,235
Other comprehensive income
Foreign currency translation differences – – (232) – – – (232) (8) (240)
Hedging gain/(losses) recognised in other comprehensive income – – – 15,302 (882) – 14,420 – 14,420
Deferred tax on change in reserves – – – (4,284) 247 – (4,037) – (4,037)
Amount of treasury share cost expensed in relation to
share-based payment – 22 – – – – 22 – 22
Total comprehensive income – 22 (232) 11,018 (635) 16,263 26,436 (36) 26,400
Shares issued to non-controlling shareholders in subsidiaries – – – – – – – 100 100
Distributions to shareholders – – – – – – – (27) (27)
Balance at 30 September 2021 (audited) 94,690 22 338 8,075 200 530,067 633,392 702 634,094
* Refer to note 2 and the Sanford 2021 integrated report for details on restatement as at 1 October 2020.
17 SANFORD INTERIM REPORT 2022INTERIM FINANCIAL STATEMENTS
CONSOLIDATED CONDENSED STATEMENT OF CHANGES IN EQUITY (CONTINUED)
FOR THE SIX MONTHS ENDED 31 MARCH 2022
Share Based Cash Flow Cost of Non
Share Payment Translation Hedge Hedging Retained Controlling Total
Capital Reserve Reserve Reserve Reserve Earnings Total Interest Equity
Note $000 $000 $000 $000 $000 $000 $000 $000 $000
Restated Balance at 1 October 2020 (audited)* 94,690 – 570 (2,943) 835 513,804 606,956 665 607,621
Restated profit for the period (after tax) 2 – – – – – 13,746 13,746 7 13,753
Other comprehensive income
Foreign currency translation differences – – 267 – – – 267 2 269
Hedging gains recognised in other comprehensive income – – – 19,382 (455) – 18,927 – 18,927
Deferred tax on change in reserves – – – (5,427) 127 – (5,300) – (5,300)
Total comprehensive income – – 267 13,955 (328) 13,746 27,640 9 27,649
Shares issued to non-controlling shareholders in subsidiaries – – – – – – – 95 95
Distributions to shareholders – – – – – – – (27) (27)
Restated balance at 31 March 2021 (unaudited) 94,690 – 837 11,012 507 527,550 634,596 742 635,338
* Refer to note 2 and the Sanford 2021 integrated report for details on restatement as at 1 October 2020.
18 SANFORD INTERIM REPORT 2022INTERIM FINANCIAL STATEMENTS
NOTES TO THE INTERIM FINANCIAL STATEMENTS
FOR THE SIX MONTHS ENDED 31 MARCH 2022
NOTE 1 – GENERAL INFORMATION NOTE 2 – BASIS OF PREPARATION and customisation costs as a cumulative equity adjustment of $4.0m net of tax at
Sanford Limited (‘the parent’ or ‘the 1 October 2020 (refer to the Sanford 2021 integrated report for details). Henceforth,
(i) Significant accounting policies
Company’) is a profit-oriented company comparative information for the six months ended and as at 31 March 2021 presented
The Group’s accounting policies have in these interim financial statements are also restated. The following tables present the
that is domiciled and incorporated in
been applied consistently to all periods impact from the said restatements:
New Zealand. The Company is registered
presented in these interim financial
under the Companies Act 1993 and listed
statements, and have been applied Carried
on the New Zealand Stock Exchange forward
consistently by Group entities, except
(NZX). The Company is an FMC entity for cumulative
as detailed below in note 2(ii). adjustment at
the purposes of Part 7 of the Financial
STATEMENT OF Previously 1 October
Markets Conduct Act 2013. (ii) New and amended accounting FINANCIAL POSITION reported 2020 Adjustment Restated
interpretation adopted: IAS 38 Balance at 31 March 2021 $000 $000 $000 $000
The interim financial statements
Intangible Asset
presented are for Sanford Limited Intangible assets 494,285 340 – 494,625
(‘Sanford’ or ‘the Group’) as at and for The IFRS Interpretations Committee
Deferred taxation (32,160) 1,559 953 (29,648)
the six months ended 31 March 2022. (‘IFRIC’) has issued two final agenda
decisions relating to Software-as-a- Property, plant and equipment 168,190 (5,905) (3,402) 158,883
The Group comprises the Company, its Service (‘SaaS’) cloud computing Other assets/(liabilities) 11,478 – – 11,478
subsidiaries and its investments in joint arrangements. In the March 2019 agenda Net assets 641,793 (4,006) (2,449) 635,338
arrangements and associates. decision, IFRIC considers whether an Retained earnings 534,005 (4,006) (2,449) 527,550
The interim financial statements are entity should recognise an intangible Other equity balances 107,788 – – 107,788
prepared in accordance with NZ IAS 34: asset in a cloud computing arrangement Total equity 641,793 (4,006) (2,449) 635,338
Interim Financial Reporting. The interim if the contract does not contain a lease
financial statements and the restated of the underlying software or if the
Previously
comparative information for the six entity has no control of the underlying INCOME STATEMENT reported Adjustment Restated
months ended 31 March 2021 are software. The assessment is done at
For the six months ended 31 March 2021 $000 $000 $000
unaudited. The comparative information the commencement of the contract.
The April 2021 IFRIC agenda decision Other expenses (6,265) (3,402) (9,667)
for the year ended 30 September 2021
considers how an entity accounts for Profit before income tax 18,787 (3,402) 15,385
are audited.
configuration or customisation costs in Income tax expense (2,585) 953 (1,632)
The Group is a large and long-established a SaaS cloud computing arrangement. Profit for the period 16,202 (2,449) 13,753
fishing and aquaculture farming business
devoted entirely to the farming, The Group retrospectively adopted the
interpretations at 1 October 2020, Earnings per share 17.3 (2.6) 14.7
harvesting, processing, storage and
marketing of quality seafood products resulting in the derecognition of
and investments in related activities. previously capitalised configuration
19 SANFORD INTERIM REPORT 2022INTERIM FINANCIAL STATEMENTS
NOTES TO THE INTERIM FINANCIAL STATEMENTS (CONTINUED)
FOR THE SIX MONTHS ENDED 31 MARCH 2022
NOTE 2 – BASIS OF PREPARATION (CONTINUED) (iv) Comparative information
(ii) New and amended accounting interpretation adopted: IAS 38 Intangible Asset Certain expenses in the consolidated condensed income statements for the six months
(continued) ended 31 March 2021 and year ended 30 September 2021 have been reclassified from
cost of sales to administrative expenses to align with the nature of the expenses.
Previously
STATEMENT OF CASH FLOWS reported Adjustment Restated
For the six months ended 31 March 2021 $000 $000 $000 NOTE 3 – SEGMENT REPORTING
Payments to suppliers and employees (209,224) (3,402) (212,626) The Group’s key operating divisions are:
Net cash flow from operating activities 7,942 (3,402) 4,540 • wildcatch – responsible for catching and processing inshore and deepwater fish
Purchase of property, plant and equipment species; and
and intangible assets (19,726) 3,402 (16,324) • aquaculture – responsible for farming, harvesting and processing mussels and salmon.
Net cash flow used in investing activities 4,285 3,402 7,687
Executive management of the Group monitors the operating results of the wildcatch
(iii) Impact of COVID-19 and aquaculture (mussels and salmon) divisions. Divisional performance is evaluated
The Group’s financial performance and financial position continue to be impacted by the based on operating profit or loss. Capital expenditure consists of additions of property,
COVID-19 global pandemic. An assessment of the impact of COVID-19 on the Group’s plant and equipment and intangible assets.
31 March 2022 statement of financial position is set out below: The Group has determined that the divisions above should be aggregated to form one
reportable segment to reflect the farming, harvesting, processing and selling of seafood
Balance Sheet item COVID-19 Assessment
products, due to the aggregated manner in which performance is monitored. Further
Recovered demand from re-opened international economies and their information on segment reporting is included in the financial statements for the year
foodservice industries, complemented by favourable sales prices achieved
Trade and other ended 30 September 2021.
across the Group’s white fish, salmon and mussels businesses, have
receivables
contributed to an increase in trade receivables since September 2021.
No significant issues are noted at 31 March 2022 in respect of credit risk.
Seaford inventory levels fell in terms of value by 30% relative to
March 2021. In addition the positive reopening of several export
hospitality markets has also seen inventory levels fall in this half-year
by 14%, when compared to the September 2021 year end. Sanford has
Inventories been able to take advantage of increasing demand enabling inventory
levels to fall to near pre-Covid levels. The inventory balance reflects the
inclusion of a $2.7 million provision in order to appropriately value
inventory to its net realisable value. The group does not have ageing
issues in respect of inventory.
20 SANFORD INTERIM REPORT 2022INTERIM FINANCIAL STATEMENTS
NOTES TO THE INTERIM FINANCIAL STATEMENTS (CONTINUED)
FOR THE SIX MONTHS ENDED 31 MARCH 2022
NOTE 3 – SEGMENT REPORTING (CONTINUED) NOTE 4 – BANK LOANS (SECURED)
Unaudited Unaudited Audited Carrying and face value
6 months 6 months 12 months
ended ended ended Unaudited Unaudited Audited
31 March 31 March 30 September 31 March 31 March 30 September
2022 2021 2021 2022 2021 2021
REVENUE BY GEOGRAPHICAL LOCATION
OF CUSTOMERS $000 $000 $000 $000 $000 $000
New Zealand 105,539 97,047 201,415 Balance at beginning of period 182,500 187,210 187,210
Australia 34,434 35,870 85,293 Bank loans
North America 44,170 31,023 60,265 Proceeds 27,500 20,000 50,000
Europe 26,961 26,862 51,653 Repaid (20,000) (5,000) (52,500)
China 37,039 22,212 49,777
Bank overdraft and short term borrowings
Other Asia 8,488 8,342 15,628
Movement (9,000) (2,210) (2,210)
Japan 7,204 5,635 11,004
Balance at end of period 181,000 200,000 182,500
South Korea 3,428 2,206 4,730
Interest rates applicable 1.7%-2.6% 0.95-1.46% 0.98% – 1.72%
Hong Kong 1,009 1,830 4,569
Bank loans are secured by a general security interest over property and a mortgage
Middle East 2,591 1,774 3,757
over quota shares.
Africa 18 384 693
All borrowings are subject to covenant arrangements. The Group has complied with
Pacific 42 246 505
all covenants during the period (six months ended 31 March 2021 and year ended
Other – 75 336
30 September 2021: all covenants were complied with).
Revenue 270,923 233,506 489,625
In April 2022, the secured term loans expiring on 30 April 2022 were extended to
The revenue information above is based on the delivery destination of sales. 30 April 2023.
The Group has no customers accounting for more than 10% of total sales for the The repayment dates of secured term loans outstanding and totalling $135.0m at
current period (six months ended 31 March 2021: none, year ended 30 September 2021: 31 March 2022 are:
one customer). • 30 April 2023: $25.0m;
• 1 October 2024: $55.0m;
• 30 November 2024: $40.0m and
• 15 April 2026: $15.0m.
Interest rates for all loans are floating based on the bank bill rate plus a margin.
The Group’s policy for term loans is to hedge between 25% and 75% of floating
rate debt by using interest rate swaps.
21 SANFORD INTERIM REPORT 2022INTERIM FINANCIAL STATEMENTS
NOTES TO THE INTERIM FINANCIAL STATEMENTS (CONTINUED)
FOR THE SIX MONTHS ENDED 31 MARCH 2022
NOTE 5 – DIVIDENDS Unaudited Unaudited Audited
On 22 May 2022 the Directors have determined that no interim dividend will be paid in 6 months 6 months 12 months
ended ended ended
respect of the six months ended 31 March 2022 (31 March 2021 interim dividend: $nil, 31 March 31 March 30 September
30 September 2021 final dividend: $nil). 2022 2021 2021
$000 $000 $000
NOTE 6 – FINANCIAL INSTRUMENTS
Carrying amounts and fair values Derivative financial assets (liabilities)
measured at fair value (ii)
The following table shows the carrying amounts and fair values of financial assets and
financial liabilities at reporting date. Forward exchange contracts (Level 2) 12,623 17,781 11,554
Foreign currency options (Level 2) 3,531 5,282 3,588
Unaudited Unaudited Audited Interest rate swaps (Level 2) 1,360 (7,529) (4,136)
6 months 6 months 12 months
ended ended ended Fuel swaps (Level 2) 3,688 2,015 1,777
31 March 31 March 30 September Total net derivative financial assets 21,202 17,549 12,783
2022 2021 2021
(i) Presented at carrying value which is equivalent to fair value.
$000 $000 $000
(ii) Presented at fair value.
Non-derivative financial assets not measured
at fair value (i) Other payables that are not financial liabilities are excluded above (provisions
Trade receivables 85,731 69,504 70,551 and employee entitlements: March 2022: $8.6m, March 2021: $8.0m,
Cash and cash equivalents 5,417 19,011 3,926 September 2021: $9.2m).
Other receivables – advances to associates 294 622 457
Shares in other companies (Level 3) 109 97 97
Non-derivative financial liabilities not
measured at fair value (i)
Bank overdraft and short term borrowings
(secured) (46,000) (55,000) (55,000)
Trade and other payables (56,927) (45,576) (40,775)
Bank loans (secured) (135,000) (145,000) (127,500)
Total net non-derivative financial liabilities (146,376) (156,342) (148,244)
22 SANFORD INTERIM REPORT 2022INTERIM FINANCIAL STATEMENTS
NOTES TO THE INTERIM FINANCIAL STATEMENTS (CONTINUED)
FOR THE SIX MONTHS ENDED 31 MARCH 2022
NOTE 7 – OTHER INCOME NOTE 10 – SUBSEQUENT EVENTS
31 March 2021 and 30 September 2021 – Sale of Mt Maunganui cold store On 29th April 2022 Sanford completed the unconditional sale of its spiny (red) rock
lobster quota in Fisheries Management Areas CRA7 and CRA8 to Deltop Holdings
On 17 December 2020, the Group disposed of its Mt Maunganui cold store for a total
Limited, a subsidiary of Fiordland Lobster Company Limited. The sale which included
consideration of $16.1m. The gain of $13.4m on this disposal was recognised as other
some annual catch entitlement (ACE) was for a consideration of $49.3m, giving rise
income in the six months ended 31 March 2021 and year ended 30 September 2021.
to a gain on sale of $41.8m (net of transaction costs). The financial impact of this sale will
be recognised in the second half of the year.
NOTE 8 – IMPAIRMENT OF ASSETS
Additionally, refer to note 4 for the renewal of secured term loans that took place
No impairment losses are recognised in the six months ended 31 March 2022 and
subsequent to balance date.
31 March 2021, and in the year ended 30 September 2021.
NOTE 9 – CONTINGENT LIABILITIES AND COMMITMENTS
(a) Contingent liabilities
Unaudited Unaudited Audited
31 March 31 March 30 September
2022 2021 2021
$000 $000 $000
Guarantees 801 801 797
The Group has guarantees with its commercial banking partners. In this respect the Group
treats the guarantee contracts as contingent liabilities until such times as it becomes
probable that the Group will be required to make payments under the guarantees.
(b) Commitments
The estimated capital expenditure for property, plant and equipment contracted for at
reporting date but not provided is $5.3m (31 March 2021: $8.0m, 30 September 2021:
$12.5m).
23 SANFORD INTERIM REPORT 2022DIRECTORY
BOARD OF DIRECTORS PRINCIPAL BANKERS MANAGING YOUR
SHAREHOLDING ONLINE
Sir Robert McLeod, Chairman ANZ Bank New Zealand Limited
Mark Cairns Bank of New Zealand To change your address, update your
Peter Cullinane Rabobank New Zealand Limited payment instructions and to view your
Craig Ellison investment portfolio including
SOLICITORS transactions please visit:
Abigail (Abby) Foote
Peter Kean Chapman Tripp www.investorcentre.com/nz
Fiona Mackenzie Russell McVeagh
GENERAL ENQUIRIES
EXECUTIVE TEAM GROUP AUDITORS
General enquiries can be directed to:
Peter Reidie, Chief Executive Officer KPMG, Auckland enquiry@computershare.co.nz
Paul Alston, Chief Financial Officer STOCK EXCHANGE Private Bag 92 119
Karen Duffy, Chief People Officer Victoria Street West
The Company’s shares trade on the
Andre Gargiulo, Chief Customer Officer Auckland 1142
New Zealand Stock Exchange (NZX).
Peter Young, Acting Chief Operating Officer New Zealand
NZX Trading Code: SAN
Louise Wood, Chief Supply Chain Officer Telephone +64 9 488 8777
The minimum marketable parcel on the
Colin Williams, General Manager Fishing Please assist our registrar by quoting your
Exchange is 100 shares (price $2 to $5
CSN or shareholder number.
REGISTERED OFFICE per share) or 50 shares ($5 to $10 per
share) Other queries should be directed to the
22 Jellicoe Street
General Manager Corporate Affairs at the
Freemans Bay SHARE REGISTRAR Registered Office.
Auckland 1010
Computershare Investor Services Limited
New Zealand
Private Bag 92 119
PO Box 443 Victoria Street West
Shortland Street Auckland 1142
Auckland 1140 New Zealand
New Zealand
159 Hurstmere Road
Telephone +64 9 379 4720 Takapuna
Email info@sanford.co.nz Auckland 0622
Website www.sanford.co.nz New Zealand
24 SANFORD INTERIM REPORT 2022KEY FIGURES
SCAMPI SASHIMI
SERVES TWO – FOUR
PREP TIME – 20 MINUTES
Our delicate scampi sashimi is sure to delight your taste buds
with a beautiful balance of sweet lychee, sour lime and
spice from the chilli.
INGREDIENTS METHOD
500g scampi 1. In a bowl, combine lime juice, avocado,
lychees, cucumber and green chilli.
2 tablespoons fresh lime juice
2. Carefully break off the scampi heads
½ avocado, cubed and using a sharp knife, split the tail
4 lychees, stone removed and down the centre and remove the
sliced into quarters stomach and intestinal tract.
Remove the flesh and set aside.
1 mini cucumber, thinly sliced
1 green chilli, thinly sliced TO ASSEMBLE
Place scampi flesh on a plate and the
combined ingredients from step 1.
Drizzle over any leftover lime juice.
Serve immediately.
RECIPE AND IMAGE COURTESY OF SANFORD AND SONS .
25 SANFORD INTERIM REPORT 2022SANFORD.CO.NZ
You can also read