Interagency Workshop on Societal Applications of Satellite Data for Ocean Health and Fisheries
←
→
Page content transcription
If your browser does not render page correctly, please read the page content below

The Earth Observer                            January - February 2018                              Volume 30, Issue 1            09

   Interagency Workshop on Societal Applications of

                                                                                                                            meeting summaries
   Satellite Data for Ocean Health and Fisheries
   Alan Ward, NASA Goddard Space Flight Center, Global Science and Technology, Inc., alan.b.ward@nasa.gov
   Stephanie Schollaert Uz, NASA’s Goddard Space Flight Center, stephanie.uz@nasa.gov

Introduction

In addition to the crucial role the ocean plays in regulating Earth’s climate, a healthy
ocean benefits people as a source of food and livelihood. However, industrialized
society is taxing ocean life through increased pollution, warming, changing chem-
istry, and over-fishing, which all threaten food, economic, and human security.
Identifying and tracking marine biological indicators and their response to multiple
stressors can guide sustainable management and conservation efforts.

From the vantage point of space, Earth observation by satellites allow for global
ocean monitoring in the present and offer even greater potential for the future.
Ocean-color sensors measure light reflecting off the water, yielding valuable ecologi-
cal information such as the concentration of chlorophyll and detrital material, both           To initiate a discussion
indicative of the state of ocean biology and its overall health. Satellite remote sensing      on the opportunities
of ocean color is challenging because it requires a cloud-free view and the subtrac-           and challenges of Earth
tion of contributions from the intervening atmosphere. Furthermore, the ocean is               observation for the
dynamic and constantly changing, in a way that is more similar to weather systems              ocean sector, NASA and
in the atmosphere than vegetation on land, which has a slower rate of change.                  the World Resources
To initiate a discussion on the opportunities and challenges of Earth observation              Institute (WRI)
for the ocean sector, NASA and the World Resources Institute (WRI) organized a                 organized a one-day,
one-day, interactive workshop that focused on current and future uses of ocean satel-          interactive workshop
lite data products to support decision making in the context of ocean health, fisher-          that focused on current
ies, and human security. The workshop took place on November 2, 2017, at WRI                   and future uses of ocean
Headquarters in Washington, DC. The meeting was also live-streamed via Adobe                   satellite data products to
Connect. More than 150 local and remote participants came from a wide range of                 support decision making
communities, including satellite data providers, current and potential new data
                                                                                               in the context of ocean
users from diverse domestic and international governmental agencies, nongovern-
                                                                                               health, fisheries, and
mental organizations, and private businesses. The attendees represented a variety
of backgrounds including research, resource management, policy, national security,             human security.
public health, education, and the fishing industry. Also in attendance at the work-
shop was Paul Doremus, the Chief Operating Officer of the National Oceanic and
Atmospheric Administration’s (NOAA) Fisheries and Acting Assistant Secretary for
Conservation and Management.

The workshop began with a series of overview presentations to introduce its goals
and provide background on existing and emerging satellite data products. These
presentations addressed agency programs and priorities for satellite applications.
Four panel discussions were followed by a closing keynote address from Paul Woods
[Global Fishing Watch (GFW)—Chief Technology Offficer] on GFW, a software
package used for fishing vessel tracking. Several presentations during the meeting
highlighted applications of GFW. The four panels engaged workshop participants in
discussions on the themes of ocean health in the context of climate change, fisheries
and ecosystem health, links between fisheries and human security, and resources and
tools for accessing ocean satellite data products. To facilitate interaction between
participants, the agenda budgeted time for formal discussion throughout the meet-
ing and also provided ample opportunity for informal discussion and networking
between participants during coffee breaks and lunch. A summary of meeting high-
lights follows. The full agenda, all presentations, and recordings are available from
the workshop website at http://www.wri.org/events/2017/11/nasa-wri-ocean-health-
and-fisheries-applications-workshop.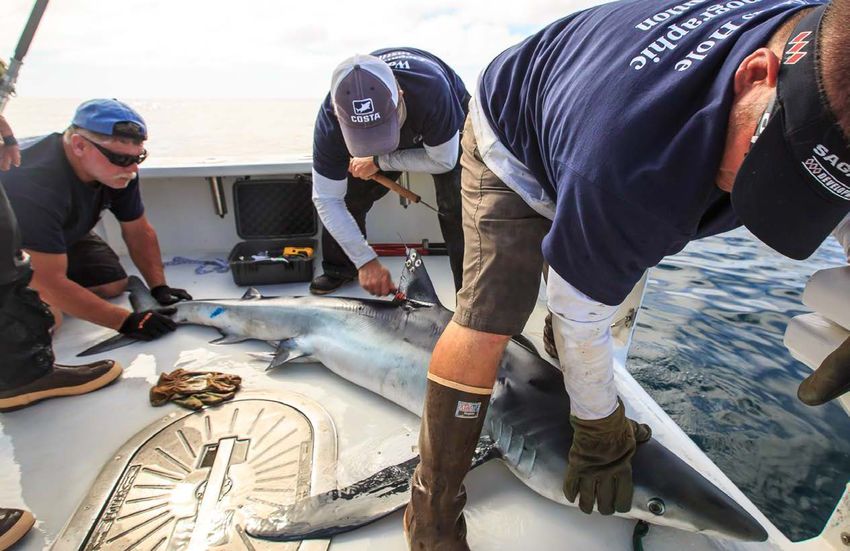
10             The Earth Observer                          January - February 2018                              Volume 30, Issue 1

                                                 Introductions and Overview
meeting summaries
                                                 Stephanie Uz [NASA’s Goddard Space Flight Center (GSFC)—Applied Sciences
                                                 Manager] opened the meeting by welcoming participants and outlining the day's agenda
                                                 that was planned by NASA and WRI, working closely with NOAA—the agency respon-
                                                 sible for fisheries management. The goals of the workshop were to introduce diverse
                                                 members of the ocean sector to the latest ocean science and satellite data products that
                                                 could aid their decisions, and to discuss end-user needs. A series of invited short presen-
                                                 tations relevant to ocean health and fisheries were intended to highlight specific, relevant
                                                 datasets and other existing and emerging products and tools, and to start a dialogue
                                                 between data providers and data users on activities and needs across the ocean sector to
                                                 increase the practical exploitation (application) of satellite data products. She concluded
                                                 with three overarching questions for participants to consider throughout the workshop:
                                                     • Are you using satellite data right now? If so, how? If not, would you like to use it
                                                       and how?
                                                     • Where do you see big data or product gaps?
                                                     • What are some barriers to data access?

                    The goals of the             Jeremy Werdell [GSFC—PACE1 Project Scientist] presented a brief explanation of
                    workshop were to             satellite ocean color. Spaceborne radiometers measure the spectral distribution of light
                    introduce diverse            leaving the ocean surface from which the constituents influencing its color can be
                    members of the ocean         inferred, including information useful for fisheries management. Answering complex
                    sector to the latest ocean   and emerging questions about changes at the base of the ocean food web requires
                                                 knowledge about the types of phytoplankton that are present, and how they change
                    science and satellite data
                                                 with time. Werdell outlined the scientific justification to shift from current radiomet-
                    products that could aid      ric measurements (e.g., MODIS and VIIRS,2 which measure at a series of discrete
                    their decisions, and to      wavelengths) to spectroscopic ones [e.g., the Ocean Color Instrument (OCI) currently
                    discuss end-user needs.      being designed for PACE, which will measure a continuous series of wavelengths].
                                                 Werdell ended with some comments designed to help demystify the acquisition, use,
                                                 and analysis of satellite ocean color data products.

                                                 Woody Turner [NASA Headquarters (HQ)—Program Manager for Ecological
                                                 Forecasting] introduced NASA as an organization that uses space-based satellites for
                                                 basic and applied science activities, noting that increasingly novel uses of such data
                                                 are just beginning to be explored. Turner outlined NASA’s Applied Sciences Program
                                                 within the Earth Science Division. He detailed three active Ecological Forecasting
                                                 projects related to fisheries management, the detection and prediction of harmful algal
                                                 blooms, and forecasting the beaching of high accumulations of Sargassum, a genus
                                                 of brown macroalgae (seaweed). He introduced the Marine Biodiversity Observation
                                                 Network (MBON) of the Group on Earth Observations Biodiversity Observation
                                                 Network (GEO BON), which seeks to improve coordination of biodiversity data
                                                 in the U.S., the Western Hemisphere, and ultimately the world. He concluded by
                                                 mentioning the Applied Sciences Program’s Early Adopters activity to generate simu-
                                                 lated data for upcoming satellite missions before launch and the omnibus Research
                                                 Opportunities in Space and Earth Sciences (ROSES) solicitation, through which
                                                 NASA’s basic and applied Earth Science programs solicit proposals for funding of
                                                 projects across a wide range of disciplines.

                                                 Paul DiGiacomo [NOAA’s Center for Satellite Applications and Research—Chief of
                                                 Satellite Oceanography and Climatology Division] described many types of NOAA ocean
                                                 observations and their societal applications. He clarified that Earth observing satellites
                                                 cannot monitor fish populations directly from space, but do so indirectly by looking
                                                 1
                                                   PACE stands for Plankton, Aerosol, Cloud, ocean Ecosystem, a next-generation ocean color
                                                 satellite currently in mission design, with launch planned for 2022.
                                                 2
                                                   MODIS stands for Moderate Resolution Imaging Spectroradiometer, which flies on NASA’s
                                                 Terra and Aqua platform; VIIRS stands for Visible–Infrared Imaging Radiometer Suite, which
                                                 flies on the Suomi National Polar-orbiting Platform (NPP) and the recently launched Joint
                                                 Polar Satellite System-1 (JPSS-1).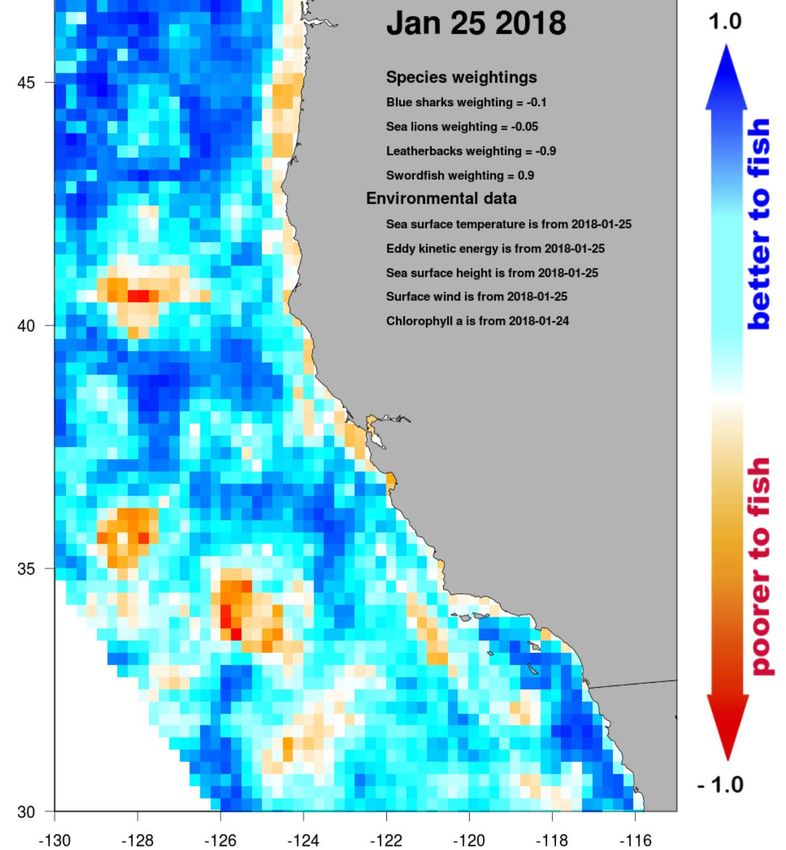
The Earth Observer                              January - February 2018                              Volume 30, Issue 1                    11
at the environmental conditions of ecosystems. NOAA is both a provider and user of

                                                                                                                                      meeting summaries
satellite data for environmental intelligence in support of its long-term goals. Legislation
mandates that NOAA prioritize ecological forecasting of harmful algal blooms, hypoxia,
pathogens, and habitat. Priorities are developed based upon stakeholder needs, NOAA
capacity, and national significance. As capacity develops and expands, decision support
forecasts improve and increase their effectiveness. For example, because so many endan-
gered species are migratory, the goal is to use a dynamic approach, predicting species loca-
tions in near-real time (e.g., using Whale Watch,3 Turtle Watch,4 EcoCast—see Figure 1)
to inform fishers to reduce bycatch (i.e., catching animals other than the target species),
and redirect ship traffic or naval exercises away from marine sanctuaries. DiGiacomo
mentioned other NOAA programs, informed by NOAA’s diverse observation network
(ships, aircraft, buoys, gliders, floats, satellites) and assets from other partners (NASA,
National Science Foundation, U.S. Environmental Protection Agency, individual states,
and academic institutions).

                                                                                                 Figure 1: EcoCast is a NASA-
                                                                                                 funded dynamic management
                                                                                                 project that synthesizes satellite
                                                                                                 data with in situ observations
                                                                                                 in near-real time to give fish-
                                                                                                 ers and managers the ecosys-
                                                                                                 tem assessment tools they need
                                                                                                 to maximize productive catch
                                                                                                 while minimizing nontarget
                                                                                                 (unwanted) bycatch. The scale
                                                                                                 reflects areas that are better to
                                                                                                 fish (blue scale) and worse to
                                                                                                 fish (red scale). The EcoCast
                                                                                                 predictive map integrates
                                                                                                 multiple dynamic species distri-
                                                                                                 bution models that account for
                                                                                                 distribution of catch (sword-
                                                                                                 fish) and bycatch (leatherback
                                                                                                 sea turtle, blue sharks, marine
                                                                                                 mammals). It builds upon the
                                                                                                 capabilities of WhaleWatch and
                                                                                                 TurtleWatch, mentioned in the
                                                                                                 text. Image credit: Hazen et
                                                                                                 al., NOAA Fisheries/Southwest
                                                                                                 Fisheries Science Center

Christa Peters–Lidard [GSFC—Deputy Director for Hydrosphere, Biosphere, and
Geophysics Laboratory] described NASA’s Earth observations and applications programs.
She showed several current examples of data relevant to the ocean including: maps
created by the Global Precipitation Measurement (GPM) mission and Integrated
Multi-satellitE Retrievals for GPM (IMERG); Landsat coastal water quality maps;
and ocean color products derived from a variety of previous and current sensors, and
modeled phytoplankton. She also touched upon several upcoming missions of inter-
est: Ice, Clouds, and Land-Elevation Satellite-2 (ICESat-2); Surface Water and Ocean
Topography (SWOT); and PACE. Peters–Lidard discussed NASA’s Capacity Building
Program, which seeks to engage current and future decision makers in a spectrum of
3
  WhaleWatch is a NASA-funded project coordinated by NOAA Fisheries’ West Coast Region
to help reduce human impacts on whales by providing near-real-time information on where
they occur and hence where whales may be most at risk from threats, such as ship strikes,
entanglements, and loud underwater sounds.
4
  TurtleWatch is a formerly NASA-funded tool that provides up-to-date information about the
thermal habitat of loggerhead sea turtles in the Pacific Ocean, north of the Hawaiian Islands.
12 The Earth Observer January - February 2018 Volume 30, Issue 1
activities both in the U.S. and in developing countries, to improve access to NASA
meeting summaries
Earth science and data that cover a range of societal applications.
By working with Janet Ranganathan [WRI—Vice President for Science and Research] described WRI as
Bloomberg to serve a global nonprofit research institute that advances evidence-based approaches for more
water risk data, sustainable management of the planet. WRI is an avid user of NASA and NOAA Earth
WRI is able to reach science data—but only uses a fraction of what could be used. She noted that “we are
320,000 investors, drowning in Earth science data” but it is not yet reaching all those who could use it to
make more sustainable decisions. Such utility comes from WRI’s Aqueduct open data
helping to inform
platform, which provides globally consistent, sub-basin level data on water risk (i.e.,
investments in water quantity, quality, demand, future projections). By working with Bloomberg to serve
intensive sectors, water risk data, WRI is able to reach 320,000 investors, helping to inform investments
such as power and in water intensive sectors, such as power and agriculture. Ranganathan concluded with a
agriculture. preview WRI’s Resource Watch (http://www.vizzuality.com/projects/resource-watch), a free,
interactive, open data platform for collaboration and action that will empower people
with the information they need to more sustainably manage the world’s resources.
Resource Watch is scheduled to launch on April 11, 2018.
Discussion Summary
The discussion focused both on getting satellite data easily into the hands of nontraditional users and also shar-
ing examples of how to use the data. Mitchell “Mitch” Roffer [Roffer’s Ocean Fishing Forecasting Service
(ROFFS), Inc.] had recently returned from Tanzania, where he said they have access to the data but lack the
experience and ability to use it. People need on-line resources on how to use the data, so that they don’t have to
travel. (The fourth panel discussion on page 17 elaborates on specific resources and tools to help anyone access
the data.) Amita Mehta [GSFC] commented that NASA’s Applied Remote Sensing Training (ARSET) offers
thematic online training for very local end users around the world. ARSET trains people from a variety of back-
grounds—from government employees to farmers and fishers, including dam operators in small African coun-
tries. ARSET shares NASA and NOAA data and teaches people how to apply satellite data to themes such as
water resources, air quality, ecological forecasting, and disaster management.
Carlos Del Castillo [GSFC—Chief of Ocean Ecology Laboratory] acknowledged that data producing organizations
have a lot of data and amazing tools—but they are not necessarily intuitive to nonspecialists. Thus, tools need
to be tested and evaluated before launch to prevent situations where tools are only understood by the people
who made them. Janet Ranganathan agreed, noting that currently the largest fraction of funding goes into
the production of data, and that additional funds need to be made available for the applications of the data.
Coordination with development agencies and foundations could create more coherence.
Woody Turner reminded people about SERVIR,5 a NASA capacity-building project in coordination with the
U.S. Agency for International Development (USAID), to provide satellite-based solutions to address particular
challenges. SERVIR applies Earth observations to support decision making in developing countries. Although
it hasn’t yet done much with fisheries applications, the project could be so encouraged. A discussion followed
concerning the emphasis on training and experience with these international programs at the government level
and the need to connect with true end-users (e.g., fishermen). The private sector and academia also need to
engage in the discussion. The consensus was that there is much more to be done in this area. In this vein, the
Canadian Space Agency started the Societal Applications in Fisheries and Aquaculture using Remotely Sensed
Imagery (SAFARI) to connect users, particularly in India. Data providing agencies agreed that they have a long
way to go to make a substantive impact at the user level.
5
SERVIR is not an acronym. It is a Spanish word that means “to serve.”
Panel 1: Ocean Health in the Context of Climate Change
Stephanie Uz [GSFC] moderated this panel, which focused on the big picture of how
satellite data and other products indicate the ways in which the ocean is changing and
how that impacts ocean biology. In addition to satellite data, assimilating data from
many sources refines understanding of the role of ocean life within the Earth system,
and improves our ability to predict and prepare for changes.The Earth Observer January - February 2018 Volume 30, Issue 1 13
Steven Pawson [GSFC, Global Modeling and Assimilation Office (GMAO)]
meeting summaries
explained how NASA observations are used to constrain the physical state of the
ocean in the Goddard Earth Observing System (GEOS) model for seasonal-to-decadal
analysis and prediction and a subseasonal-to-seasonal model for monthly forecasts. He
explained that GMAO is upgrading to a new model and compared their respective
outputs. Pawson also discussed a more recent effort to constrain the biological state of
the ocean using NASA’s Ocean Biology Model, described its components, and showed
some initial chlorophyll forecasting results in the Tropical Pacific.
In addition to satellite
Scott Doney [University of Virginia—Professor of Environmental Change] stated that data, assimilating data
climate change and other human impacts are directly affecting ocean life and health. from many sources
New data analysis tools are emerging—such as seascapes (http://www.marinebon.org/ refines understanding
seascapes.html), which provide a dynamic approach for identifying and monitoring of the role of ocean life
marine habitats. Borrowed from the world of “big data,” they provide a combination
within the Earth system,
of satellite and in situ observations to offer a powerful approach for monitoring ocean
ecosystem health, addressing ocean conservation challenges, and detecting ongoing
and improves our ability
changes that arise from natural variability and human impacts. to predict and prepare
for changes.
Mark Eakin [NOAA’s Coral Reef Watch] discussed coral bleaching, and gave an
overview of Coral Reef Watch’s satellite-based products, as introduced in Paul
DiGiacomo’s earlier presentation. Coral Reef Watch products use data from both
polar-orbiting and geosynchronous satellites. This tool gives managers the ability to
predict coral bleaching, such as that which occurred between 2014 and 2017—the
longest, most widespread, and likely, the most damaging thermal stress event ever.
He ended by mentioning the recent film Chasing Coral (http://www.chasingcoral.com),
which documents the state of coral reefs around the world and explored how they are
vanishing at an unprecedented rate.
Panel 1 Discussion Summary
The main themes of the discussion with all participants included the importance of refining predictive capabili-
ties through the assimilation of additional datasets. These include satellite data from the European Space Agency
(ESA) and Japan Aerospace Exploration Agency (JAXA), and getting data developers into the field to interact
with end-users to share resources and understand practical requirements. In an era of shrinking budgets, there is
a need for more of this to be done online.
Mark Eakin discussed the hands-on workshops for resource managers, conducted annually with each U.S.
Coral Reef jurisdiction in partnership with several international partners (e.g., SERVIR and the World Bank).
Earlier funding for these activities has now largely disappeared, and there is a consequent need to put training
and feedback tools online.
There was focused discussion on the impact that Hurricanes Irma and Maria had on coral reefs around the
Virgin Islands and Puerto Rico. According to Eakin, damage assessments are still ongoing, limited by logistical
limitations (e.g., fuel for boats). Reports from the Florida Keys indicate the extent of damage was not as bad as
feared there, but was worse in the southern Keys compared to the northern Keys. NASA is currently funding a
project to include more satellite data to predict coral reef disease in the Pacific.
There was a general discussion about resource constraints. Scott Doney noted that the American Association for
the Advancement of Science provides a robust analysis of administration and congressional budgets. The current
administration has proposed cuts for NASA Earth Science—including the PACE mission; similar cuts were
proposed for NOAA. Several websites have detailed analyses of budget proposals.
Charlie Iceland [WRI] asked about the extent to which ESA and JAXA support monitoring of ocean tempera-
ture, acidification, and other parameters and whether agencies share resources. Several speakers offered that inter-
national collaboration is common and ongoing, thereby optimizing use of limited funding and other resources.14 The Earth Observer January - February 2018 Volume 30, Issue 1
Panel 2: Fisheries and Ecosystem Health
meeting summaries
Cara Wilson [NOAA Fisheries] moderated the fisheries and ecosystem health panel,
which focused on the use of science and technology to improve local resilience and
support decisions for sustainable fisheries. The focus was on the need to develop action-
able information that takes advantage of the repeated, synoptic view afforded by satel-
lites to improve health and safety, while minimizing waste and environmental impacts.
Camrin Braun [Massachusetts Institute of Technology/Woods Hole Oceanographic
Institution] discussed the new paradigm for fisheries management. Traditionally,
managers used a static, catch-limited approach for a given oceanic area, which ignores
processes that operate on a variety of scales. Conversely, dynamic management incor-
porates changes in space and time in response to the shifting nature of the ocean
and its species, and considers biological, oceanographic, and socioeconomic factors.
He discussed oceanographic factors that impact fish habitats and how fish interact
with ocean eddies. Improvements include observations at increasingly smaller scales.
“As with every model Planned NASA missions like PACE and SWOT will make measurements at finer
I use such as weather spectral and spatial scales, respectively, to augment in situ data.
and wind and swell, I Mitchell “Mitch” Roffer explained how his company uses satellite data to produce
watch them to see how a value-added fish forecast product. He focused on ROFFS work with fisheries and
it applies to my local aquaculture, beginning with satellite data, and giving examples of how they tailor
conditions, and then specific products to meet their customers’ needs, with the goal of sustaining and
I determine my own increasing what Roffer referred to as catchability. Roffer noted that optimal satellite
degree of accuracy and products would be hourly, cloud-free, microwave sea surface temperature (SST) data,
apply them to making multispectral ocean color data at 250-m (~820-ft) spatial resolution, and global posi-
decisions about how I tioning system (GPS) data. He noted that his customers need data in real time, and
such data are not always available.
manage the farm. When
a domoic acid event Shelly Tomlinson [NOAA Ocean Services] addressed using satellites to forecast harm-
occurs, I comb [through] ful algae blooms (HABs), which are associated with several human health and animal
the models to see how it illnesses. While satellite imagery alone cannot distinguish a HAB from non-harmful
relates to my situation.” algae—and is not useful for all species—it can be a useful tool when combined with
other ecological data. Several algorithms have been developed to detect HABs using
—Bernard Friedman, data from ocean color sensors (VIIRS, MODIS, and OLCI6). While this is an interna-
tional problem, her specific examples focused on the U.S. She then proceeded to show
Santa Barbara
four places where satellites are being used for HAB forecasting and monitoring: in the
Mariculture Company, Gulf of Mexico, over Lake Erie, in California’s coastal waters, and in the U.S. Pacific
Santa Barbara, CA Northwest. Tomlinson also included a slide with personal testimonials from shellfish
growers (e.g., see quote from Bernard Friedman on this page), fishermen, and marine
mammal rescue centers (e.g., see quote from Richard Evans on page 19) about how
they use this information.
Bernard Friedman [Santa Barbara Mariculture Company] described his experience as
an aquaculture farmer who operates a 25-acre open-ocean shellfish farm one mile off
the coast of Santa Barbara, CA, with annual production of about 100,000 pounds of
mussels. Offshore shellfish farming has massive potential to provide healthy protein
at a much less environmental cost than any other form of farming on this planet.
His mussels provide a local source of seafood since their phytoplankton food source
continuously and naturally renews itself. He stated that the meat quality found inside
the shellfish is a direct indicator of ecosystem health: When the meat turns toxic, as it
did during the El Niño of 2015-16, he would like to know in advance of the onset of
harmful conditions—but often he does not.7
6
OLCI stands for Ocean and Land Colour Instrument and flies on ESA’s Copernicus
Sentinel-3 mission.
7
Learn more about Friedman’s personal connection to satellite data in “Using Scientific Muscle
to Grow Safer Mussels,” posted on The Earth Observatory—https://earthobservatory.nasa.gov/
IOTD/view.php?id=91595.The Earth Observer January - February 2018 Volume 30, Issue 1 15
meeting summaries
Panel 2 Discussion Summary
Monitoring ocean biology and ecosystem health from space is complicated by the intervening clouds and the
fact that everything moves and changes. Woody Turner pointed out that the trade-offs between spatial, tempo-
ral, and spectral resolution is the key to what can be resolved. A future geostationary ocean color sensor (e.g., the
proposed GEO CAPE8 mission), combined with current satellite capabilities and improved models, would radi-
cally enhance our ability to derive actionable information about submesoscale, transient biological features. The
2017 Decadal Survey is setting priorities for missions in the next decade.9
The group discussed differences between the needs of aquaculture and those of the wild fishing fleet.
Bernard Friedman said that policies lag offshore shellfish farming10 practices, referring to offshore shellfish as
the “canary in the coalmine,” since they respond to various stressors before harmful levels of demoic acid (a
neurotoxin found in algae) can be detected by other means, and enter into policy discussions. He would like
advanced information about the types of plankton at his farm and when they turn toxic. Shelly Tomlinson
pointed out that ecological modeling is a new domain, not as mature as dynamical models, and currently
being assessed and refined.
Mitch Roffer described how forecasting wild fish stocks has economic impacts for ROFFS customers, who
use them for strategic planning of their fishing fleet assets. In Tanzania, he recently used satellite data to help
identify new fishing areas so that they could stop overfishing historical fishing sites and develop a properly
managed, sustainable fishery. While spatiotemporal satellite data and models are useful for developing such
broad plans, neither are yet reliable at the operational scale (i.e., submesoscale, hourly).
Camrin Braun emphasized the challenges posed by satellite data latency and infrequency, as weather fronts
are in motion and a satellite image that is hours old can show a location hundreds of miles away from a
current location. Some end-users expressed annoyance that agencies take a long time to quality-control
data prior to sharing it, while many operational users do not require precise values, and actually prefer rela-
tive amounts (e.g., chlorophyll concentrations), but would prefer faster, near-real-time experimental prod-
ucts. Something that combines the speed, direction, and magnitude of a front would be useful, although
preferred habitats are species specific. Paul DiGiacomo mentioned the importance of blending geostation-
ary and polar products to fill gaps and create a truly operational product—not yet available for ocean color.
As noted earlier, GEO-CAPE is proposed, but will not occur within the next five years.
8
GEO CAPE stands for Geostationary Coastal and Air Pollution Events, and was one of the missions proposed in
the 2007 Earth Science Decadal Survey—https://www.nap.edu/catalog/11820/earth-science-and-applications-from-space-
national-imperatives-for-the.
9
The second Earth Science Decadal Survey was released January 5, 2018. It is called Thriving on Our Changing Planet: A
Decadal Strategy for Earth Observations (2018), and is now available online at https://www.nap.edu/catalog/24938/thriving-
on-our-changing-planet-a-decadal-strategy-for-earth.
10
In 2016 NOAA published the nation’s first regulatory program for offshore aquaculture in federal waters, intended to
expand opportunities for marine aquaculture and meet the growing demand for sustainable local seafood.
Panel 3: Links Between Fisheries and Human Security
Charlie Iceland [WRI] moderated this panel, which focused on organizations that
use ocean satellite data and products to inform decisions that assist society and
human security. Quickly getting actionable Earth-observation information into easily
usable tools is key to supporting tactical intervention.
Johanna Polsenberg [Conservation International] shared the Ocean Health Index
(OHI, http://www.oceanhealthindex.org). The OHI is a mechanism for marine ecosys-
tem-based management, defined in an easy-to-use global metric that can be used
to monitor progress over time. This index was created to capture the human-ocean
coupled system; distill it into easy-to-understand metrics; incorporate sustainability
into all indicators; monitor progress and track through time; and motivate actions to
improve ocean health. Thus far, limited satellite data have been applied, and used to
monitor various phenomena—e.g., sea ice, mangroves, SST, ultraviolet radiation, and
sea-level rise. Polsenberg discussed the 10 comprehensive goals of OHI and the core
process to score them, and challenged participants to think about global or regional
satellite data that could be applied.16 The Earth Observer January - February 2018 Volume 30, Issue 1
Beth Lowell [Oceana] introduced her organization, which is dedicated to interna-
meeting summaries
tional ocean conservation, and using satellite data to protect the ocean, with a focus
on responsible fisheries management. Oceana's motto is: “Save the oceans, feed the
world.” She then described how illegal, unreported, and unregulated (IUU) fishing
Oceana has a team of
and seafood fraud are issues that undermine responsible fisheries management, and
analysts that use the
that sea-based traceability—while difficult—helps track seafood through the complex
maps in combination seafood supply chain. She also gave a preview of Global Fishing Watch (GFW),11 an
with other data to online, free platform that incorporates real-time commercial fishing activity data into
produce reports and useful maps, developed in coordination with scientists, data providers, and resource
to support campaigns managers. Oceana has a team of analysts that use the maps in combination with other
to improve fisheries data to produce reports and to support campaigns to improve fisheries management
management around around the world—see Figure 2. Recent projects include identifying hotspots of
the world. transshipping activity and discovering unlawful fishing activity typically just outside
countries’ exclusive economic zones, in order to stop it. Lowell explained that govern-
ments are recognizing the importance of publically sharing fisheries data to fight
illegal fishing, e.g. Indonesia now publishes its data in GFW. Oceana and GFW are
working with more governments to secure additional vessel tracking data.
11
See Paul Woods' keynote address on page 19 to learn more about Global Fishing Watch.
Camrin Braun (middle) tags
a shark to track its move-
ment in the North Atlantic.
In his presentation [see page
14], Braun mentioned that
one of the challenges of fish-
eries management is that a
single shark can cover lots of
ground in relatively short time,
as evidenced in Figure 2—by
Oceana in which shark tracks
are superimposed on a Global
Fishing Watch map. Photo
credit: Tane Sinclair-Taylor/
MIT-WHOI
Figure 2: Example of a blue
shark case study and a Global
Fishing Watch workspace
showing the interactions
between three tagged shark
tracks (red, blue, and pink
dotted lines) and commercial
fishing activity (white dots) in
the Northwest Atlantic during
June - September 2016. Image
credit: Beth Lowell/OceanaThe Earth Observer January - February 2018 Volume 30, Issue 1 17
Christoph Aubrecht [European Space Agency/World Bank] noted that the wealth of
meeting summaries
the global ocean is conservatively estimated at $1.5 trillion U.S. dollars annually, and
that almost 15% of the world’s population depends on fisheries or aquaculture for live-
lihood. Unfortunately, in recent years, the health of the ocean has declined, leading to
food insecurity and instability. In response, the World Bank promotes a blue economy—
a sustainable ocean economy where economic activity is in balance with ocean health.
Aubrecht described the Earth Observations for Sustainable Development (EO4SD) initia-
tive with the development banks, that includes using EO in support of fisheries and
aquaculture management. The main challenges include fast delivery of actionable satel-
lite information and the reliability of the analytics. Persistence is an issue for tactical
support and is being addressed through new, small satellites. The main concern is how to
put these tools into the appropriate hands with a long-term sustainable framework.
Panel 3 Discussion Summary
The main themes of the discussion were about building capacity around the United Nations Sustainable
Development Goals (UN SDGs), especially Goal 14: Conserve and sustainably use the oceans, seas, and marine
resources. In particular, Joanna Polsenberg and others noted that it can be challenging for developing govern-
ments to handle big data, making it challenging for them to integrate products into their decision-support
process and strengthen their ability to enforce regulations.
GFW is a success story in that regard: Use of the tool by developing countries has doubled, enabling them
to better protect their territorial waters since most productive fishing areas are within the exclusive economic
zone of countries. Beth Lowell said Oceana sees fisheries starting to recover once countries enforce scientifi-
cally-based catch limits, protect habitats where fish spawn, and reduce bycatch. The World Bank has also had
success reaching local communities and has strong capacity-building programs via developmental banks to
address local problems.
A discussion about how African nations make use of satellite data pointed to several areas of significant concern
that workshop participants from Africa bought to the group’s attention. Christoph Aubrecht asked with whom
data providers should engage to increase capacity-supporting resource management and noted that the World
Bank had a project in the western Indian Ocean dealing with oil spills related to piracy that successfully used
synthetic aperture radar (SAR) imagery to identify and catch oil slick offenders and stop them.
Paul DiGiacomo described ongoing discussions with the Committee for Earth Observation Satellites (CEOS)
and the challenge presented by SDG targets being socioeconomic, while data collected by Earth Observation
providers are more statistically based. Workshops engaging stakeholders hope to explore practical scenarios to
bridge this gap (e.g., GEO Blue Planet workshop in January).12
12
The workshop is called Implementing and Monitoring the Sustainable Development Goals in the Caribbean: The Role of
the Ocean, January 17-19, 2018, in St. Vincent and the Grenadines in the Caribbean. To learn more, see http://www.gstss.
org/2018_Ocean_SDGs.
Panel 4: Resources and Tools for Using Ocean Satellite Data Products
Paul DiGiacomo moderated this panel on the satellite data products available for
different levels of user engagement, from detailed scientific analysis to quick looks at
global imagery. Before introducing the presentations on what users need and how to
The challenge is
get appropriate tools and data to them, DiGiacomo specifically mentioned two rele- in getting these
vant international efforts from the Group on Earth Observations (GEO): the Blue data into the
Planet network initiative, and AquaWatch, a water-quality information resource. hands of interested
nonscientists and
Carlos Del Castillo began by showing data from the Sea-viewing Wide Field-of-View training them to
Sensor (SeaWiFS) that shows the planet “breathing.” He then gave some historical perspec-
use them—a chasm
tive, reminding participants of the humble beginnings of ocean color satellite data acqui-
between research
sition, and the contrast today, where there are many sensors, many satellites, and many
different users from a variety of backgrounds. The challenge is in getting these data into and applications.
the hands of interested nonscientists and training them to use them—a chasm between
research and applications. NASA’s ARSET has archived several excellent ocean color webi-
nars useful for this purpose: see https://arset.gsfc.nasa.gov/sdgs#SDG14 to learn more.18 The Earth Observer January - February 2018 Volume 30, Issue 1
Jim Acker [GSFC, Earth Sciences Data and Information Services Center] endorsed Jeremy
meeting summaries
Werdell’s introduction to ocean color and recommended his own book on the subject for
those with a deeper interest in the history of ocean color.13 He then gave overviews of three
different analysis tools: Worldview (https://worldview.earthdata.nasa.gov), NASA Earth
Observations, or NEO (https://neo.sci.gsfc.nasa.gov), and Giovanni (https://giovanni.gsfc.nasa.
gov/giovanni). He contrasted each tool by using them to examine the seasonal Amazon River
outflow plume. Worldview is primarily designed to provide near-real-time daily (or finer
temporal resolution) data in layers that are easy to combine for data analysis. NEO gives
50 satellite datasets and is a useful tool for comparing up to three images or times. Acker
CoastWatch offers tools demonstrated NEO’s Data Probe and Transect capabilities. Giovanni contains both satellite
and tutorials for search- and model output data, with several different visualization and analysis capabilities. One
ing, downloading, noteworthy capability of Giovanni is creating time series; another is creating a difference map
analyzing, and imaging between two output files (with Panoply). All of these NASA tools are available for viewing
and analyzing remotely sensed data on-the-fly without having to download software.
satellite data that enable
easy access and use, Veronica Lance [NOAA—CoastWatch/OceanWatch Program Scientist] showed how NOAA
including by nonexperts. CoastWatch/OceanWatch (coastwatch.noaa.gov),14 provides fit-for-purpose global and
regional, near-real-time, and science-quality time-series satellite data products. They are
derived from NOAA and non-NOAA satellites for multiple environmental parameters.
Global and regional satellite data products are converted into actionable information through
assimilation with other data and models, and used to understand, manage, and protect ocean
and coastal resources. CoastWatch offers tools and tutorials for searching, downloading,
analyzing, and imaging satellite data that enable easy access and use, including by nonexperts.
13
Learn more about what led Acker to write The Color of the Atmosphere With the Ocean Below:
A History of NASA’s Ocean Color Missions at https://earthobservatory.nasa.gov/blogs/earthmat-
ters/2015/09/28/some-insight-on-the-color-of-the-ocean.
14
NOAA CoastWatch/OceanWatch central office is in College Park, MD, with several nodes
distributed geographically and among NOAA line offices such as Fisheries Service, Ocean
Service, and Oceanic and Atmospheric Research.
Panel 4 Discussion Summary
We are data rich, but often information poor.
One focus of the discussion on resources and tools for using ocean satellite data products was on building value-
added products and making sure they’re useful to end-users. Returning to a topic raised in the Panel 2 discussion,
having fast access to lower resolution than research-grade data products would have significant utility for appro-
priate groups, and intermediary arrangements through organizations such as WRI can help to bridge this divide.
Applied Sciences projects that are funded through NASA require an evaluation of the usefulness of the product
and includes a benefit analysis to business and other operations.
Related to this is the paradox of building trust in information content quality while also conveying data uncer-
tainties. Again, users frequently need a less-complicated answer than the highly scrubbed data provide.
As noted by an earlier group, a key discussion addressed building capacity by sharing assets and training people
to find and use available resources, including online tutorials—especially important for developing countries. As
reported earlier, the divide between sophisticated and unsophisticated users is a wide one as regards data access,
availability, and manipulation. On the topic of scattered resources, Jim Acker said there are some websites that
consolidate them; however, the agencies need to be mindful of customer demand for “one-stop-shopping.” In
support of raising awareness about satellite assets and training opportunities, Veronica Lance suggested that
getting stories out to the public about how data are used is an effective way to spark ideas.
There was a question about whether NOAA provides a routine dataset on ocean acidity. A group at NOAA
develops such a product that goes into Coral Reef Watch; however, this is not yet monitored by satellites nor
routinely served, although Veronica Lance said they are working on algorithms to do this.
When asked about how to appropriately cite data, Jim Acker responded that there are instructions for this on each
dataset’s landing page. Carlos Del Castillo pointed out that users need to be aware that agencies serve out each other’s
data which can lead to credit confusion, e.g., NASA data might incorrectly be credited to NOAA. Veronica Lance
mentioned that metadata helps with this by including the history of a dataset.The Earth Observer January - February 2018 Volume 30, Issue 1 19
All-Panel Discussion Summary
meeting summaries
At the conclusion of the fourth panel, the panelists from all four panels gathered
to synthesize concepts raised throughout the day. The main point of discussion was
the extent to which end-user needs are guiding product and mission development.
Commercial businesses use needs analyses to assess and guide product development.
Mitch Roffer asked whether anyone has done this, to which Mark Eakin and Shelly
Tomlinson replied that NOAA has done this for Coral Reef Watch and HAB fore-
casting, and Steven Pawson replied that NASA GMAO also does to some extent. “As the medical director
Mark Eakin qualified that people need to see example products first to give them a of a southern California
concept of what’s possible, before they can give feedback on how well the product can marine mammal
serve their needs.
rehabilitation center, I
Carlos Del Castillo mentioned the best mechanism for users to get exactly what they am always in need of
need is by establishing a true partnership with an academic research organization during current data concerning
a NASA Applied Sciences Program funding call, especially where funding is the limit- domoic acid blooms in
ing factor. NASA’s Early Adopters Program is another way to gauge user needs early southern California
in mission design and development process, in which users test synthetic data prior to waters. We have been
launch—not just for PACE, but for all future missions. Engineering trade-offs made using these pictorial
in concert with end-user needs can lead to more-efficient use of available resources, as
data to keep abreast
was done by ESA in conducting a needs assessment prior to the Copernicus mission.
Christoph Aubrecht added that international collaboration can also help with funding of the seasonal trends
constraints. For example, NASA and ESA work together on joint campaigns as well as in domoic blooms
on the upcoming ESA Biomass Mission, planned to launch in 2021. that impact marine
mammals in southern
On the subject of whether user needs are identified through top-down mechanisms California waters. For
(i.e. data in search of users), Christoph Aubrecht shared that ESA strategically the first time in 20 years
engages leadership teams at development banks that are developing goals and ESA
we are able to verify
advises on how Earth observations can help address these long-term goals. Carlos Del
Castillo contrasted this with the practice at NASA, where Applied Science propos-
domoic acid blooms in
als have traditionally been led by scientists rather than end-users. Woody Turner a timely fashion, that
responded that this is changing and that end-users are now writing proposals. could result in moderate
to severe pathologies
As to how users could learn about and access the plethora of available resources, and deaths in marine
Steven Pawson noted that products are probably underutilized due to lack of aware- mammals in Orange
ness. Beth Lowell reiterated that there are a lot of freely available, great data resources
County waters. This
online, but that it’s not always obvious where to find what one needs.
is a classic example
Keynote Presentation of ‘forewarned is
forearmed.’….”
Paul Woods [GFW—Chief Technology Officer] discussed traffic in the South China
Sea and pointed out that many vessels actively try to avoid detection. He noted that
—Richard Evans,
the global economy loses $83 billion annually to illegal fishing, overfishing, and poor
fisheries management. In response to this daunting problem, Oceana, Skytruth, and The Pacific Marine
Google conceived and created GFW and publically launched it in 2014. Woods Mammal Center,
described how GFW has used the Automatic Identification System (AIS) to identify Laguna Beach, CA
~60,000 vessels since 2012. This tool was developed to jumpstart a discussion about
how to track vessels—successfully. Woods went on to describe how satellite data are
applied to GFW to identify vessel type. This is important because vessels lie about
their AIS identification. GFW uses machine learning to recognize patterns, allowing
them to distinguish fishing vessels from non-fishing vessels, and then distinguish the
types of fishing vessels, e.g., trawl, longline, or purse seine. The system was launched
at the Our Ocean Conference in 2016, and already has users from 189 countries,
with 32,500 registered users and 5,000 core users. Woods summarized many of the
applications of GFW and its research program, and showed an example of combining
Sentinel-1 satellite radar data with AIS data in Google Earth Engine to improve the
ability to identify nonbroadcasting vessels—the so-called "dark fleet."20 The Earth Observer January - February 2018 Volume 30, Issue 1
meeting summaries
Keynote Presentation Discussion Summary
Participants discussed the challenges of enforcing IUU regulations and whether
additional assets might be integrated. Paul Woods suggested that suborbital
assets (i.e., unpiloted aerial vehicles) could help. High-resolution images by
private companies (e.g., Digital Globe) were also discussed, but there are many
challenges to using these data with any frequency, and it is not fast to get an
image this way. New SAR constellations will increase temporal frequency. The
consensus was that the problem requires a multilayered approach: GFW can
help with the big picture of the IUU problem but needs people on the water
With more capabilities too. Additionally, sometimes the problem is not with getting the informa-
coming online, this is tion, but moving it to the right organizations, such as law enforcement. High
an exciting time for costs associated with targeted scenes is another area of concern. End-users
remote sensing. The with demonstrable needs must keep asking cognizant agencies and companies
for these sorts of data. Mitch Roffer asked whether NOAA uses GFW data to
flipside is that with
study fishing effort over time, but Paul Woods responded that GFW gets more
increasing amounts of engagement outside of the U.S. on that issue.
data available, there
is an ever-increasing With more capabilities coming online, this is an exciting time for remote
need to distill key sensing. The flipside is that with increasing amounts of data available, there is
information from an ever-increasing need to distill key information from those data and get that
those data and get information to end-users.
that information to
end-users. Conclusion
Stephanie Uz and Janet Ranganathan wrapped up the meeting with a few clos-
ing remarks and an opportunity for some final input from the participants. Both of
them emphasized the need to continue the dialogue between satellite data provid-
ers and users in order to tailor products to user needs, along with intermediaries who
build customizable tools for a broad target audience, offer training opportunities, and
promote success stories about people already applying the data. NASA and NOAA
will also coordinate efforts with other groups undertaking similar efforts, such as GEO
Blue Planet.
Paul DiGiacomo noted that success stories are a useful way to connect new users,
and offered the opportunity for Blue Planet to work with NASA, NOAA, and WRI
in sharing stories and case studies (e.g., the Aquawatch report on water-quality-moni-
toring case studies). He reiterated the importance of capacity building through train-
ing and end-user engagement. Janet Ranganathan reminded everyone about putting
information in an accessible format where the users are, as WRI plans to do with
Resource Watch (launching April 2018), combined with stories that include partners
sharing data-use examples.
Future discussions and trainings will address needs identified during the workshop. You can also read