INTEGRATED WATER VAPOUR OBSERVATIONS IN THE CARIBBEAN ARC FROM A NETWORK OF GROUND-BASED GNSS RECEIVERS - MPG.PURE
←
→
Page content transcription
If your browser does not render page correctly, please read the page content below

Earth Syst. Sci. Data, 13, 2407–2436, 2021
https://doi.org/10.5194/essd-13-2407-2021
© Author(s) 2021. This work is distributed under
the Creative Commons Attribution 4.0 License.

         Integrated water vapour observations in the Caribbean
          arc from a network of ground-based GNSS receivers
                            during EUREC4 A
      Olivier Bock1,2 , Pierre Bosser3 , Cyrille Flamant4 , Erik Doerflinger5 , Friedhelm Jansen6 , Romain Fages7 ,
                                          Sandrine Bony8 , and Sabrina Schnitt9
               1 Université  de Paris, Institut de physique du globe de Paris, CNRS, IGN, 75005 Paris, France
                                    2 ENSG-Géomatique, IGN, 77455 Marne-la-Vallée, France
                  3 Lab-STICC UMR 6285 CNRS/PRASYS, ENSTA Bretagne/HOP, 29200 Brest, France
                                 4 LATMOS/IPSL, UMR 8190 CNRS-SU-UVSQ, Paris, France
                5 Géosiences Montpellier UMR 5243, Université Montpellier – CNRS, Montpellier, France
                                   6 Max-Planck-Institut für Meteorologie, Hamburg, Germany
                                                    7 IGN, Saint-Mandé, France
                              8 LMD/IPSL, UMR 8539 CNRS, Sorbonne Université, Paris, France
                   9 Institute for Geophysics and Meteorology, University of Cologne, Cologne, Germany

                                        Correspondence: Olivier Bock (bock@ipgp.fr)

                                  Received: 15 February 2021 – Discussion started: 24 February 2021
                              Revised: 22 April 2021 – Accepted: 23 April 2021 – Published: 28 May 2021

      Abstract. Ground-based Global Navigation Satellite System (GNSS) measurements from nearly 50 stations
      distributed over the Caribbean arc have been analysed for the period 1 January–29 February 2020 in the frame-
      work of the EUREC4 A (Elucidate the Couplings Between Clouds, Convection and Circulation) field campaign.
      The aim of this effort is to deliver high-quality integrated water vapour (IWV) estimates to investigate the mois-
      ture environment of mesoscale cloud patterns in the trade winds and their feedback on the large-scale circulation
      and energy budget.
         This paper describes the GNSS data processing procedures and assesses the quality of the GNSS IWV re-
      trievals from four operational streams and one reprocessed research stream which is the main data set used for
      offline scientific applications. The uncertainties associated with each of the data sets, including the zenith tro-
      pospheric delay (ZTD)-to-IWV conversion methods and auxiliary data, are quantified and discussed. The IWV
      estimates from the reprocessed data set are compared to the Vaisala RS41 radiosonde measurements operated
      from the Barbados Cloud Observatory (BCO) and to the measurements from the operational radiosonde sta-
      tion at Grantley Adams International Airport (GAIA), Bridgetown, Barbados. A significant dry bias is found
      in the GAIA humidity observations with respect to the BCO sondes (−2.9 kg m−2 ) and the GNSS results
      (−1.2 kg m−2 ). A systematic bias between the BCO sondes and GNSS is also observed (1.7 kg m−2 ), where
      the Vaisala RS41 measurements are moister than the GNSS retrievals. The IWV estimates from a collocated
      microwave radiometer agree with the BCO soundings after an instrumental update on 27 January, while they
      exhibit a dry bias compared to the soundings and to GNSS before that date. IWV estimates from the ECMWF
      fifth-generation reanalysis (ERA5) are overall close to the GAIA observations, probably due to the assimilation
      of these observations in the reanalysis. However, during several events where strong peaks in IWV occurred,
      ERA5 is shown to significantly underestimate the GNSS-derived IWV peaks. Two successive peaks are observed
      on 22 January and 23–24 January which were associated with heavy rain and deep moist layers extending from
      the surface up to altitudes of 3.5 and 5 km, respectively. ERA5 significantly underestimates the moisture content
      in the upper part of these layers. The origins of the various moisture biases are currently being investigated.

Published by Copernicus Publications.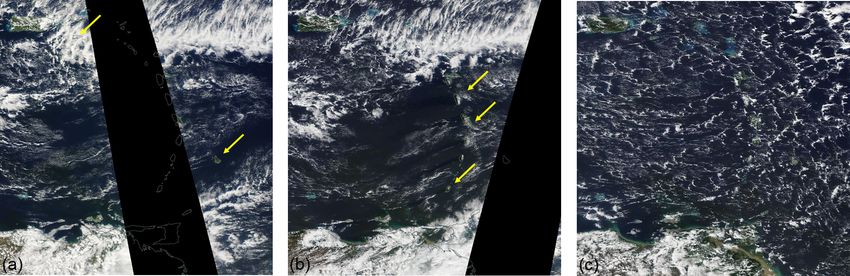
2408                                                              O. Bock et al.: EUREC4 A ground-based GNSS IWV data

          We classified the cloud organization for five representative GNSS stations across the Caribbean arc using
       visible satellite images. A statistically significant link was found between the cloud patterns and the local IWV
       observations from the GNSS sites as well as the larger-scale IWV patterns from the ECMWF ERA5 reanalysis.
          The reprocessed ZTD and IWV data sets from 49 GNSS stations used in this study are available from the
       French data and service centre for atmosphere (AERIS) (https://doi.org/10.25326/79; Bock, 2020b).

1   Introduction                                                  tions as well as station positions and velocities for mon-
                                                                  itoring, understanding, and prediction of various geohaz-
The overarching goal of EUREC4 A (Elucidate the Couplings         ards (earthquakes, hurricanes, flooding, volcanoes, and land-
Between Clouds, Convection and Circulation) is to improve         slides). Some other stations belong to the French perma-
our understanding of how trade-wind cumuli interact with the      nent GNSS network, the so-called “Reseau GNSS Perma-
large-scale environment (Bony et al., 2017). Water vapour is      nent” (RGP) operated by IGN in the Caribbean and French
one key ingredient of the atmospheric environment control-        Guyana territories. Figure 1 shows the map of the stations.
ling the life cycle of convection with strong feedback on the     Because of their location on the nearby Caribbean islands,
large-scale circulation and energy budget (Sherwood et al.,       most of the GNSS measurements mainly provide information
2010). The mechanisms involved are thought to play a sig-         on the large-scale atmospheric environment downstream the
nificant role in the climate sensitivity and model diversity      Tradewind Alley and the Boulevard des Tourbillons. Closer
(Sherwood et al., 2014).                                          to the main theatre of action of the field campaign, two col-
   The EUREC4 A field campaign was elaborated to provide          located ground-based GNSS stations, referred to as BCON
relevant observations on the cloud properties and their at-       and BCOS, have been set up at the BCO in the framework
mospheric and oceanic environment across a range of scales        of EUREC4 A. Two stations were installed to insure redun-
(Stevens et al., 2021). The measurement platforms were de-        dancy during the campaign. They complement the permanent
ployed over two theatres of action. The first, referred to as     instrumentation operated at the BCO (Stevens et al., 2016).
the “Tradewind Alley”, extends from an open-ocean moor-           The BCO GNSS stations were installed on 31 October 2019
ing at 50.95◦ W, 14.74◦ N to the Barbados Cloud Obser-            and are planned to operate for a full annual cycle at least.
vatory (BCO) (59.43◦ W, 13.16◦ N) (Stevens et al., 2016).         The measurements from these two stations are transmitted in
The second, named the “Boulevard des Tourbillons”, ex-            near-real time thanks to the BCO infrastructure and are pro-
tends from 7◦ N, off the northern Brazil coast, roughly to        cessed operationally by IGN in the RGP processing stream,
the BCO. Most of the distant open-seawater vapour mea-            on one hand, and by ENSTA_B/IPGP (ENSTA Bretagne and
surements were made by research vessels (R/Vs) embarking          IPGP), on the other hand. Both processing centres run con-
radiosonde systems, lidars, and microwave radiometers for         tinuously and provide IWV data with slightly different la-
what concerns water vapour measurements. They were com-           tency and precision. A more accurate research-mode process-
pleted by aircraft platforms leaving from the Grantley Adams      ing was also set up by ENSTA_B/IPGP to reprocess the data
International Airport (GAIA), Brigdetown, Barbados, em-           from all 49 stations in a homogeneous way but for a limited
barking dropsondes, in situ, and remote sensing measure-          period, from 1 January to 29 February 2020, hence including
ment systems. The aircraft operated mainly in a 200 km di-        the COCONet and RGP stations. A first release of this data
ameter circle centred on 57.72◦ W, 13.32◦ E in the Tradewind      set is now available on the EUREC4 A database hosted by
Alley, upstream from the BCO. In addition to the research         the French data and service centre for atmosphere (AERIS)
instrumentation deployed on these platforms, ground-based         (Bock, 2020b).
and ship-borne Global Navigation Satellite System (GNSS)             This paper aims at describing the ground-based GNSS data
receivers were operated to provide high-temporal-resolution       processing details and assessing the quality of the IWV re-
integrated water vapour (IWV) measurements. Results of            trievals from both the operational and research processing
ship-borne GNSS measurements from the R/Vs Meteor,                streams. Section 2 describes the GNSS data processing and
Maria S. Merian, and L’Atalante are described in a compan-        IWV conversion details. Section 3 compares the zenith tropo-
ion paper (Bosser et al., 2021). This paper focuses on the        spheric delay (ZTD) estimates and the IWV retrievals from
ground-based GNSS network measurements.                           the various data processing streams for the two BCO sta-
   The ground-based GNSS network comprises a total of 49          tions. The intercomparison is completed with IWV measure-
stations of which 47 are permanent instruments devoted pri-       ments from the Vaisala RS41 radiosondes and the humidity
marily to geoscience investigations. Most of these stations       and temperature profiler (HATPRO) microwave radiometer
belong to the Continuously Operating Caribbean GPS Obser-         operated during the EUREC4 A campaign, as well the opera-
vational Network (COCONet) (https://coconet.unavco.org/,          tional radiosonde measurements operated by the Barbados
last access: 29 January 2021) and provide raw observa-            weather service at GAIA. Section 4 provides a validation

Earth Syst. Sci. Data, 13, 2407–2436, 2021                                       https://doi.org/10.5194/essd-13-2407-2021
O. Bock et al.: EUREC4 A ground-based GNSS IWV data                                                                          2409

Figure 1. Map of GNSS stations for which the measurements were reprocessed from 1 January to 29 February 2020. The data sources are
indicated below the figure.

of the ECMWF fifth-generation reanalysis (ERA5) (Hers-              consist in network processing solutions where the BCO sta-
bach et al., 2020) at regional scale with respect to the IWV        tions are processed in baselines formed with about 40 perma-
retrievals from the extended GNSS network and a prelim-             nent stations operated in the Caribbean and French Guyana
inary analysis of the large-scale IWV variations related to         region and beyond. The processing results, hereafter called
mesoscale cloud organization in the trade winds. Section 5          “solutions”, are produced on hourly and daily basis, respec-
concludes the study.                                                tively. The NRT solution uses ultra-rapid satellite clocks and
                                                                    orbits, and processes the measurements in 6-hourly windows
                                                                    shifted by 1 h every hour. For the permanent GNSS stations
2     GNSS data processing and IWV retrieval                        in the region, the ZTD estimates for the most recent hour
                                                                    are available within 45 min after the end of measurements
A vast literature covers the basic concepts of GNSS data pro-       and are distributed to numerical weather prediction (NWP)
cessing for meteorological applications (see Guerova et al.,        centres via the EUMETNET-GNSS water vapour programme
2016). It will not be repeated here.                                (E-GVAP). Although the BCO stations were included in this
                                                                    stream, they are not registered as permanent stations at E-
2.1    GNSS data processing streams                                 GVAP and are thus not assimilated by the NWP centres. Due
                                                                    to the sliding window processing approach, each hourly time
The GNSS measurements from the two BCO stations, here-              slot is thus processed six times. The accuracy of the corre-
after called BCON and BCOS, are processed in four dif-              sponding ZTD estimates depends on the time slot, as will be
ferent operational streams. Two of the streams are run by           illustrated in the next section. The main reason is that the
IGN as part of the RGP operations that will be referred to          quality of the NRT clocks and orbits is lower in the more re-
as “RGP NRT” (near-real time) and the “RGP daily”. Both

https://doi.org/10.5194/essd-13-2407-2021                                          Earth Syst. Sci. Data, 13, 2407–2436, 2021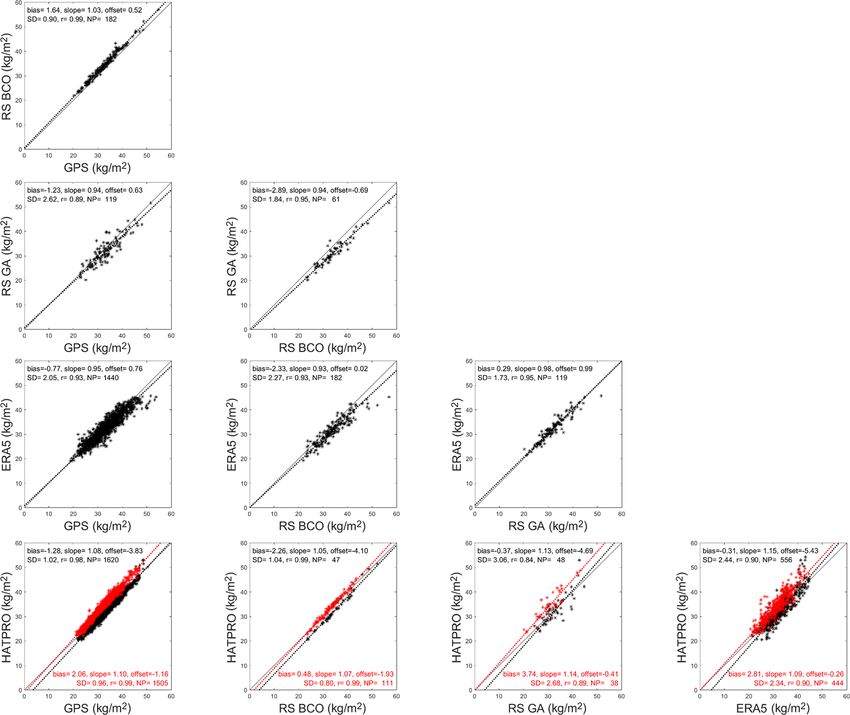
2410                                                              O. Bock et al.: EUREC4 A ground-based GNSS IWV data

cent time slot because they are predicted (observations are       thus applied in the form of a range check on ZTD estimates
not available in due time to constrain that part of the orbit     with limits [1, 3 m] and on for ZTD formal errors with a limit
calculation). The sampling of the ZTD estimates of the NRT        of 0.02 m.
solution is 15 min. On the other hand, the “daily” processing        For the GIPSY repro1 solution, a more elaborate quality
stream is updated every day before 05:00 UTC. It is based on      check was made using both types of information for all sta-
a longer time window of 24 h and benefits from slightly im-       tions. Mean statistics over the 2-month period are reported
proved clock and orbit products. Its accuracy is thus slightly    in Table S1 of the Supplement. The mean rms of residuals
higher. The sampling of the ZTD estimates of the daily so-        for all 49 stations ranged between 0.009 and 0.015 m. Five
lution is 1 h. This processing stream is not sent to E-GVAP       stations with values above 0.013 m may be unreliable (N240,
but is rather devoted to an operational quality control of the    DEHA, AIRS, BOUL, HABL). These stations also have a
observations from the RGP stations. It is also used for a pos-    small mean percentage of fixed ambiguities (≤ 50 %) and/or
teriori verification of the NRT solution.                         significant temporal variations in both parameters. Station
    The data from the BCO stations were also included in two      position repeatability was in general good both in the hori-
other operational streams operated by ENSTA_B/IPGP in the         zontal (≤ 0.005 m) and vertical (≤ 0.015 m) except for two
framework of ACTRIS-France (Aerosol, Cloud and Trace              stations (BOUL, OLVN). In a second step, a tighter range
Gases Research Infrastructure – France, https://www.actris.       check completed with an outlier check were applied follow-
fr/, last access: 29 January 2021). These two streams are re-     ing the recommendations of Bock (2020a). The range check
ferred to as “GIPSY rapid” and “GIPSY final”. They differ         limits were [0.5, 3.0 m] on ZTD values and 0.01 m on for-
only by the clock and orbit products which are released with      mal errors. The outlier check limits were computed for each
daily and fortnightly latency, respectively. The GIPSY rapid      station based on its median µ and standard deviation σ statis-
processing is equivalent to the RGP daily processing, while       tics over the 2-month period according to [µ − 5σ, µ + 5σ ]
the GIPSY final processing provides a higher level of accu-       for the ZTD values and [0, µ + 3.5σ ] for the formal errors.
racy. Both streams provide ZTD estimates with a sampling          This screening procedure rejected 0.21 % of the ZTD data
of 5 min.                                                         due exclusively to the formal error outlier check. The GIPSY
    Apart from the usage of different clock and orbit prod-       ZTD time series are generally quite small with few outliers
ucts, the processing streams run by both analysis centres also    as confirmed by the low outlier detection rate.
differ by their software packages and related processing op-
tions as summarized in Table 1. Most importantly, IGN uses
the Bernese GNSS version 5.2 software in double-difference        2.3   GNSS ZTD-to-IWV conversion
processing mode (Dach et al., 2015), while ENSTA_B/IPGP
use the GIPSY OASIS II version 6.2 software in precise point      The ZTD is the sum of the zenith hydrostatic delay (ZHD)
positioning (PPP) mode (Zumberge et al., 1997). Various           and the zenith wet delay (ZWD):
studies have compared the results and discussed the benefits
and drawbacks of both approaches. When consistent clock           ZTD = ZHD + ZWD.                                           (1)
and orbit products are used, there is generally a good level of
agreement (i.e. a few millimetres of root mean square differ-
                                                                  During the data processing, ZHD is fixed to an a priori value,
ences (RMSDs) in ZTD estimates).
                                                                  either from an empirical model or from a NWP model anal-
    Finally, the regional network including 49 GNSS stations
                                                                  ysis (Boehm et al., 2007), and ZWD is estimated. Errors in
was reprocessed by ENSTA_B/IPGP using again GIPSY
                                                                  the a priori ZHD can propagate to the estimated ZWD, but
OASIS II version 6.2 software, in a very similar scheme to
                                                                  in general, this error is small (< 1 mm) and the sum of both
that of the final stream but with a few improved processing
                                                                  is very close to the real ZTD. When IWV is to be extracted,
options. This processing is expected to be the most accurate.
                                                                  it is desirable to use a more accurate ZHD value computed
It is referred to as “GIPSY repro1” in the following.
                                                                  from the surface air pressure:

2.2    GNSS data quality checking                                                    Ps
                                                                  ZHD = 10−6 k1 Rd      ,                                    (2)
The quality of the data processing results can be checked                            gm
with two types of information: (1) global information quan-
tifying the accuracy of the processing in the 6-hourly or 24-     where k1 is the dry air refractivity coefficient, Rd the dry
hourly time window (e.g. reduced sum of squares of resid-         air specific gas constant, Ps surface air pressure, and gm the
uals, percentage of solved ambiguities) and (2) the formal        mean acceleration due to gravity (Davis et al., 1985). IWV is
errors of the estimated parameters (station coordinates and       derived from ZWD by applying a delay to mass conversion
ZTDs).                                                            factor κ(Tm ):
   For the operational streams, only the second type of infor-
mation was available, and a basic screening procedure was         IWV = κ(Tm ) × ZWD.                                        (3)

Earth Syst. Sci. Data, 13, 2407–2436, 2021                                       https://doi.org/10.5194/essd-13-2407-2021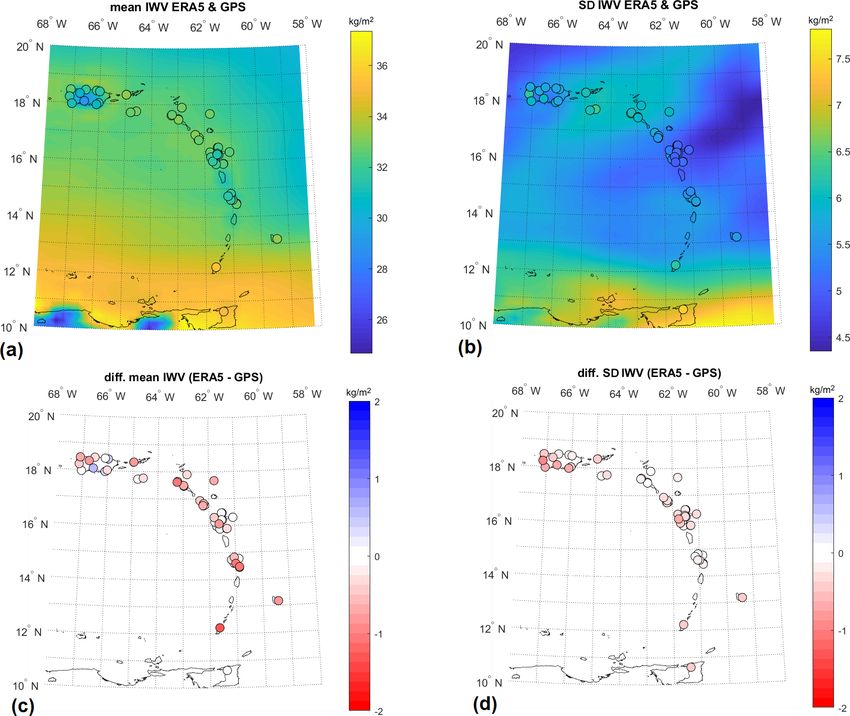
O. Bock et al.: EUREC4 A ground-based GNSS IWV data                                                                      2411

Table 1. Details of the five processing streams operated by IGN and ENSTA_B/IPGP in the framework of EUREC4 A.

       RGP NRT
       Availability                   31 October 2019–present
       Software                       Bernese GNSS software v5.2
       Strategy                       Double-difference solution
       Network                        30 to 40 permanent stations from South America to Canada
       Orbits and clocks              Ultra-rapid International GNSS Service (IGS)
       Window length                  6 h, shifted by 1 h every hour
       Elevation cutoff angle         10◦
       Observation sampling           30 s
       Observation weighting          σ 2 = 10−6 /cos2 (Z), where Z is zenith angle
       Tropospheric model             ZHD and ZWD a priori: GPT model
                                      ZHD and ZWD mapping functions: GMF; gradient mapping function: tilting
                                      ZWD sampling: 15 min; gradient sampling: one per window
                                      ZWD constraint: 5 m absolute and 1 mm relative; gradient constraint: 5 m
       Coordinate estimates           Fixed
       Ambiguity resolution           Quasi-ionosphere free (baselines ≥ 20 km) and σ (baselines < 20 km)
       Specific features (NRT only)   Reuse of the normal equation from previous solution
       RGP daily (difference w.r.t. RGP NRT)
       Availability                   31 October 2019–present
       Network                        70 to 80 permanent stations from South America to Canada
       Orbits and clocks              Rapid ESA (European Space Agency)
       Window length                  24 h
       Tropospheric model             ZWD constraint: 5 m absolute and relative
       GIPSY rapid
       Availability                   31 October 2019–present
       Software                       GIPSY OASIS II software v6.4
       Strategy                       Precise point positioning (PPP) solution
       Orbits and clocks              Rapid JPL (Jet Propulsion Laboratory)
       Window length                  30 h (21:00 UTC day D−1 to 03:00 UTC day D + 1)
       Elevation cutoff angle         7◦
       Observation sampling           5 min
       Observation weighting          Uniform weighting
       Tropospheric model             ZHD and ZWD a priori: 6-hourly ECMWF analysis (provided by TUV)
                                      ZHD and ZWD mapping functions: VMF1; gradient mapping function: Bar-Sever et al.
                                      (1998)
                                      ZWD and gradient model: random walk
                                      ZWD and gradient sampling: 5 min
                                      ZWD and gradient constraints: 5 mm h−1/2 (ZWD) and 0.5 mm h−1/2 (gradients)
       Coordinate estimates           Estimated once per window
       Ambiguity resolution           Bertiger et al. (2010)
       GIPSY final (difference w.r.t. GIPSY rapid)
       Orbits and clocks              Final JPL
       GIPSY repro1 (difference w.r.t. GIPSY rapid)
       Availability                   1 January–29 February 2020
       Orbits and clocks              Final JPL
       Ionospheric model              Order 2

https://doi.org/10.5194/essd-13-2407-2021                                          Earth Syst. Sci. Data, 13, 2407–2436, 2021
2412 O. Bock et al.: EUREC4 A ground-based GNSS IWV data
κ is a semi-empirical function of the weighted mean temper- 2.3.2 GIPSY rapid and final results
ature Tm defined as (Bevis et al., 1992)
This data set is also provided only for the BCON and BCOS
10 6 stations but it used the a priori values for ZHD available dur-
κ(Tm ) = , (4) ing the data processing. The values were obtained from the
Rv k20 + Tkm3 Technical University of Vienna (TUV) as part of the VMF1
tropospheric parameters computed from the ECMWF opera-
where k20 and k3 are refractivity coefficients for the water tional analysis (Boehm et al., 2006). The TUV also computes
molecule; Rv is the specific gas constant for water vapour. Tm values using Eq. (5) from the same analysis. Both prod-
Tm is defined as ucts are made available on a global grid with 2◦ latitude and
R 2.5◦ longitude resolution every 6 h. The refractivity coeffi-
ρv (z)dz cients and gm are the same as those for the RGP data set.
Tm = R ρ (z) , (5)
v
T (z) dz
2.3.3 GIPSY repro1 results
where ρv (z) and T (z) and the specific mass of water vapour
and the air temperature, respectively, at height z above the For the reprocessed data set, we used a more rigorous ap-
surface. The integrals are from the surface to the top of the proach following Bock (2020a). Here, the ZHD and Tm val-
atmosphere. ues are computed from ERA5 pressure-level data at the four
Practically, the GNSS IWV estimates are converted from surrounding grid points and are interpolated bilinearly to
the ZTD data using Eqs. (1) to (4) with the auxiliary the positions of the GNSS antennas. The ERA5 fields were
data, Ps and Tm , given at the position of the GNSS sta- used with the highest temporal and spatial resolutions: 1-
tion with interpolation to the GNSS times. On average, for hourly and 0.25◦ × 0.25◦ , respectively. The refractivity co-
the 2-month period (January–February 2020), the conver- efficients and thermodynamics constants were updated from
sion parameter amounts to κ = 164 kg m−3 and the observed Bock (2020a) to account for the global CO2 content for Jan-
ZWD = 0.20 m results into IWV = 32 kg m−2 . The sensitiv- uary 2020 (see the Appendix). The gm formula proposed by
ity of IWV estimates to errors in the auxiliary data can be Bosser et al. (2007) was used instead of the Saastamoinen
assessed by the partial derivatives: ∂IWV ∂IWV (1972) one.
∂ZTD = − ∂ZHD = 0.16
This methodology provides the most accurate IWV esti-
(kg m−2 ) mm−1 , and ∂IWV −2 −3 −1
∂κ = 0.20 (kg m ) (kg m ) , or
∂IWV −2 −1 ∂IWV mates regarding the available data at the 49 stations of the
equivalently ∂Ps = 0.35 (kg m ) hPa and ∂Tm = 0.12 extended network and the best knowledge of uncertainties
(kg m−2 ) K−1 , where the numerical values were computed due to the various empirical formulas (Tm and gm ) and aux-
from the average EUREC4 A conditions. iliary data.
Various sets of refractivity coefficients and auxiliary data
were available and used with our operational and research 2.3.4 Uncertainty due to IWV conversion methods
GNSS products and are described in the subsections below.
The three data sets (RGP, GIPSY operational, and GIPSY
repro1) used different conversion methods, which are associ-
2.3.1 RGP NRT and daily results
ated with different uncertainties. Although repro1 is the most
This data set is provided only for the BCON and BCOS sta- accurate, it is not an operational stream and covers only a
tions which benefit from collocated surface air pressure and limited period of time. Users may thus be interested in the
temperature measurements. The measurements come from near-real-time and extended time coverage of the two opera-
Vaisala PTU200 sensors connected directly to the GNSS re- tional data sets available for stations BCON and BCOS. The
ceivers and are included in the raw GNSS data files. The consistency of the different data sets is assessed in the next
ZHD estimates are therefore computed using Eq. (2) and the section for ZTD and IWV. Here, we describe how the differ-
Tm values are computed using the widely used Bevis et al. ent error sources contribute to overall uncertainty in the IWV
(1992) formula: data.
Let us consider two ZTD solutions from two different pro-
Tm = 70.2 + 0.72Ts , (6) cessing streams, ZTD1 and ZTD2 , converted to IWV using
different ZHD and κ data, ZHD1,2 and κ1,2 . The two IWV
where Ts is the surface pressure. This formula was derived solutions (IWV1 and IWV2 ) write
by Bevis et al. (1992) from a radiosonde data set over the
US with a root mean square error (RMSE) of 4.7 K. The re- IWV1 = κ1 · (ZTD1 − ZHD1 ) (7)
fractivity coefficients used for the computation of ZHD and IWV2 = κ2 · (ZTD2 − ZHD2 ). (8)
κ are from Thayer (1974), the thermodynamics constants are
from ICAO (1993), and the gm formula is from Saastamoinen The difference 1IWV = IWV2 −IWV1 can be separated into
(1972). systematic and random components and written as a function
Earth Syst. Sci. Data, 13, 2407–2436, 2021 https://doi.org/10.5194/essd-13-2407-2021O. Bock et al.: EUREC4 A ground-based GNSS IWV data 2413
of the contributions (assumed independent) of the system-
atic and random differences of the three parameters 1ZTD =
ZTD2 − ZTD1 , 1ZHD = ZHD2 − ZHD1 , 1κ = κ2 − κ1 as
IWV1
1IWV = κ2 · 1ZTD − κ2 · 1ZHD + 1κ (9)
κ1
(σ1IWV )2 = (κ2 · σ1ZTD )2 + (κ2 · σ1ZHD )2
2
IWV1
+ σ1κ . (10)
K1
The magnitude of the actual errors in the auxiliary data
used in the different conversion methods can be determined
from Fig. 2. The figure shows that the ZHD data com-
puted from ERA5 reanalysis and PTU sensor agree well. The
mean pressure (ZHD) difference (ERA5 − PTU) amounts to
−0.13±0.20 hPa (−0.30±0.45 mm), whose impact on IWV
represents 0.045±0.070 kg m−2 . ERA5 is thus a good source
of surface pressure for the IWV conversion with negligible
bias at this site. The ZHD estimates computed from ECMWF
by TUV on the other hand have significant aliasing errors
(Fig. 2). This is due to the strong atmospheric tide seen in
the surface pressure that cannot be resolved by the 6-hourly
analysis data (shown by crosses upon the dashed red line in
the lower ZHD panel).
Regarding the κ data, TUV and ERA5 agree well but the
PTU-derived curve has significant errors because it uses the
empirical formula given by Eq. (6) which is based on surface
temperature and does not correlate well with the upper air
variations that influence Tm . In the case of the RGP data set,
the use of the Bevis et al. (1992) formula is the dominant
error source in the IWV conversion process, while in the case
of GIPSY rapid and final results, the use of 6-hourly ZHD
data from TUV is the main error source. Figure 2. Time series of the auxiliary data (ZHD and K) used to
We also evaluated the accuracy of the ERA5 Tm estimates convert ZTD to IWV in the different GNSS streams: high-resolution
in comparison to Tm computed from the radiosonde data at ERA5 pressure-level data, ECMWF analysis provided by TUV, sur-
the BCO. The mean difference and standard deviation of the face pressure and temperature observations (PTU) for GNSS station
resulting IWV estimates for 138 soundings were 0.03 kg m−2 BCON (a, b) from 1 January to 29 February 2020 and (c, d) from 1
(ERA5 − soundings) and 0.05 kg m−2 , respectively. to 6 January 2020.
Compared to the differences in IWV estimates resulting
from the use of different auxiliary data, the impact of the re-
fractivity constants (Thayer, 1974 vs. Bock, 2020a) is rather who wish to analyse the IWV directly (e.g. for process stud-
small and represents a bias of 0.045 kg m−2 . ies, intercomparison with other observational techniques, or
verification of atmospheric model simulations).
3 ZTD and IWV intercomparisons at the BCO
In this section, we intercompare both ZTD and IWV results 3.1 RGP NRT results
from the five processing streams. The motivation for compar-
ing the ZTD results is that it reflects the uncertainty due to the As explained above, in the RGP NRT solution, each hourly
GNSS processing only, while the IWV comparison includes time slot is processed six times while it is shifted from the
the conversion errors discussed in the previous section. The most recent position (referred to as NRT.6) to the oldest
uncertainty in the ZTD data is of interest to the data assim- (NRT.1) in the 6-hourly time window. The highest preci-
ilation community since ZTDs are currently assimilated in sion is expected in the central time slots (NRT.2 to NRT.5)
most NWP models (rather than IWV). On the other hand, because these are farther from the edges and are best con-
the uncertainty in the IWV data may be of interest to users strained by the observations.
https://doi.org/10.5194/essd-13-2407-2021 Earth Syst. Sci. Data, 13, 2407–2436, 20212414 O. Bock et al.: EUREC4 A ground-based GNSS IWV data
Table 2. RGP NRT ZTD and IWV solutions (NRT.1 to NRT.6) compared to RGP daily and GIPSY repro1, station BCON, period 1 Jan-
uary 2020 to 29 February 2020. In the upper row, “σ ” indicates the mean formal error of the RGP NRT solutions (in metres). The comparisons
show mean differences (RGP NRT minus RGP daily/GIPSY repro1), standard deviation of differences and the number of points (NP). The
RGP daily data sampling is 1 h and the GIPSY repro1 sampling is 5 min.
ZTD NRT.1 NRT.2 NRT.3 NRT.4 NRT.5 NRT.6
σ (m) 0.0034 0.0034 0.0036 0.0040 0.0046 0.0061
Compared to RGP daily (1-hourly)
Mean diff. (m) −0.0406 −0.0314 −0.0190 −0.0076 0.0018 0.0076
SD diff. (m) 0.0169 0.0127 0.0103 0.0094 0.0104 0.0129
NP 1436 1437 1438 1439 1440 1438
Compared to GIPSY repro1 (5 min)
Mean diff. (m) −0.0360 −0.0243 −0.0123 −0.0016 0.0066 0.0108
SD diff. (m) 0.0154 0.0126 0.0107 0.0102 0.0111 0.0131
NP 5733 5737 5741 5745 5743 5724
IWV NRT.1 NRT.2 NRT.3 NRT.4 NRT.5 NRT.6
Compared to RGP daily (1-hourly)
Mean diff. (kg m−2 ) −6.58 −5.10 −3.08 −1.24 0.29 1.23
SD diff. (kg m−2 ) 2.73 2.06 1.67 1.52 1.69 2.08
NP 1434 1435 1436 1437 1438 1437
Compared to GIPSY repro1 (5 min)
Mean diff. (kg m−2 ) −6.13 −4.24 −2.29 −0.55 0.77 1.46
SD diff. (kg m−2 ) 2.48 2.03 1.74 1.66 1.82 2.14
NP 5727 5731 5735 5739 5738 5720
3.1.1 ZTD intercomparison that the number of comparisons is also different by a factor
of 4 due to the different ZTD sampling of the three solutions.
The overall uncertainty in the NRT solution is mainly due Compared to GIPSY repro1, the RGP NRT.4 has the small-
to the ultra-rapid satellite products and small window size est bias and standard deviation. We recommend thus to use
(impacting the ambiguity resolution). It can be evaluated by this solution for near-real-time applications when timeliness
comparison with the RGP daily or any of the GIPSY solu- is not too restrictive (e.g. in NWP assimilation schemes, the
tions. The upper part of Table 2 shows the results for the ZTD data from NRT.6 are used, which are a bit less accurate).
ZTD estimates. The comparison to RGP daily reveals a trend Figure 3 shows the ZTD and formal error time series
in the mean difference from NRT.1 to NRT.6, with a large from the RGP NRT.4 solution and the other two processing
negative bias in NRT.1 of −0.04 m (RGP NRT ZTD < RGP streams. It it seen that the temporal variations in ZTD are
daily ZTD). This bias was actually unexpected. It is an arte- very consistent among all three data streams with small dif-
fact due to the propagation of tropospheric gradient biases ferences (< 0.01 m) compared to the ZTD variations (0.1 m).
from one time slot to the next. This feature was corrected On the other hand, the formal errors of the NRT solution are
in July 2020 and the bias is no longer present in the current much larger than those of the RGP daily and the GIPSY re-
operational NRT product. The standard deviation of differ- pro1 solutions. GIPSY repro1 also has more stable formal
ences shows a minimum (9.4 mm) for the NRT.4 solution. errors than RGP daily.
The values are actually smaller in the central time slots as
expected. However, the formal errors (top row of Table 2) 3.1.2 IWV intercomparison
predict smaller uncertainty in the first time slot instead. This
is a consequence of using the previous normal equations. The lower part of Table 2 shows the IWV results. In the case
The comparison with GIPSY repro1 confirms these con- of the comparison of RGP NRT to RGP daily, the IWV re-
clusions although there are small differences in the results: sults are consistent with the ZTD results since both solutions
mainly, the bias is slightly offset by 4 mm. Since this com- use the same ZHD and K conversion data. The IWV differ-
parison involves two different software and processing ap- ences are here proportional to the ZTD differences with a
proaches, these small differences are not surprising. Note factor of 162 kg m−3 , which is close to the mean value of
Earth Syst. Sci. Data, 13, 2407–2436, 2021 https://doi.org/10.5194/essd-13-2407-2021O. Bock et al.: EUREC4 A ground-based GNSS IWV data 2415
update. The constraint is the same in the NRT.4 slot but the
oscillation is strongly damped (not shown). This result also
indicates that the NRT.4 solution rather than the NRT.6 solu-
tion should be used when relevant.
3.2 RGP daily and GIPSY results
Similar ZTD and IWV comparisons have been performed for
the other processing streams which are of interest for offline
applications.
The left part of Table 3 shows the ZTD comparison re-
sults. The comparisons of RGP daily to GIPSY rapid and
repro1 show very similar results. The agreement between the
two processing softwares is quite good, with a small differ-
ence in the mean values of 2.1–2.4 mm for station BCON
and 1.1–1.3 mm for station BCOS. The standard deviations
Figure 3. Time series of ZTD estimates and formal errors (σ ) from
of ZTD differences are about 5.7–5.8 mm for both stations.
RGP NRT.4, RGP daily, and GIPSY repro1 solutions from 1 Jan-
uary to 29 February 2020.
The differences reflect mainly the impact of using differ-
ent satellite products, mapping functions, tropospheric model
constraints, and elevation cutoff angles. The comparisons of
the three GIPSY solutions show comparatively much bet-
ter agreement with almost no bias (the mean differences are
around −0.1 to 0.3 mm) and very small standard deviations
(0.8 to 2.8 mm). The comparison of the two operational solu-
tions (GIPSY rapid and final) shows the smallest standard de-
viation because they use exactly the same processing options;
the only difference is in the satellite products but they were
produced by the same analysis centre (JPL) and are highly
consistent. The comparison of the GIPSY operational solu-
tions to repro1 shows slightly larger differences which are
due to small differences in the processing options.
IWV comparisons have been performed for the same five
combinations. In addition to the ZTD differences, due to the
processing strategies, these comparisons will include the ef-
fect of the IWV conversion methods:
– RGP daily and GIPSY rapid differ by ZHD (PTU
vs. TUV) and K (Bevis vs. TUV); strong impact is ex-
Figure 4. Time series of IWV from near-real-time GNSS process-
pected from differences in both parameters;
ing (RGP NRT.6) compared to post-processed GNSS (GIPSY re-
pro1) from 10 to 20 January 2020. Panel (a) shows the IWV time – RGP daily and GIPSY repro1 differ by ZHD (PTU
series and panel (b) the IWV difference (NRT minus repro1). vs. ERA5) and K (Bevis vs. ERA5); strong impact is
expected from K;
K = 164 kg m−3 . On the other hand, the comparison with – GIPSY rapid and final use the same conversion param-
GIPSY repro1 includes the differences in the conversion eters;
data, and the ratio of IWV-to-ZTD results is not a constant – GIPSY rapid and final differ from repro1 by ZHD and K
factor. This point is further discussed in the next subsection. (TUV vs. ERA5); strong impact is expected from ZHD.
Similar to the ZTD results, the IWV solution for NRT.4 is in
good agreement with RGP daily and GIPSY repro1. The right part of Table 3 shows the IWV results and confirms
Figure 4 compares the NRT.6 IWV estimates to GIPSY re- they include additional errors compared to the ZTD results
pro1 for the time period from 10 to 20 January 2020 marked (left part the table). Most notably, (i) a change in the bias
by a period of 2 d with high IWV around 45 kg m−2 . It is between RGP daily – GIPSY rapid and RGP daily – GIPSY
striking that the NRT.6 solution shows spurious oscillations repro1 because the two GIPSY solutions use different pa-
with a period about 1 h. This feature is due to the strong rel- rameters. In the first comparison, the bias is due to the ZHD
ative constraint (1 mm) in the NRT solution with an hourly data used in the GIPSY rapid solution (TUV) and the K data
https://doi.org/10.5194/essd-13-2407-2021 Earth Syst. Sci. Data, 13, 2407–2436, 20212416 O. Bock et al.: EUREC4 A ground-based GNSS IWV data
Table 3. Similar to Table 2 but for RGP daily, GIPSY rapid, and GIPSY repro1 results for stations BCON and BCOS. The leftmost part
shows ZTD results and the rightmost shows IWV results.
ZTD BCON BCOS IWV BCON BCOS
RGP_daily.vs.GIPSY_rapid
Mean diff. (m) 0.0021 0.0011 Mean diff. (kg m−2 ) −0.390 −0.550
SD diff. (m) 0.0058 0.0057 SD diff. (kg m−2 ) 1.000 1.000
NP 1440 1440 NP 1438 1438
RGP_daily.vs.GIPSY_repro1
Mean diff. (m) 0.0024 0.0013 Mean diff. (kg m−2 ) 0.085 −0.085
SD diff. (m) 0.0058 0.0057 SD diff. (kg m−2 ) 0.955 0.942
NP 1440 1440 NP 1438 1438
GIPSY_rapid.vs.GIPSY_final
Mean diff. (m) 0.0003 0.0003 Mean diff. (kg m−2 ) 0.055 0.048
SD diff. (m) 0.0008 0.0008 SD diff. (kg m−2 ) 0.129 0.129
NP 17 275 17 280 NP 17 275 17 280
GIPSY_rapid.vs.GIPSY_repro1
Mean diff. (m) 0.0003 0.0002 Mean diff. (kg m−2 ) 0.473 0.463
SD diff. (m) 0.0018 0.0017 SD diff. (kg m−2 ) 0.468 0.480
NP 17 268 17 272 NP 17 266 17 264
GIPSY_final.vs.GIPSY_repro1
Mean diff. (m) −0.0001 −0.0001 Mean diff. (kg m−2 ) 0.418 0.415
SD diff. (m) 0.0016 0.0016 SD diff. (kg m−2 ) 0.450 0.461
NP 17 266 17 272 NP 17 266 17 264
in the RGP daily solution (due to the Bevis et al., 1994 for- – In the GIPSY final and repro1 comparison, the bias in
mula). In the second comparison, only the K bias in the RGP the GIPSY final is almost only due to a bias in ZHD,
rapid solution is involved. (ii) A noticeable bias and standard while the random errors are due to ZTD and ZHD dif-
deviation between the two operational GIPSY solutions and ferences of the same magnitude.
the repro1 due to the ZHD data used in the former (TUV).
The two operational GIPSY solutions are highly consistent
in IWV (similar to the ZTD solutions) but this result hides In conclusion, compared to the GIPSY repro1 data set which
the fact that they include common ZHD errors. uses the most accurate data processing and conversion pa-
Table 4 quantifies more precisely the contributions from rameters, both operational streams show small systematic
the difference error sources (ZTD, ZHD, and K) to the total and random errors on the level of ±0.5 and ±1.0 kg m−2 ,
IWV differences, where the mean and random components respectively.
have been separated according to Eqs. (9) and (10). The fol-
lowing can be seen:
– In the RGP daily and GIPSY rapid comparison, all three 3.3 GNSS compared to other IWV data sources
error sources contribute in the same proportions to the
bias, while the random errors are dominated by ZTD Two other instruments operated at the BCO facility are used
errors. here: the Vaisala RS41/MW41 radiosonde system (Stephan
et al., 2021) and the Radiometer Physics GmbH (RPG)
HATPRO-G5 microwave radiometer (MWR) (Rose et al.,
– In the RGP daily and GIPSY repro1 comparison, the 2005). The IWV retrievals from these systems were com-
small bias in RGP daily is a result of almost exact can- pared to IWV estimates from the BCON GNSS station
celling of a ZTD bias and a K bias in the RGP data. The (GIPSY repro1) and ERA5 IWV data for the period from
random errors in the RGP data are again dominated by 1 January to 29 February 2020. For the radiosondes, the
ZTD errors. level-1 pressure (P ), temperature (T ), and relative humidity
Earth Syst. Sci. Data, 13, 2407–2436, 2021 https://doi.org/10.5194/essd-13-2407-2021O. Bock et al.: EUREC4 A ground-based GNSS IWV data 2417
Table 4. Separation of bias (mean) and random errors (1 standard deviation) of IWV differences into contributions from ZTD differences,
ZHD differences, and K differences, for two operational data streams (RGP daily and GIPSY rapid) and the reprocessed stream (GIPSY
repro1). The three streams involve different auxiliary data for the ZTD-to-IWV conversion from PTU, TUV, and ERA5. See text for more
details.
ZTD data Auxiliary Contribution to bias Contribution to random error
data (kg m−2 ) (kg m−2 )
ZTD ZHD K Total ZTD ZHD K Total
RGP_daily − GIPSY_rapid PTU − TUV 0.34 0.29 −0.44 −0.39 0.92 0.36 0.17 0.99
RGP_daily − GIPSY_repro1 PTU − ERA5 0.39 −0.13 −0.44 0.08 0.94 0.08 0.18 0.95
GIPSY_rapid − GIPSY_repro1 TUV − ERA5 −0.02 −0.43 0.00 0.41 0.28 0.36 0.06 0.46
(RH) data were used and IWV was computed as In addition, we also included the twice-daily (00:00 and
12:00 UTC) radiosonde measurements from the operational
ZPtop radiosonde station at Grantley Adams International Airport
IWVRS = q(P )/g(P )dP , (11) (GAIA, WMO code 78954) located 11 km away from the
BCO. This station used GRAW DFM-09 at the time of
PGPS
the campaign (Kathy-Ann Caesar, personal communication,
2021). The sonde data were retrieved from the University of
where the integral extends from the GNSS station height to Wyoming sounding archive and contained on average 85 ± 6
the top of the sounding (24 km on average), q(P ) is the spe- vertical levels up to an altitude of 29 ± 2 km. The vertical
cific humidity computed from RH and T using Tetens (1930) sampling of these data is coarser than the BCO data but fine
saturation pressure formula over water, and g(P ) is the accel- enough to compute proper IWV contents. The latter were
eration of gravity as a function of altitude. The 1 s time sam- computed in a similar way to that for the BCO soundings
pling of the radiosonde data provides high vertical resolution except near the surface where the ERA5 pressure-level data
(about 5 m in the lower troposphere). They were checked for were used to complete the sounding profiles. This is because
consistency and thinned for including only increasing alti- the GAIA station is located at an altitude of 57 m, slightly
tude points. Very few data gaps were noticed in the vertical above the BCO, which is at 25 m altitude.
profiles, which confirms that the sounding operations worked Figure 5 shows the IWV time series of the different data
fine all along the campaign and did not need further correc- sources at their nominal time resolutions. The period un-
tion or screening. The BCO soundings provided a nearly con- derwent large moisture variations with IWV fluctuations be-
tinuous sampling of the upper air conditions between 16 Jan- tween 20 and 55 kg m−2 . Several remarkable situations are
uary and 19 February, every 4 h (Stephan et al., 2021). The observed, such as the peaks on 22 January around 12:00 UTC
MWR worked for a more extended period from 1 January to and 24 January around 00:00 UTC and a few more in Febru-
15 February. The brightness temperature measurements were ary (days 40, 42, 43–44, 45). The agreement between the five
used to retrieve IWV using a neural network algorithm pro- data sets is good in general but ERA5 is seen to underesti-
vided by the manufacturer. In precipitating conditions, the mate the IWV during the aforementioned peaks. Quite ob-
measurements usually experience strong biases due to wet vious is also the bias between the two sounding data, with
radome emissions (see Fig. 5) and are screened out according the BCO IWV contents systematically higher than the GAIA
to a rain detection index (including also sea spray detection). measurements. Less easy to distinguish, but nevertheless sig-
The IWV contents are nominally retrieved with a 1 s sam- nificant, is the offset in the HATPRO MWR IWV retrievals
pling, which we downscaled to 5 min, by computing arith- before and after 27 January. The HATPRO data are actually
metic means to be consistent with the GNSS sampling. Some more consistent with the GAIA data before that date and in-
outliers remained in the MWR IWV series which were sub- stead more consistent with the BCO radiosonde data after.
sequently removed from the comparisons by a simple outlier Analysis of the measured brightness temperatures showed
check of the IWV differences with limits of mean ±3 stan- that during the former period, the measurements were less
dard deviations. accurate due to an instrumental malfunction which was fixed
The ERA5 IWV contents above the GNSS station were on 27 January.
computed from the hourly pressure-level data at the four Figure 6 compares the IWV data from the five sources
surrounding grid points and interpolated bilinearly to the pairwise and includes some consistency statistics. The slope
position of the GNSS antenna. The use of pressure-level and offset parameters were fitted using the York et al. (2004)
data instead of model-level data induces a minor bias of method to account for errors in both coordinates. For both
0.2 ± 0.1 kg m−2 but these data are more convenient to use radiosondes and HATPRO, the uncertainty in the IWV es-
and consistent with the Tm computation (see Sect. 2.3.3).
https://doi.org/10.5194/essd-13-2407-2021 Earth Syst. Sci. Data, 13, 2407–2436, 20212418 O. Bock et al.: EUREC4 A ground-based GNSS IWV data Figure 5. Time series of IWV from GNSS station BCON, RS41 sondes, and HATPRO microwave radiometer collocated at BCO, as well as operational sondes from Grantley Adams International Airport (WMO ID 78954) and ERA5 reanalysis, from 15 January to 19 February 2020. The vertical grey bars at the bottom of the plot show precipitation data collected at BCO. timates was assumed to be 5 %. For ERA5, the uncertainty paign (Fig. A4 in Stephan et al., 2021). Another contribu- was computed as the max − min of the IWV values at the tion might arise from moisture transport associated with land four surrounding grid points before the horizontal interpo- and sea breezes as was previously evidenced in Colombo, Sri lation, which is a measure of the representativeness error Lanka, where the land–sea breezes contributed to a daytime (Bock and Parracho, 2019). The uncertainty estimates over boundary layer moistening and nighttime drying observed in the study period were 1.71±0.31 kg m−2 for the BCO sound- radiosoundings (Ciesielski et al., 2014a). The moisture ob- ings, 1.57 ± 0.28 kg m−2 for the GAIA soundings, 1.65 ± servations at the BCO exhibit actually a day–night variation 0.25 kg m−2 for HATPRO, and 1.48±0.86 kg m−2 for ERA5. in IWV of 1.7 kg m−2 , whereas the variation at GAIA is sig- For GNSS, the ZTD formal errors were converted to IWV nificantly smaller (1.1 kg m−2 ). Although both effects are not and rescaled with a factor of 5 in order to be consistent with negligible, they are not large enough to explain the mean bias the other data sources, yielding a final GNSS IWV uncer- between the BCO and GAIA sondes. Instead, we suspect the tainty of 1.15 ± 0.16 kg m−2 . difference in sonde types to play a more central role. Results from the GPS, the BCO and GAIA sondes, and The Vaisala RS41 sondes used at BCO are from the last the ERA5 comparisons are reported in Fig. 6. While IWV generation of sondes and are considered to provide signif- varies from 20 to 55 kg m−2 over the period, the bias be- icantly improved temperature and humidity measurements tween the two sondes is −2.89 kg m−2 (GAIA – BCO) with compared to previous sonde types (e.g. Vaisala RS92) espe- a slope of 0.94 and an offset of −0.69 kg m−2 . The GAIA cially in cloudy conditions (Jensen et al., 2016). High confi- data are drier than the BCO data over the full observation dence in the BCO soundings suggests that the GAIA sound- range. The comparison of profiles shows that the humidity ings have a significant dry bias which may impact humidity measurements from the two sondes differ mainly in the low- analyses from NWP models that assimilate these observa- ermost 2.5 km where the mean difference in q is larger than tions. This seems to be the case for ERA5 and would ex- 1 g kg−1 . One contribution to this difference may be the dif- plain the high consistency between ERA5 and GAIA IWV ference of trajectories of the sounding balloons released from estimates (bias of 0.29 kg m−2 and near-unity slope) and the the two sites. Balloons released from the BCO site usually large difference of ERA5 compared to the BCO (bias of travel west and southwards over the island of Barbados until −2.33 kg m−2 and slope of 0.93). The GNSS IWV estimates they reach an altitude of 6–8 km when they enter the west- are intermediate between the two sounding results. Using erly jet. The balloons released from GAIA drift in similar GNSS as the reference, we conclude that there is a wet bias directions but arrive earlier over the open sea as they are in the BCO radiosonde data of 1.64 kg m−2 and a dry bias released from the southern part of the island. A small “is- in the GAIA radiosonde data (−1.23 kg m−2 ) as well as in land effect” might show up here as the moisture profiles over the ERA5 data (−0.77 kg m−2 ). On the other hand, using the island of Barbados seemed to be slightly moister than the BCO sounding data as a reference, one would conclude those over the nearby sea during the EUREC4 A field cam- on a dry bias in all other IWV estimates, except the HAT- Earth Syst. Sci. Data, 13, 2407–2436, 2021 https://doi.org/10.5194/essd-13-2407-2021
O. Bock et al.: EUREC4 A ground-based GNSS IWV data                                                                            2419

Figure 6. Pairwise scatter diagrams of IWV estimates from GNSS station BCON (GPS), HATPRO MWR, Vaisala RS41 radiosondes released
from the BCO (RS BCO), operational radiosondes released from Grantley Adams International Airport (RS GA), and ERA5 reanalysis. The
HATPRO data set has been separated in two parts: before (black symbols) and after (red) 27 January when the system was fixed for an
instrumental failure. Note that sample sizes are different between diagrams because each comparison is done with the highest temporal
resolution for the period of available data between 1 January and 29 February 2020.

PRO MWR after the instrumental fix on 27 January, where                 The comparison of HATPRO IWV retrievals has been
the MWR retrieval is slightly moist. Since no reference wa-          separated into two batches (before and after 27 January).
ter vapour measurements were made at the same time, it is            Compared to GNSS, the bias before (after) is −1.28
difficult to establish the absolute sign of these biases. The        (+2.06) kg m−2 with a slope significantly larger than 1 indi-
GNSS − RS41 bias of −1.64 kg m−2 observed here repre-                cating that the bias increases with the amount of IWV. Sim-
sents a fractional bias of 5 % which is slightly larger the          ilar slope values are obtained in the comparison to the other
uncertainty of both systems and thus needs to be explained.          data sources, which might be attributed to the MWR training
From our previous experience comparing Vaisala RS92 son-             data set (Rose et al., 2005). Occurring biases could be further
des and GNSS IWV estimates (produced using the same ap-              corrected by applying a clear-sky brightness temperature off-
proach as in this study), we observed slightly smaller biases        set correction based on sounding data. In terms of temporal
of ±0.5 to 2 % (Bock et al., 2016). Further investigation is         variability, the MWR, GNSS, and BCO sondes are in good
needed in the case of the RS41 vs. GNSS comparisons.                 agreement (standard deviation of differences ∼ 1 kg m−2 and
                                                                     correlation coefficient ≥ 0.98). The bias with respect to the

https://doi.org/10.5194/essd-13-2407-2021                                           Earth Syst. Sci. Data, 13, 2407–2436, 2021
2420 O. Bock et al.: EUREC4 A ground-based GNSS IWV data
BCO soundings is 0.48 kg m−2 (MWR too moist) during the (ERA5 − GNSS) is −0.34±0.50 kg m−2 , pointing to a small
second period, but this bias is within the known uncertainties. dry bias of ERA5 in the region with some site-to-site varia-
ERA5 is biased low compared to both GNSS and BCO tion. This result is consistent with the bias that is discussed
sondes with slopes lower than 1, meaning that the dry bias in the previous section based on BCO results, and also with
increases at larger IWV values. The scatter plots in Fig. 6 the results of a previous study (Bosser and Bock, 2021). But
exhibit a few outlying values which correspond to the situa- further investigation is needed to explain the reason for this
tion when ERA5 underestimates the IWV peaks during the dry bias in ERA5 (e.g. its link with the data assimilation). In
period 22–24 January (see Fig. 5). Quite surprisingly, the terms of temporal variability, the agreement between ERA5
GAIA soundings during this period, although slightly drier, and GNSS is also quite good, except over Puerto Rico. There
are much closer to GPS and BCO than ERA5. Inspection of is significant spatial modulation of the magnitude of vari-
the vertical humidity profiles (Fig. 7) shows that ERA5 is ability. Again the maximum is observed to the south over
close to the GAIA observations in the lower 2–2.5 km but the tropical Atlantic Ocean. The average difference of stan-
does not account for the vertical extension and the sharp drop dard deviation (ERA5 − GNSS) is −0.25 kg m−2 , meaning
in humidity at the top of the deep moist layer around 3–4 km that the variability in ERA5 is slightly underestimated com-
on 22 January and around 5 km on 24 January. The misrep- pared to GNSS. This may be partly due to a difference in
resentation of the relative humidity profile is spectacular on representativeness between the GNSS point observations and
24 January at 00:00 UTC. This might be due to the assimi- the gridded reanalysis fields (Bock and Parracho, 2019) and
lation of other data (e.g. satellite humidity sounders) that are partly to some special situations where the reanalysis under-
biased low in the mid-troposphere during this event. Inspec- estimates high-IWV contents (see Fig. 5).
tion of radar reflectivity measurements from the BCO reveals Table S2 in the Supplement gives the comparison results
that on both dates heavy rain was occurring over an extended for all stations. The mean and standard deviation of IWV
part of the lower troposphere (up to 3.5 km height on 22 Jan- differences (ERA5 − GNSS) have been cross-compared with
uary around 10:00–11:00 UTC and 5.0 km on 23 January the GNSS data quality diagnostics from Table S1 and no sig-
around 22:00–23:00 UTC). This would explain the saturated nificant correlation was found. We therefore believe the main
air (RH = 100 %) below 3 km for the former and below 5 km differences are not due to GNSS uncertainties but rather to
for the latter of the two BCO soundings. The GAIA sound- differences in representativeness such as evidenced particu-
ings mimic the BCO soundings but with a dry bias within larly over Puerto Rico. Closer inspection of the ERA5 orog-
these rainy layers. Above this layer, it seems that the GAIA raphy for this island shows that the topography is largely mis-
sondes have a moist bias, probably due to rain contamination represented in the model where the highest elevation is 316 m
of the humidity sensor, a problem that is corrected in the de- above sea level, whereas the real topography reaches 1338 m.
sign of the newer RS41 sondes (Jensen et al., 2016). Above Also, the latitudinal extension of the island is exaggerated
the moist layers, ERA5 fits well the BCO profiles. (e.g. GNSS station EMPR at 18.47◦ N is at an altitude, or
Complementary statistics are reported in Table 5, where geoid height, of 10 m, whereas the nearest model grid point
the data have been time matched. The conclusions are essen- at 18.5◦ N is at an altitude of 103 m). Since almost all the sta-
tially the same as discussed above, but the pairwise biases tions considered in this study are located on small volcanic
can be more easily compared and combined. islands with steep topography, the misrepresentation of the
topography is a major source of uncertainty in the GNSS and
ERA5 comparison. This poses also some problems to the as-
4 Spatiotemporal distribution of IWV at the regional
similation of observations taken from surface meteorological
scale
stations and upper air soundings.
4.1 Comparison of IWV retrievals from GNSS network
and ERA5 reanalysis 4.2 Couplings between clouds, circulation, and humidity
at the synoptic scale
Figure 8 shows the mean and standard deviation of hourly
IWV from ERA5 and GNSS for the 2-month period. The To illustrate the spatiotemporal variability of IWV at the re-
mean IWV is seen to be relatively uniform over the region, gional scale, we have selected five GNSS stations represen-
with a small SW–NE gradient correlated with the sea sur- tative of the different parts of the Caribbean arc (CA). The
face temperature (SST) gradient (SST decreasing towards the GNSS station CRO1 (St. Croix, US Virgin Islands; 17.76◦ N,
NE). The maximum, around 35 kg m−2 , is observed below 64.58◦ W) was chosen as being representative of the north-
13◦ N in the more tropical part of the domain, and the mini- ern CA. The GNSS station of LDIS (Guadeloupe; 16.30◦ N,
mum to the NE is around 30 kg m−2 . The mean ERA5 field 61.07◦ W) and FFT2 (Martinique; 14.60◦ N, 61.06◦ W) were
is generally in good agreement with the GNSS observations chosen as being representative of the central CA, GNSS
over the Caribbean arc (CA), with an exception over Puerto station BCOS (13.16◦ N, 59.42◦ W) was selected as being
Rico (18◦ N, 67◦ W), where ERA5 has a small dry bias (0.5– representative of Barbados, and the GNSS station of GRE1
1 kg m−2 ). On average, over all stations, the mean difference (Grenada; 12.22◦ N, 61.64◦ W) was selected for the southern
Earth Syst. Sci. Data, 13, 2407–2436, 2021 https://doi.org/10.5194/essd-13-2407-2021You can also read