Integrated Resource Planning - ROUNDTABLE 21-3 MAY 2021
←
→
Page content transcription
If your browser does not render page correctly, please read the page content below

Integrated Resource
Planning
ROUNDTABLE 21-3
MAY 2021

MEETING LOGISTICS
                    Electronic version of presentation:
                         https://www.portlandgeneral.com/our-company/energy-
                         strategy/resource-planning/integrated-resource-planning/irp-
                         public-meetings
                    Teams Meeting
                        Please click the meeting link sent to your email or here:
                             Join Microsoft Teams Meeting
                             +1 971-277-2317 (dial this number into your phone for
                             best results)
                             PW: 111 848 255 2
                             *Please use Microsoft Edge or Google Chrome with Teams
                             as it will give you the best experience

                                                                     IRP Roundtable 5/27/2021   2
PARTICIPATION
•   Mute your mic while others are speaking; to unmute via phone press *6

•   We will ask for comments and questions along the way
•   Participate using the chat box or ask questions verbally

•   Use the “raise hand” feature to signal you’d like to ask your question verbally

•   Wait to be called on
•   Please be polite and respect all participants on the webinar
•   Please stay on topic; we may interrupt or shorten questions to meet the time
    commitment of the meeting
                                                                         IRP Roundtable 5/27/2021   3
AGENDA
Welcome and introductions              15 minutes
Safety moment                          5 minutes
IRP uncertainty                        30 minutes
Price forecasts: part two              45 minutes
Capacity Assessment                    45 minutes
Portfolio requests from participants   5 minutes

                                                    IRP Roundtable 5/27/2021   4
SAFETY MOMENT
Outdoor recreation safety
Warmer weather and indoor restrictions
make hiking, biking, parks, and other
outdoor recreation a popular choice. To stay
safe, remember:
Hydration – drinking enough water is
essential to outdoor safety in any season
Navigation – carry a detailed map of the
area you are recreating in
First aid kit – have the supplies you need to
deal with minor and major injuries
Illumination – a light source is essential if
you get caught out after dark
Sun protection – bring sunscreen,
sunglasses, and hats for everyone in your
party

                                                IRP Roundtable 5/27/2021   5
IRP ANALYSIS PROCESS
                      Existing                                Resource
                                                                                                         Futures
                     Resources                                Options

   Load              Identify            Resource            Portfolio                                   Evaluate   Preferred
                                                                                 Portfolios
  Forecast            Need                Need               Construct                                   Options    Portfolio
                                                               ion

                                               Foundational principles and values
             Participant values: decarbonization, customer perspectives on risk and uncertainty, community and racial
                                                       equity, transparency
                                 Corporate values: reliable, clean, affordable, flexible, secure, safe
                                                Federal, state, and local regulations

                                                                                                                                IRP Roundtable 5/27/2021   6
IRP UNCERTAINTY
SETH WIGGINS
ROUNDTABLE 21-3

                  IRP Roundtable 5/27/2021   7
Planning without uncertainty is easy
With no uncertainty, the IRP would be simple, as we would know:
• The size and timing of any changes to customer demand
• Generation from our existing and contracted resources
• The costs and benefits associated with all resource options
• The availability of the market
• The impacts to customers across classes caused by our decisions
• All applicable regulations

We’d simply select the least-cost option for any necessary resource
additions

                                                           IRP Roundtable 5/27/2021   8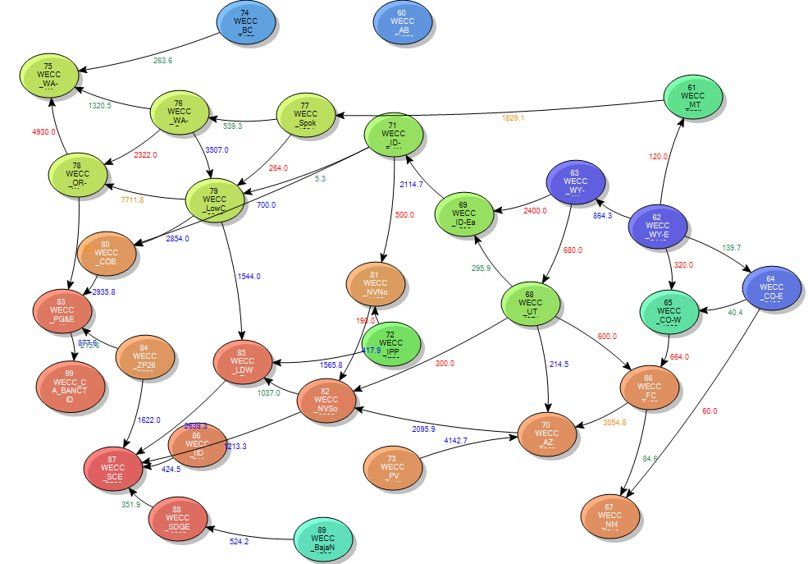
But there is so much we don’t know
                    Market Conditions

    Demand
                                                          Climate
                                    Planning
                                   Environment

                                                                             Supply Side
            Existing Portfolio                                                 Options
                                                 Transmission

                                 Voluntary
   Distributed                   Programs
   Resources

                                                                    IRP Roundtable 5/27/2021   9
2019 IRP attempts to model uncertainty
The 2019 IRP used two primary methods to incorporate uncertainty:

Futures: Portfolios were created and scored under changing market conditions
• Need: reference, high, & low need
• Technology Cost: various renewable cost decline trajectories
• Price: reference, high, & low hydro conditions and carbon, gas prices, reference and
   high renewable buildouts

Sensitivities: Key metrics were estimated varying specific inputs
• Voluntary renewable programs
• Direct access
• Qualifying Facilities
                                                                    IRP Roundtable 5/27/2021   10
Planning trade-off
The ability to examine these alternate views (other than the reference case)
presents an important trade-off:
• Too few alternate views of the future might not create a plan robust to future
conditions
• Too many alternate views of the future might not be feasible, could obscure
results, and slow modeling time
The IRP team seeks to balance this trade-off, efficiently creating a clear and
robust resource plan
IRP Roundtable 5/27/2021 11Answering questions
The IRP team includes alternative futures and sensitivities as means to the end of
answering on specific questions
For example:
• Question: How will our resource plan change with lower load growth?
• Means: Include low need future in portfolio analysis
• Answer: In the IRP (and IRP Update, shown below), we were able to show resource
buildouts by load future
Reference Case Low-Need Case
IRP Roundtable 5/27/2021 12We are seeking participant input
Determining which questions are most informative is a challenge.
We’re evaluating those from the 2019 IRP and are thinking ahead.
We’re also looking at the methods used/being developed.
• Are there questions you want to see us evaluate at in the next IRP?
• Were the means we’ve used effective at answering your questions?
• Are there any questions you think are no longer appropriate?
We’re interested in participant feedback and requesting responses by June
24 at IRP@pgn.com
IRP Roundtable 5/27/2021 13QUESTIONS & COMMENTS We’re seeking your feedback!
PRICE FORECASTS:
PART TWO
SILVIA MELCHIORRI, ROBERT BROWN, KATE VON REIS BARON
ROUNDTABLE 21-3

                                                       IRP Roundtable 5/27/2021   15
Electricity price forecasts The 2019 IRP established methods to develop the forecasted prices We've followed a similar set of procedures to develop initial draft price forecasts based on more recent inputs An important component of evaluating these draft forecasts is participant input We are open to feedback at this meeting and/or via IRP@pgn.com
Electricity price forecast:
Basic approach
Part I presented in Roundtable 21-1 on
Feb. 17, 2021
Goal: simulate LONG-TERM electricity
prices for the Pacific Northwest that
capture reasonable range of uncertainty
Methodology:
1. Software: Aurora with WECC
   database by Wood Mackenzie (WM)
2. PGE updates to database: gas,
   carbon, etc.
3. Simulate electricity prices for
   reference case and futures
4. Input simulated PNW prices into PGE
   resource dispatch model (PZM)
                                          IRP Roundtable 5/27/2021   17
Electricity price forecast Wood Mackenzie disclosure The data and information provided by Wood Mackenzie should not be interpreted as advice and you should not rely on it for any purpose. You may not copy or use this data and information except as expressly permitted by Wood Mackenzie in writing. To the fullest extent permitted by law, Wood Mackenzie accepts no responsibility for your use of this data and information except as specified in a written agreement you have entered into with Wood Mackenzie for the provision of such of such data and information.
Electricity price forecast:
WECC model                                   Illustrative snapshot in time of the Wood Mackenzie (WM)
                                                        WECC-wide topology as seen in Aurora
•   Software: Aurora, version
    13.5.1057 with GUROBI optimizer
•   Data: Wood Mackenzie WECC data
    base 2020H2 (released in Spring
    2021). It collects information on:
      o   Load and resources by
          geographical area (bubbles).
          Resources are both existing and
          new additions to meet
          forecasted load
      o   Transmission: capacity,
          constraints, wheeling costs, and
          carbon hurdle rates
      o   Macroeconomic data: fuel
          prices, environmental costs,
          inflation, etc.
      o   Calibration of resource behavior
          and optimization parameters
                                                     This pictures was obtained from a product of Wood Mackenzie.
Electricity price forecast:
What’s new in the 2022 IRP WECC model
• WM 2020H2 embraces the view of future additions being mainly renewables + storage (see next
slide)
• WM extended its forecasts to 2050. For IRP purposes, we need at least 20 years of forecasts. 2023-
2045 is our draft proposed timeframe for price forecast
• Resource dispatch logic highly enhanced by Energy Exemplar, the vendor of Aurora
• Traditional commitment with MOSEK optimizer: 2019 IRP
• Optimized commitment with GUROBI optimizer: 2022 IRP
• Both good; however, optimization with GUROBI is exceptional at finding the least cost solution
in heavily constrained systems
• Solution: meet WECC load at minimum cost, given constraintsElectricity price drivers:
1) WECC resource mix
• Overall net additions in WECC are massive (over 200 GW by 2040) in order to meet load
and reserve requirements
• By 2040, solar + wind + storage meet half of the WECC energy need in the 2022 IRP draft
simulations vs. one third in 2019 IRP
2019 IRP Resource mix (MW) 2022 IRP DRAFT Resource mix (MW)
These charts were obtained from the North America Power & Renewables Service &Tool – WECC,
a product of Wood Mackenzie.Electricity price drivers:
2) Gas price futures
Sumas gas price forecast
• No changes to the methodology
proposed in Roundtable 2021-1
• Updated reference per WM 2020H2.
Gas prices are lower than IRP Update
after 2030 for Sumas and after 2037
for AECO
• Reference case: TC to 2025, 2026
interpolation, 2027 forward WM
• Updated low per PGE-TC Feb. 2021
• Updated High per 2021 EIA-AEO This chart was obtained from EIA, PGE, and from the North America Power and
•
Renewables Service – WECC, a product of Wood Mackenzie
Further updates will depend on
availability of new forecast by this
summerElectricity price drivers:
3) Carbon assumption
• Convenient modeling carbon
regulation as a cost adder to fossil
fuel dispatch cost
• PGE inputs (see also RT 21-1):
o CA: 2019 Integrated Energy Policy
Report (IEPR)
o OR and WA: same as CA starting in
2022
o Rest of WECC: default WoodMac
o Suggestions?
Discuss: use CEC for low and ref;
and Social cost with 2.5% discount
rate for highElectricity price forecast:
Draft reference price for PNW
PNW: reference electricity draft price
o Build-out: default WM 2020H2
o Updated Aurora software
o Adopted GUROBI optimization
o Carbon - 2019 IRP update
assumptions to start with
(need feedback)
o Gas – 2020H2 WM
o Hydro – default WM
o Long-term inflation: 2.10%
o Aurora price = the marginal cost of
the most expensive resource
dispatched in the zoneElectricity price forecast:
Impact of high share of renewables
Why does the new database simulate prices
so differently from HRRR? PNW: comparison of electricity draft price with RRRR and HRRR
o ST: pretty close
o MT: still not that different and within
expected modeling variations
o LT: divergent. HRRR was using:
o Aurora traditional commitment;
o limited curtailment ability;
o and somewhat lower storage
The combo made it difficult for Aurora to find
a solution. Prices suffered from high volatility
as initially uncommitted resources had to turn
on with penalties
o Current RRRR uses Gurobi optimizer,
optimal commit logic, more RES
curtailment, storageElectricity price forecast:
Impact of high share of renewables
Why does the new database simulate prices so different from HRRR?
• Insight: prices depend not only on the resource mix but on the model ability to guess right in committing
the right mix to follow intermittent resources generation
• New database has more flexibility built in
2019 IRP HRRR Resource mix (MW) 2022 IRP DRAFT Resource mix (MW)
These charts were obtained from the North America Power & Renewables Service &Tool – WECC,
a product of Wood Mackenzie.Electricity price forecast:
Evaluate options for price futures
2019 IRP 2022 IRP draft
Three gas futures:
Ref., Low, High Keep
PNW: draft futures simulations
Three carbon price
futures: Discuss
Ref., Low, High
Three hydro futures:
Ref., Low (-10%), Keep
High (+10%)
2 WECC build-out: Ref. ;
high VER Discuss
Consider new futures for
uncertainty analysis:
---
Stress optimization,
Modify VER, load, etc.
Total of 54 futures 27+ futures if we keep the
3 carbon futuresWECC-wide market price: Next steps 1. Ongoing: IRP team continuing to review inputs & assumptions to validate draft results 2. We’re interested in participant feedback on price scenarios and requesting responses by June 24 at IRP@pgn.com 3. Review feedback and determine final price futures Goals: • Share final draft prices with participants • Lock WECC model and generate PNW hourly prices for 2022 IRP
QUESTIONS & DISCUSSION
CAPACITY
ASSESSMENT
KATE VON REIS BARON
ROUNDTABLE 21-3

                      IRP Roundtable 5/27/2021   30
Capacity Assessment – May 2021
Some review and some new information
• References to prior discussions
• Sequoia model intro/review
• Update model: hybrid/storage resources
• Update inputs: load simulation tool
• Capacity need visualization: heatmaps
• Capacity Contribution (ELCC)
• Upcoming to-dos
PGE IRP Roundtable 21-3 31Capacity assessment - review
• RT 20-1: high-level introduction to capacity assessments and the Sequoia model
• RT 20-3: Additional details about Sequoia’s initial structure and dispatch logic
• RT 20-5: Information from a preliminary baseline exercise for Sequoia
• 2019 IRP Update: Sequoia information in Section 3.4.1 and Appendix K
Previous roundtable slides: https://portlandgeneral.com/about/who-we-are/resource-
planning/irp-public-meetings
2019 IRP Update: https://portlandgeneral.com/about/who-we-are/resource-planning
Capacity adequacy means that a system Capacity need is the quantity of
has sufficient resources to meet a additional resources needed to achieve
reliability standard (e.g., a loss-of-load the adequacy standard.
probability of one day in ten years).
32Capacity assessment process
Update Capacity
Update inputs Capacity
contribution
model Need
(ELCC)
load, existing
hybrids, DER resources, new Assessment study
resource options• A loss-of-load probability model that estimates the capacity need
Sequoia of a system and estimates the capacity contribution of potential
incremental resources for long-term planning
capacity • A Monte Carlo module constructs thousands of plausible weeks
assessment model of load and resource conditions (Python)
• Each week is evaluated independently in a dispatch module that
optimizes all dispatchable resources across all hours of the week to
• Improved treatment minimize an objective function (GAMS with Gurobi solver)
of energy-limited • Model has perfect foresight
resources
• Resolution is hourly
• Improved process • Objective function is to minimize the sum of the average unserved
efficiency energy across the week and the maximum unserved energy in a
single hour of the week (not economic dispatch)
• There may be multiple solutions that achieve the same objective
function value, especially in weeks with excess generation (these
may not look “logical”)
• Sequoia expresses capacity need in terms of theoretical perfect
capacity (always available)
PGE IRP Roundtable 21-3 34Monte • Simulation begins by randomly drawing seven sequential days and
identifying the month, weekend/weekday, and weather day types for
Carlo Module each day
• The model currently uses load as a proxy for weather conditions
• For each day of the week, the load is drawn from the distribution of
• Constructs thousands of
days in the assigned day-type/weather bin (a similar process is
weeks of plausible load and applied for resources with hourly profiles such as wind and solar)
resource characteristics
• For hydro with storage, a hydro year is randomly drawn and this,
combined with the month, establishes the hydro conditions
• Assembles deterministic information corresponding to the day types
for each day (e.g., thermal plant ratings) as well as other deterministic
characteristics (e.g., capability to provide contingency reserves)
• Simulates random forced outages for thermal and storage resources
based on inputs for forced outage rates, mean time to repair, and
partial outage distributions
• For many dispatch types, the information is aggregated
35Dispatch • Given the inputs from the Monte Carlo module for a week and the
constraint equations for each dispatch type, resources are
Module optimized to minimize the objective function
• If there aren’t sufficient resources to serve load and contingency
reserves, unserved energy is reported
• Optimizes each week to
• The objective function is to minimize the sum of the average
minimize the objective unserved energy in the week and the maximum unserved energy in
function a single hour of the week
• Optimizes all hours and
resources simultaneously
• Single stage - model has
perfect foresight
36• Hybrid and storage resource dispatch (see
Update next slide)
Model • DER resource dispatch (upcoming)
• Additional considerations (e.g.,
functionality to consider impact of
emission constraints, functionality to
improve user operation and efficiency,
improvements to hydro characterization,
improvements to output reporting)
37Update model: Hybrid/storage resources
• IRP Team is finishing improvements
to the modeling of hybrid resources
in Sequoia
• Accommodates DC and AC storage DC Plant Plant
resources paired with generation Storage POI
DC AC
(DC and/or AC) and/or grid
charging
• Will allow for modeling of daily
cycling limitations, grid charging Solar Wind Simplified view for illustration
limitations
• Hybrid logic used for stand-alone
storage resources
• Hybrid/storage resources no longer
aggregated
38• Econometric load forecast
Update • Baseline Portfolio (contracts, existing
Inputs resource updates, DER, regional capacity)
• New resource options (supply-side,
incremental EE and DER)
• Information for Low and High Need
Futures
• Information for sensitivities
39Update inputs: Load simulation tool
• One of the foundational pieces of
input data for a resource adequacy Improved learning and calibration by
customer revenue class
model is the hourly econometric
load forecast with weather
variation
Improved weather simulation and
• The Load Simulation Tool is a ability to update weather information
Python based machine learning
model developed for PGE by the
Cadmus Group for creating hourly Improved efficiency for updating to new
profiles of load response to load forecasts
weather
• IRP Team will be working to
incorporate the output into
Sequoia for the next IRP
IRP Roundtable 5/27/2021 40• Assess capacity needed to
Capacity achieve reliability standard in
Need each year for each Need
Futures and for sensitivities
• Examine outputs to learn about
nature of need
41Capacity need 2019 IRP Update LOLE Heatmap for 2025
visualization: 1
1 2 3 4 5
Month
6 7 8 9 10 11 12
LOLE heatmap 2
3
4
5
6
7
• Loss-of-load expectation (LOLE) 8
9
heatmap is useful for considering 10
Hour Ending
the seasonal and diurnal nature of 11
12
when the system is forecast to have 13
higher probability of capacity 14
15
shortages 16
17
• Does not differentiate by magnitude 18
19
• Additional complexity can be 20
21
viewed with Sequoia 22
23
24
42Additional views Percentage of hours with greatest need by month
(2019 IRP Update, 2025)
1 2 3 4 5 6 7 8 9 10 11 12
31% 7% 0% 0% 0% 0% 2% 23% 2% 0% 2% 34%
• While images do not capture the full 6 7 8 9
complexity of the analysis, Sequoia 1
2
0
0
0
0
0
0
0
0
allows for additional views that 3 0 0 0 0 Count of summer
4 0 0 0 0
provide more information about the 5 0 0 0 0
hours with greatest
need by
nature of the capacity need 6
7
0
0
0
0
0
0
0
0 month/hour
8 0 0 0 0
• Can examine the seasonal and 9 0 0 0 0
(2019 IRP Update, 2025)
10 0 0 0 0
diurnal nature of the hours of 11 0 0 0 0
greatest need 12
13
0
0
0
0
0
0
0
0
14 0 0 3 0
• We are working to determine 15
16
0
0
0
2
42
4
0
7
additional views that may be useful 17 0 4 12 3
18 0 4 41 11
and possible with Sequoia. We 19 0 9 116 18
appreciate your feedback on what 20
21
1
0
14
6
77
205
7
2
you would find informative! 22
23
0
0
1
0
39
0
1
0
24 0 0 0 0
43• For test year, prepare marginal
ELCC study ELCC curves for candidate new
capacity contribution resources
• Examine portfolio effects
• ELCC values by year (Order No.
21-129) – discuss options with
participants
44Upcoming capacity to-dos • Complete improvements to hybrid modeling • Examine options for improved treatment of dispatchable DER, options for considering availability impact of emission constraints • Update inputs, including implementing load simulation tool, incorporating new DER study, and adding new candidate supply-side resources • Coordinate with participants to prioritize requests for analysis, including additional areas of ELCC analysis
QUESTIONS & DISCUSSION
PORTFOLIO REQUESTS
FROM PARTICIPANTS
SETH WIGGINS
ROUNDTABLE 21-3

                     IRP Roundtable 5/27/2021   47
PORTFOLIO REQUESTS
• Our portfolio optimization model ROSE-E has flexibility to evaluate any specific
resource/size/year combination
For example, we could estimate the portfolio effects of adding 235 MW of SE Washington
wind in 2036 and/or 150 MW of 6-hr batteries in 2026
In the 2019 IRP, we used this capability to evaluate the size and timing of 16 different
renewable additions MW/year combinations
Carbon constraints
• We are open to any suggestions for portfolio questions to be evaluated
• Please contact us (email: IRP@PGN.com)
IRP Roundtable 5/27/2021 48QUESTIONS & DISCUSSION
Submit feedback on WECC-wide market price and IRP uncertainties
             by June 24

             By August roundtable PGE will provide final draft of WECC-wide market
             price to participants
NEXT STEPS   A recording from today’s webinar will be available on our website
             within a week
             https://portlandgeneral.com/about/who-we-are/resource-planning/irp-
             public-meetings

                                                                           50
THANK YOU CONTACT US AT: IRP@PGN.COM
ATTACHMENT A: ACRONYMS
CEC: California Energy Commission                             LUCAS, ROM, PGE-zone, Sequoia, ROSE-E, and AURORA:
                                                              models PGE uses for IRP analysis (see Appendix I: 2019 IRP
DB: database                                                  Modeling Details from the 2019 IRP)
DER: distributed energy resource                              MOSEK: a software package for the solution of linear,
EIA AEO: energy information administration annual energy      mixed-integer linear, quadratic, mixed-integer quadratic,
outlook                                                       quadratically constraint, conic and convex nonlinear
                                                              mathematical optimization problems.
ELCC: effective load carrying capability
                                                              POI: Point of Interconnect
GAMS (General Algebraic Modeling System): a
programming language used for optimization programs           PNW: pacific northwest
GUROBI: a commercial optimization solver for linear,          RRRR: reference case price future
quadratic, quadratically constrained, mixed integer linear,   RT: roundtable
mixed-integer quadratic, and mixed-integer quadratically
constrained programming.                                      WECC-wide: Western Interconnection (today- the
                                                              generators, transmission lines, and other facilities that
GW: gigawatt                                                  comprise the Western Interconnection electrical grid,
HRRR: high renewable WECC buildout                            which is a NERC region)
IRP: integrated resource plan                                 WM: Wood Mackenzie
                                                                                                  IRP Roundtable 5/27/2021   52
You can also read