Influencing the SPR for storm surge events - Report - A cross-border XBeach application
←
→
Page content transcription
If your browser does not render page correctly, please read the page content below
Report

Influencing the SPR
for storm surge events
A cross-border XBeach application
Date: 31 May 2021
Status: final

1
Report

Colophon

Published by   Interreg North Sea Region VB – Building with Nature

Authors        Simon Hillmann (NLWKN)
               Karl-Søren Geertsen (DCA)
               Ellen Quataert (Deltares)
               Rena Hoogland (Rijkswaterstaat)
               Bjørn Frederiksen (DCA)

Contact        Rena Hoogland (Rijkswaterstaat)
Phone          +316 21 47 90 41

E-mail         rena.hoogland@rws.nl
Date           31 May 2021
Status         final
Version        2.0

2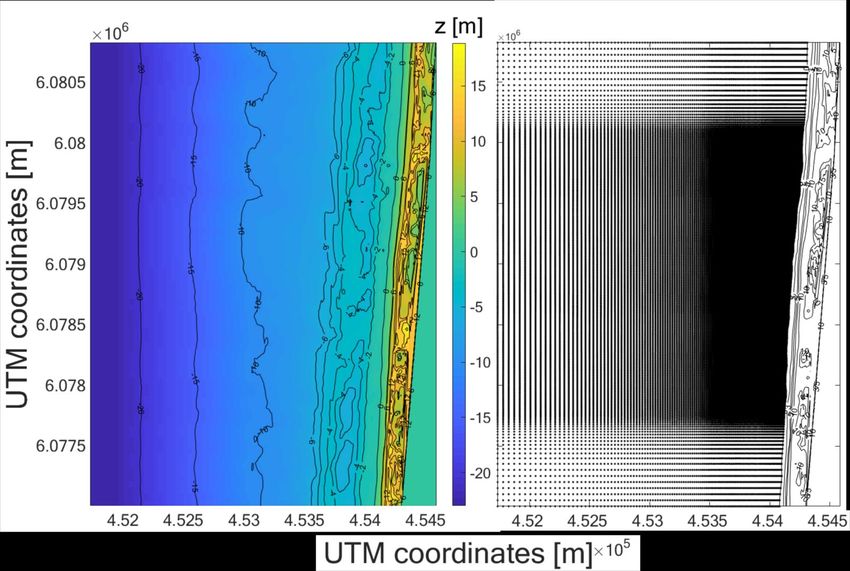
Report
Table of content
Table of content ...................................................................................................................................... 3
1 Introduction..................................................................................................................................... 5
1.1 Background.............................................................................................................................. 5
1.1.1 Interreg NSR VB Building with Nature project ................................................................ 5
1.1.2 Goal of the current study ................................................................................................ 5
1.2 Research questions ................................................................................................................. 6
1.3 Reading guide .......................................................................................................................... 6
2 Methodology ................................................................................................................................... 7
2.1.1 General approach ............................................................................................................ 7
2.1.2 Quantification of the effects on dune safety .................................................................. 8
3 Site description and storm measurements ................................................................................... 10
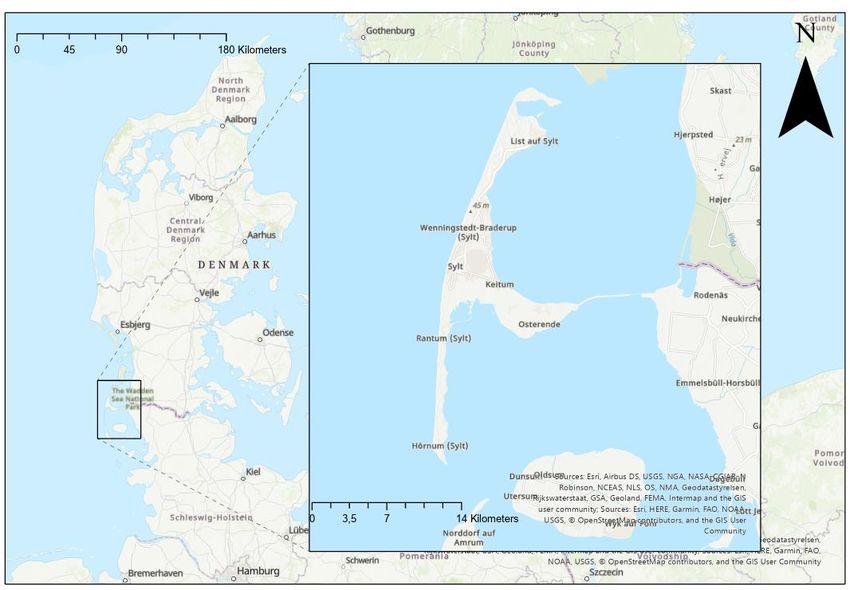
3.1 Langeoog, Germany .............................................................................................................. 10
3.2 Sylt, Germany ........................................................................................................................ 11
3.3 Krogen, Denmark................................................................................................................... 15
4 Model validation ........................................................................................................................... 18
4.1 Model description ................................................................................................................. 18
4.2 Langeoog, Germany .............................................................................................................. 19
4.2.1 Model setup and methodology ..................................................................................... 19
4.2.2 Results ........................................................................................................................... 20
4.3 Sylt, Germany ........................................................................................................................ 24
4.3.1 Model setup and methodology ..................................................................................... 24
4.3.2 Results ........................................................................................................................... 26
4.4 Krogen, Denmark................................................................................................................... 29
5 Scenario modelling ........................................................................................................................ 30
5.1 Methodology ......................................................................................................................... 30
5.1.1 Scenario selection.......................................................................................................... 30
5.1.2 Scenario creation Langeoog .......................................................................................... 31
5.1.3 Scenario creation Krogen/Sylt ....................................................................................... 34
5.2 Scenario results Langeoog ..................................................................................................... 38
3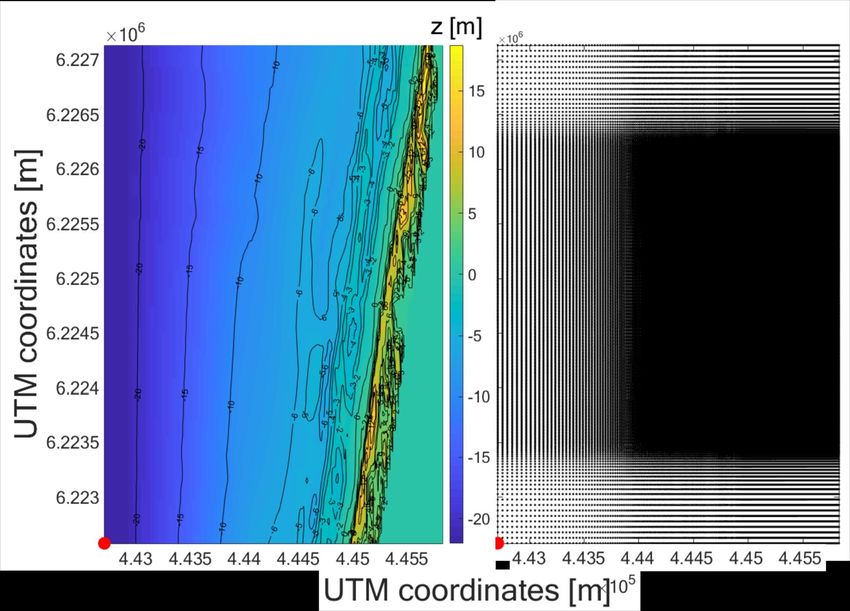
Report
    5.3      Results Sylt ........................................................................................................................... 43
    5.4      Results Krogen ....................................................................................................................... 51
    5.5      Synthesis of the results ......................................................................................................... 58
6     Discussion ...................................................................................................................................... 60
7     Conclusions.................................................................................................................................... 62
8     References ..................................................................................................................................... 63
Appendix A – XBeach settings ............................................................................................................... 65
Appendix B - Sylt validation, all profiles ................................................................................................ 66

4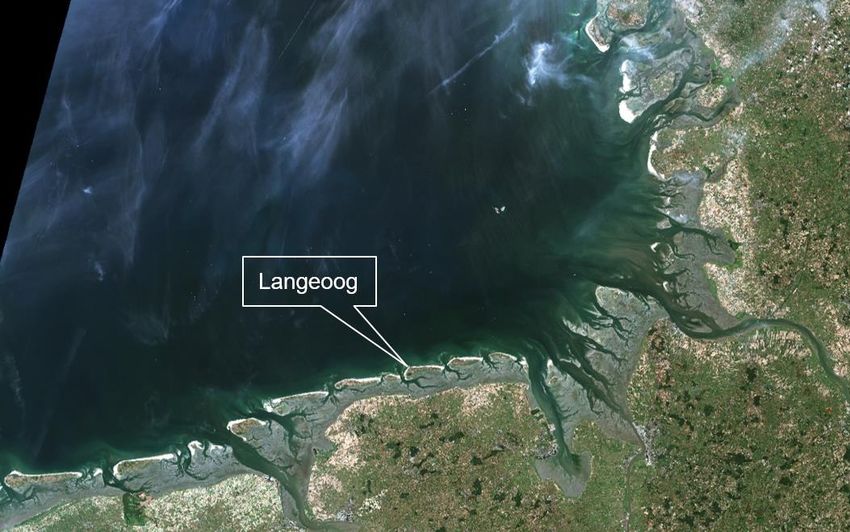
Report
1 Introduction
1.1 Background
1.1.1 Interreg NSR VB Building with Nature project
Building with Nature (BwN) is a phenomenon already known for several decades in which natural
forces are used to build, construct or maintain a human intervention. Building with Nature is also
known as Natural Flood Management (UK) or Natural and Nature-Based Solutions (USA). In this
interregional North Sea project experiences with Building with Nature (BwN) in different countries are
shared.

The Interreg VB North Sea Region Building with Nature project (2015-2021) has the overall aim, to
make coasts, estuaries and catchments of the North Sea Regio (NSR) more resilient to climate change
by both applying and learning from the implementation of Building with Nature (BwN) measures. The
project is taking place in the North Sea Region, involving 15 partner organisations from Norway,
Sweden, Denmark, Schleswig-Holstein (DE), Niedersachsen (DE), the Netherlands, Belgium and
Scotland (UK). The overall objective of the BwN project is to make coasts, estuaries and catchments of
the North Sea Region (NSR) more adaptable and resilient to the effects of climate change. The main
goal to achieve during the time frame of the BwN project is to create a well-documented evidence
base, by transnational knowledge exchange, that allows for policymakers and asset owners to
incorporate Building with Nature / Nature Based Solutions and principles in future decision-making
processes.

1.1.2 Goal of the current study
Within the BwN project the Source-Pathway-Receptor (SPR) approach is used to understand where
sediment originates from (the source), what the general net pathway is and how this affects the
receptor (i.e. a coastal function such as safety, recreation etc.). This will provide insight into the smart
application of nature-based solutions in the light of the total system change, such as sea level rise.

In the Work Package 3 (WP3) prolongation of Interreg BwN (June 2020 to June 2021), the primary
objective of the study is to assess the effect of Building with Nature techniques on influencing the SPR,
focussing on dune safety during storm surge events. In this study we will only investigate the main
Building with Nature technique for sandy coasts: nourishments. The direct impact of nourishments on
dune safety will be tested for different nourishment types and designs under storm conditions. As
shown in Wilmink et al. (2021), nourishments can change the coastal profile shape on the long term,
which can therefore indirectly affect the dune safety during storm conditions. This effect is included
for a couple of cases, but not investigated in detail.

The impact of SLR on the dune safety is also investigated in order to make a first assessment of how
future coastal shapes will affect the dune safety. In this SLR-scenario the long-term effect of a
structural nourishment strategy is incorporated.

5
Report
1.2 Research questions
The main research question is: "How can Building with Nature techniques, as nourishments, affect dune
safety during storm events?"

To answer the main research question, four sub questions are defined:

    1) Can XBeach be used as a tool to assess the impact of Building with Nature techniques on dune
       safety?
    2) What scenarios (e.g. nourishment placement, design, SLR) can be set up to assess the direct
       impact on dune safety due to storm surges?
    3) How can nourishments affect the dune safety?
    4) How will future climate scenarios in combination with different adaptation strategies affect
       the dune safety?

1.3 Reading guide
In Chapter 2 the overall methodology for this study is described. Chapter 3 presents the three study
sites that were selected, and in Chapter 4 the model (XBeach) is validated for the storm measurements
of these study sites. In Chapter 5 the validated model then subsequently used to investigate dune
safety under a set of scenarios reflecting different nourishment types, designs, SLR-conditions and
adaptation strategies. The report is completed with a discussion on the limitations of the used
methodology and putting the results in perspective.

6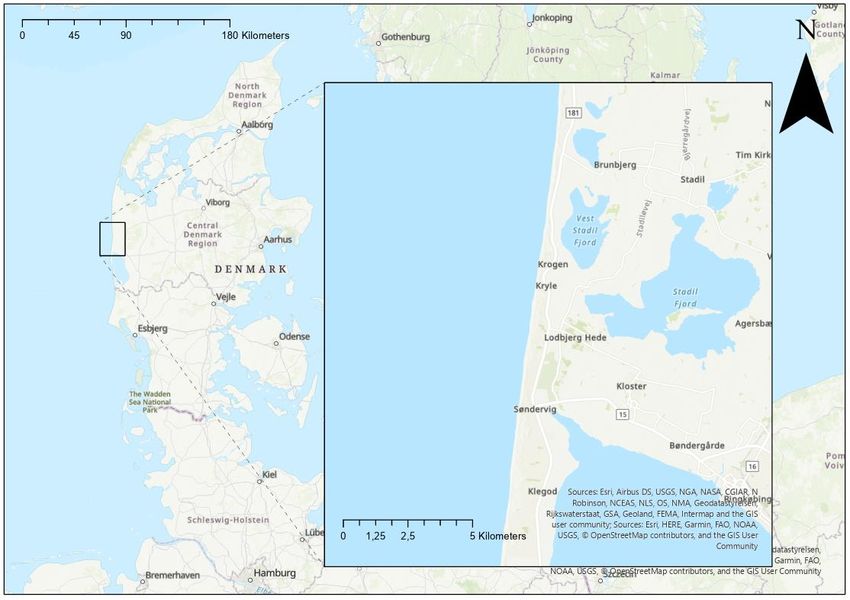
Report
2 Methodology

2.1.1 General approach
Building with Nature techniques aim at influencing the Source-Pathway-Receptor (SPR) for long term
sediment processes, but can also have an effect during storm surge events (see Figure 2-1). To assess
the impact of nourishments on dune safety during storm conditions, the XBeach model is used in this
study. XBeach is a numerical model for wave propagation, long waves and mean flow, sediment
transport and morphological changes of the nearshore area, beaches, dunes and back-barrier during
storms, especially focusing on dune erosion during storm conditions. XBeach will be used to assess
how (for each selected lab) the Source Pathway and Receptor for water and sediment can be
influenced in such a way that benefits the receptors (e.g. flood safety or dune resistance, see Figure
2-2) can be achieved. The aim is to relate the change in dune strength, i.e. resistance against erosion
(delta R, in Figure 2-2) to storm surges as a function of nourishment and natural morphological
development scenarios. Three tasks are defined:

1) Select and collect observations of surge events for three study sites
   For Langeoog (Germany), Sylt (Germany) and Krogen (Denmark) measurements on morphological
   changes have been conducted after a storm event, and are used in this study.

2) Validation of the XBeach model
   The XBeach model is validated using the collected measurements on study sites Langeoog and
   Sylt. The XBeach model setup applied for Sylt is the Danish calibrated and validated model,
   validated in Vedersoe, Heatherhill, Havstokken and Marielyst in Denmark. The model is tested by
   comparing the observed morphological changes of the dune and beach to the model predictions.
   Both one-dimensional (1D) transect models and two-dimensional (2DH) area models are setup and
   tested. Goal of this task is to gain confidence in XBeach’ capability to reproduce the storm impact
   on dunes, so it can be used for subsequent task 3.

3) Testing scenarios for the strategic placement of nourishments to assess the (in)direct effects on
   dune safety due to a storm event
   This task involves simulating a set of scenarios to test the impact of Building with Nature
   techniques on dune safety during storm conditions. A set of scenarios are selected based on
   different nourishment placement or design, morphological configuration and conceptional climate
   change profile developments. These scenarios are then applied for all three study sites to cover a
   range of site-specific conditions. The goal of this task is to support our understanding of the effects
   of nourishments on coastal behaviour during storm conditions.

Model setup, runs and analysis are performed by DCA for the Sylt and Krogen cases and by NLWKN
and Deltares for the Langeoog cases.

7
Report

Figure 2-1 flowchart Source Pathway Recepter approach for sediments (nourishments)

Figure 2-2 Example of SPR approach for flowchart applied to dune resistance storm surges

2.1.2 Quantification of the effects on dune safety
The primary goal of this study is to assess the change in dune resistance (ΔR) during storm conditions
using the XBeach model. The impact on the dune resistance is quantified using two morphological
indicators: dune erosion volume and dune retreat.

The dune erosion volume is defined as the difference in volume above a vertical datum per meter
alongshore between the initial bed level and the bed level at a given time. The maximum storm surge
water level is applied as lower vertical datum for this computation, see Figure 2-3.

The dune front retreat is the landward migration of the dune front. It is defined as the horizontal
displacement at a given reference height in the considered time period. In this study the dune retreat

8
Report
is determined for four reference levels (i.e. MSL, dune foot, dune face and upper dune face, see Figure
2-3) to make a complete assessment of the profile development.

Figure 2-3 Morphological indicators used to assess and compare the model results.

9
Report
3 Site description and storm measurements

3.1 Langeoog, Germany
The island of Langeoog is one of seven inhabited barrier islands situated along the East Frisian German
North Sea coast (Figure 3-1). A detailed description of the study site Langeoog can be found in the
National Analysis Report for Lower Saxony of the NLWKN (Niedersächsischer Landesbetrieb für
Wasserwirtschaft, Küsten- und Naturschutz; Lower Saxony Water Management, Coastal Defence and
Nature Conservation Agency) [Interreg VB NSR BwN – NLWKN, 2021].

Figure 3-1 Langeoog (Copernicus Sentinel 2-Image 06.08.2018)

From 5 to 7 December 2013 storm ‘Xaver’, referring to the name of the low-pressure system, caused
an extreme storm surge and significant dune erosion. High resolution measurements of pre- and post-
storm bathymetry were collected and Langeoog is therefore selected as a case study for XBeach
validation in this study.

A maximum storm surge water level of NHN + 3.95 m was observed at Langeoog gauge station (Figure
3-2) [WSA EMS-NORDSEE]. For the wave input in the XBeach model, a SWAN model was used, created
in the EasyGSH project (Plüß et al., 2020 - EasyGSH-DB (baw.de)). The SWAN-datapoint used for XBeach
input is located around 10 km in distance from the island and at around 20 m depth. Measurements
from the platform FINO1 are compared to the SWAN model regarding hydrodynamic forcing conditions
(Figure 3-2).

The used bathymetry for creating the model grid is based on bathymetric and LIDAR-photogrammetric
measurements by NLWKN and BSH respectively.

10
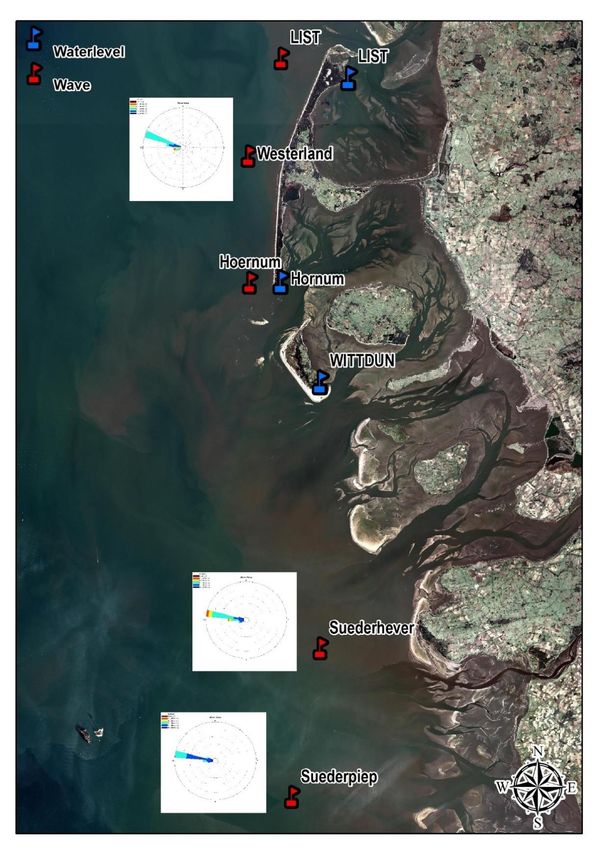
Report

Figure 3-2: Comparison of measured wave data at FINO1-platform (a-d) (BMWi, PTJ) and SWAN model by EasyGSH-project
(a-c) (www.easygsh-db.org, https://www.doi.org/10.18451/k2_easygsh_1) and WSA Ems-Nordsee (d)

3.2 Sylt, Germany
The island of Sylt is the northern most of the German Frisian Islands in the Wadden Sea, bordering
Denmark to the north (Figure 3-3). It has ~55 km coast exposed to the North Sea, and has an estimated
22.000 inhabitants, of which the majority (~10.000) lives in main town of Westerland, which lies
directly exposed to the North Sea, thereby creating a challenge with regards to coastal retreat.

Sylt sees an estimated 1 million m3 sediment leaving the west coast annually, with the ends (north and
south) facing the highest erosion rates. The natural dune retreat rate is 1 to 4 m per year along the
west coast of Sylt. Historically the coast has been reinforced with groynes, sea walls, revetments and
tetrapod's, all of which fights the symptoms of coastal erosion but not the driving processes.

The first nourishment took place in 1972 with an estimated volume of 1 mio. m3, and Sylt has
subsequently been nourished several times. Until 1996 purely fed on the beach, after which bar- and
shoreface nourishments have been carried out with varying effect.

 A detailed description of the study site Sylt can be found in the National Analysis Report for Sylt by
LKN.SH (Landesbetrieb für Küstenschuts, Nationalpark und Meeresschutz Schleswig-Holstein;The
Agency for Coastal Defence, National Park and Marine Conservation, Schleswig Holstein) [Interreg VB
NSR BwN - LKN-SH, 2019]

11
Report

Figure 3-3 Overview of the model site Rantum on island of Sylt.

        The forcing conditions used for the Sylt model are based on a storm on the 3rd of December
        1999. The storm was named Adam (or “Decemberorkanen”) in Denmark, Orkan Carola in
        Sweden or Cyclone Anatol given by the Free University of Berlin. The hurricane saw sustained
        winds of 146 km/h, and maximum water level at Westerland on Sylt of 3.45 m and wave heights
        exceeding 6 m.

        The hydrodynamic data was received from The Agency for Coastal Defence, National Park and
        Marine Conservation, Schleswig Holstein (LKN.SH) and consists of measured water levels and
        wave climate during the 1 year period from May 1999 to May 2000 for different measurement
        sites as seen from Figure 3-4. A complete set of forcing conditions, water level, significant wave
        height, peak wave period and peak direction was achieved by combining measurements from
        Westerland with measurements from List. All measurements from List are adjusted for time
        difference and vertical displacements in all peak levels to match Westerland water levels.
        Position of water- and wave measurements can be seen in Figure 3-4.

        The storm duration is chosen to 12 hours prior and post the peak water level, in total 25 hours.
        The forcing conditions are linear interpolated to match a sea state of 15 min throughout the
        storm. Water level and wave data can be seen in Figure 3-5 and Figure 3-6.

12
Report Figure 3-4 Overview of available data for the Sylt model. 13
Report

Figure 3-5 Forcing conditions of the December 1999 design storm applied for the Sylt model

Figure 3-6 Wave rose of the December 1999 design storm applied for Sylt.

14
Report
3.3 Krogen, Denmark
Krogen is situated on the west coast of Jutland, which is a micro tidal wave dominated sandy coastline.
It sees high variations of the coastline and is quite dynamic. Krogen is not a town, but the name of the
road which runs through the area. The location of Krogen and a close-up of the area can be seen in
Figure 3-7.

A WWII bunker at Krogen was protected with a short rock revetment in 1944, but it collapsed in a
storm in 2007. A comparatively low 1 m chronic erosion per year occurs at Krogen, but severe erosion
during a storm surge of 46 m has been recorded just 10 km north of it. To compound this, WWII era
bunkers still exists in the dunes, which tends to exacerbate the acute erosions problem, when they
eventually topple from the dunes onto the beach. The coastal erosion at Krogen has since the 1990’es
been compensated for, by regular shoreface and beach nourishments

This paired with narrow dunes and vast, low lying hinterlands makes for a great potential for flooding.
The hinterlands of Krogen are varied in use; it contains a lot of farmland, towns, industry and many
vacations homes, making flooding potentially very costly and potentially dangerous.

A detailed description of the study site Krogencan be found in the "Shoreface Nourishment effects- An
analysis of the 2016 nourishment at Krogen by DCA (Kystdirektoratet; Danish Coastal Authority)
(Interreg VB NSR BwN – DCA, 2020)

Figure 3-7 Overview of the model site of Krogen.

15
Report
The forcing conditions used for the Krogen model are based on a storm on the 8th of January 2005. The
storm was named Gudrun in Denmark (or “Januarorkanen”), Norway and Sweden, Cyclone Erwin given
by the Free University of Berlin. The water level data was measured at Ferring, roughly 40 km north of
Krogen. The maximum storm surge level was measured to 313 cm during the storm. The wave data
used is measured at Nymindegab, which is approximately 40 km south of Krogen. The maximum wave
height was measured to exceed 6 m during the storm. Based on the Danish national storm surge
statistics, a design storm of 100 years return period is determined for Krogen by linear interpolation
between a 100-year water level estimated for Thorsminde and Hvide Sande. The 100-year storm surge
level is determined to 290 cm for Krogen. All measured water levels are adjusted, such that the peak
of the design storm matches the 100 years storm surge level for Krogen. The wave conditions are kept
as measured.

Water level and wave data for the synthetic design storm for Krogen can be seen in Figure 3-8 and
Figure 3-9.

Figure 3-8 Forcing condition for the 100 years design storm applied in the model for Krogen

16
Report

Figure 3-9 Wave rose of the 100 years design storm applied for the model of Krogen.

17
Report
4 Model validation

In order to use XBeach to assess the effects of nourishments on short-term reduction of dune erosion
due to storm events, the accuracy of the model must be evaluated. In this chapter, XBeach models are
setup and validated for the three study sites in Germany and Denmark. The XBeach predictions on
dune erosion are compared to the observations of a storm event, as described in Chapter 2.

4.1 Model description
Infragravity waves dominate nearshore hydrodynamics on dissipative beaches under storm conditions
and play a key role in the dune erosion process. XBeach is a process-based 2D numerical model for
the nearshore and coast (Roelvink et al., 2009, 2018), and is specifically developed to predict dune
erosion during extreme events. The XBeach surfbeat mode resolves the variation of short-wave energy
on the wave-group scale, which drives lower frequency motions (infragravity waves) that are fully
resolved in the model. The hydrodynamic processes are fully coupled with sediment transport,
avalanching of dune faces and the resulting bed level changes. XBeach model skill has been
demonstrated for dune erosion, overwash and breaching (e.g. McCall et al., 2010 and van der Lugt et
al., 2019).

Within this study two different versions of the XBeach software have been applied. For the Sylt and
Krogen study sites the XBeachX release version has been used as for the Krogen site a calibrated
XBeach model already existed (Kystdirektoratet, 2021). For the Langeoog case the BOI version of
XBeach (1.23.5741) has been used. This is first beta-release version of the XBeach model for (internal)
use in the BOI program, including all code developments made in the BOI Zandige Keringen Fase 0
project. The BOI project is a program of Rijkswaterstaat to develop a new methodology for the dune
safety assessment in the Netherlands of 2023. It focusses on the development and validation of the
XBeach model and a redefinition of the assessment methodology using the new modelling approach.
The Langeoog case study was selected to be tested with the beta-release BOI version and
corresponding settings.

As two different versions of XBeach are used, both models applications were also calibrated to
different model settings. For the Langeoog case, the BOI settings as derived in Deltares (2020a) were
used. For the Sylt and Krogen cases, the settings as derived in (Kystdirektoratet, 2021) are used. In
Table A1 in Appendix A an overview of the most relevant XBeach settings are listed for both model
applications. Other free model parameters were kept at their default values.

18
Report
4.2 Langeoog, Germany
4.2.1 Model setup and methodology
For the Langeoog island in Germany both a 2D and 1D transect models are setup and validated for the
2013 storm “Xaver”. The 2D model domain is 4km in longshore and 4.5km in cross-shore direction, and
covers the area where the storm resulted in significant dune erosion. Two months prior to the storm,
October 2013, a beach nourishment was deployed on the North-Western part of the island (km 4.005
to 4.020 in Figure 4-1 left panel). From the 2D-model domain 6 transects are used to setup 1D XBeach
models, of which transect A to C are located at the beach nourishment and transect D to F are located
East of the nourishment.

A cross-shore varying grid is setup for both 1D and 2D models, with grid sizes varying from 2m on the
beach/dune and 30m offshore. For the 2D model a uniform alongshore grid size of 5m was applied.
The bathymetry is created using a combination of the measurements of the shoreface in August 2013
and beach/dune (dry area) on October 18th, 2013. The shoreface of Langeoog is wide and shallow shelf
due to the ebb-tidal delta. Using the complete shoreface data would result in a large model domain in
the cross-shore direction, as for XBeach the offshore boundary needs to be at deep water to avoid any
boundary effects in the model results. Therefore, the model bathymetry is cut-off at -12m and
extended with a steeper slope to an offshore depth of -23m, based on the criteria as described in
Deltares (2020b) and shown in Figure 4-1 right panel. Forcing conditions are based on observations
(tidal + surge elevation) and SWAN model simulations (wave conditions, see section 3.1). The models
are run for a total simulation period of 30h, indicted by the red line in Figure 4-2.

The model results are validated using the topography measurements of the beach and dunes, collected
on December 13th, 2013 for the area around the beach nourishment and April 30th, 2014 for the Eastern
part of the island. The modelled bed level changes of the beach and dunes are compared to the
observations.

Figure 4-1 Model bathymetry Langeoog 2D model, including locations of the 1D transect models A to F.

19
Report

Figure 4-2 Forcing conditions used for the XBeach model of Langeoog. Simulation period is shown in red.

4.2.2 Results
Measurements of the pre- and post-storm topography (Figure 4-3) show that a large part of the beach
nourishment was eroded by the storm. Also notable is that the dune erosion in the measurements is
larger for the eastern area without beach nourishment. The predictions by the XBeach 2D model are
shown in Figure 4-3 (right panels), and show that XBeach underestimates the erosion of the beach
nourishment. But the larger dune erosion on the eastern side of the nourishment is well reproduced
by the model.

In Figure 4-4 the resulting profiles are shown in more detail for transects A to F for both 2D and 1D
models. Transects A to C are located at the beach nourishment, and show that XBeach underestimates
the erosion of the beach nourishment, and subsequently underestimates the dune erosion and retreat
landward of the nourishment. For transects D to F it can be concluded that XBeach predicts the post-
storm dune profile well for the area East of the nourishment. In addition, the 2D and 1D model results
correspond well and show no significant deviations.

The storm impact is quantified by calculating the dune erosion/deposited volume and retreat distances
and            its            alongshore           variation          is          shown             in
Figure 4-5. Again, it is visible that the erosion volume and retreat distances are larger east of the
nourishment, and is well represented by the 1D and 2D models. Also, is becomes clear that the model
underestimates the erosion of the beach nourishment and subsequent dune retreat, but mostly only
for the eastern 2/3 part of the nourishment. In the pre-storm measurements (and thus input bed level

20
Report
          for the model) it is visible that the beach nourishment is higher compared to the rest of the
          nourishment.

          An possible explanation for the underestimation of the erosion of the beach nourishment is that the
          pre-storm observations were collected on the day the beach nourishment was placed, October 18th
          2013, almost two months prior to the storm event on December 6th. In that period the shape of the
          beach nourishment may have changed due to natural processes (e.g. aeolian- or wave-induced).
          Therefore, the underprediction of the erosion of the beach nourishment may be due to the initial
          shape of the beach nourishment in the input model bathymetry, as that may have been different (less
          steep) in reality.
Y [km]
 Y [km]
   Y [km]

                                                       Dune erosion

                                                                                                            Dune erosion

                                          X [km]                                                   X [km]
          Figure 4-3 Observed (left) and modelled (right) bed levels. Bottom panels show the difference between post and pre bed levels,
          where blue indicates erosion and red accretion.

          21
Report Figure 4-4 Pre-(dotted line) and post (solid line)-storm bed levels for transects A to F. Measured data is shown in black (2013 data) and grey (2014 data), XBeach results for the 1D model in orange and 2D model in green. 22
Y [km]

                                                              Report

                                           X [km]

 Figure 4-5 alongshore variation in dune erosion volume (top), deposited volume (middle) and retreat distance at maximum
 storm surge level + 3.95m (bottom). The grey area denotes the location of the beach nourishment. Measured values are
 represented by the black lines, modelled 2D results by the green line and modelled 1D results by the orange dots.

 23
Report 4.3 Sylt, Germany Model validation work on Sylt, is conducted by applying a calibrated and verified Danish XBeach model setup as described in (Kystdirektoratet, 2021). The Danish model setup is calibrated and validated to reproduce the storm erosion, during a storm on three different coasts, west coast, east coast and north coast, representing levels of coastal exposure ranging from low to very high. The model validation work on Sylt, will test if the Danish XBeach model setup is able to reproduce the storm erosion on Sylt. 4.3.1 Model setup and methodology The model validation of Sylt is performed in 2D, based on 82 coastal transects, with 50 m in between each transect, measured during a beach-shoreface measurement campaign in May 05, 1999 at Rantum and composes the before storm bathymetry. The model results are compared with the post storm observation, measured 13 days after the storm, December 16, 1999. Within the timespan, of nearly 6 months, between the measurements are collected before and after the storm, it is uncertain which process the beach and shoreface undergoes and is not covered by the XBeach simulation. Based on retreat maps, see Figure 4-6, generated from the before and after storm observations, it seems that sediment has deposited significantly along the coast in all three morphological reference levels (3 m, 5 m and 7 m) between May 1999 and December 1999. 24
Report

Figure 4-6 Retreat maps for the morphological reference levels dune foot (3 m), dune face (5 m) and upper dune face (7 m) determined from
observation from 05 May 1999 (pre storm) and 16 Dec. 1999 (post storm).

The 2D model bathymetry is covering most of the measured transect lines, where a rectilinear 2D grid,
with cells sizes varying along the x-direction. The largest cells are located offshore and minimum cell
sizes closest to the shore, as seen from Figure 4-7. Further, the grid varies along the y-direction with
largest cell sizes along lateral boundaries and minimum cell sizes in the centre of the model. In total
414 cells in x-direction and 280 cells in the y-direction, with cell sizes ranging from (45x50) m to (2x10)
m in the centre of the model closest to the beach, as can be seen from Figure 4-7.

25
Report

Figure 4-7 2D model setup for Sylt. The bathymetry is plotted with colour plot and contour lines are added (left). Further, the computational
resolution of the model is represented by a plot of the location of computational cell centers (right)

To lower the number of cells and decrease computational time of the model, the bathymetry was cut
of close to the depth of closure (–11 m) and extended to sufficient deep water (–23m) with a slope of
1/50 m.

4.3.2 Results
To assess the performance of the XBeach model, the erosion and the deposited volumes above 3 m
reference contour levels are determined, along the coast, for both the model and observations and
compared in Figure 4-8. Further the retreat distance along the coast, is determined based on model
result and observation. As seen From Figure 4-8 and Figure 4-9, sand is deposited during the storm,
based on the pre and post observational coastal data (black line), above the 3 m (NN +3 m) contour
level, while XBeach predict no deposition of sand (green line) above this reference level during the
storm. It is to the author, not clear how this large deposition volume above the 3 m (NN +3 m) contour
level occurs during the storm. Based on the determined erosion volumes and retreat distances, XBeach
predicts somehow the longshore variations on Sylt.

26
Report

Figure 4-8 Map of coastal state indicators as the erosion volume, the deposited volume and the retreat distance related to NN + 3 m along
the coastline. Transect numbers are listed along the y-axis of the colour plot of the interpolated raw observational data to indicate where 1D
comparison transects as shown in Figure 4-9 are located.

Based on the map of the coastal state indicators, Figure 4-8, three transects are selected to visualize
the difference between pre and post observational coastal data and the XBeach simulation and in
Figure 4-9. For the results of all transects, see Appendix B.

27
Report

Figure 4-9 Plot of measured transect 27, 37 and 76 before the storm (black line) and after the storm (dashed black line). XBeach post storm
profile is included, as the green line, to assess the performance of the model. Transects numbers shown link to the transect numbers from
Figure 4-8. Results for all transects are shown in Appendix B.

28
Report
4.4 Krogen, Denmark
Based on the XBeach work in Denmark, (Kystdirektoratet, 2021), the Danish XBeach model was
calibrated and validated in a coastal area (Vedersoe) close to Krogen, hence the Danish XBeach model
set-up is assumed applicable for Krogen and therefore Krogen is not a validation case. Krogen is
included as the Danish study site in this investigation of how to influence the pathway to enhance the
safety of the receptor. The Krogen XBeach model, is generated from coastal transect measurement
collected in autumn 2020. The model bathymetry is based on 25 coastal transects with 100 m in
between. The coastal transects are merged with a national terrain model to generate the inland
elevation.

The 2D grid is generated using the same procedure as for the Sylt model grid and consists of the same
grid resolution of (45x50) m as maximum cell size and (2x10) m as minimum cell size in the centre of
the model closest to the beach, as can be seen from Figure 4-10. In total, the model grid of Krogen
consist of 591 cells along the x-direction and 330 cells along the y-direction.

The bathymetry was cut at the depth of closure and extended to sufficient water depth with a slope
of 1/50 m to increase computational times.

Figure 4-10 2D model setup for Krogen. The bathymetry is plotted with colour plot and contour lines are added (left). Further, the
computational resolution of the model is represented by at plot of the location of computational cell centers (right)

29
Report
5 Scenario modelling
This Chapter involves simulating a set of scenarios to test the impact of Building with Nature
techniques on dune safety during storm conditions. First a set of scenarios are selected and created
based on different nourishment placement or design, morphological configuration and conceptual
climate change profile developments. Subsequently, these scenarios are applied and analysed for all
three study sites. The results of the three study sites are combined in a synthesis, in order to derive
overall trends and observations, and thus increase our understanding of the effects of nourishments
on coastal behaviour during storm conditions.
5.1 Methodology
5.1.1 Scenario selection
Using the previously described models, we want to test different morphological and hydrodynamic
settings to learn about coastal behaviour during storm conditions and improve our system
understanding. Therefore, scenarios for different placement of nourishments and morphological
configurations with and without Sea Level Rise will be run (the Table 5-1 below).
In these scenarios we have certain questions/aim to focus on:
1. How do nourishment designs differ in their performance during storm conditions?
2. What is the effect of different natural shoreface configurations?
3. Insight in conceptual climate change adaption strategies.
Table 5-1 Joint approach SPR’s scenarios
Scenario group Conceptual design Aim
Current situation – effect of → “do nothing” 1
different nourishment designs
→ Beach nourishment variations
→ Shoreface nourishment variations
Morphological configuration → Variation of different two-dimensional bathymetric 2
formations
Sea Level Rise (adaption of → Current profile 3
hydrodynamic forcing)
→ Landward shift and heightening beach and shoreface
according to the Bruun rule (“do nothing”)
→ No landward shift, heightening beach and/or shoreface
(“hold the line”)
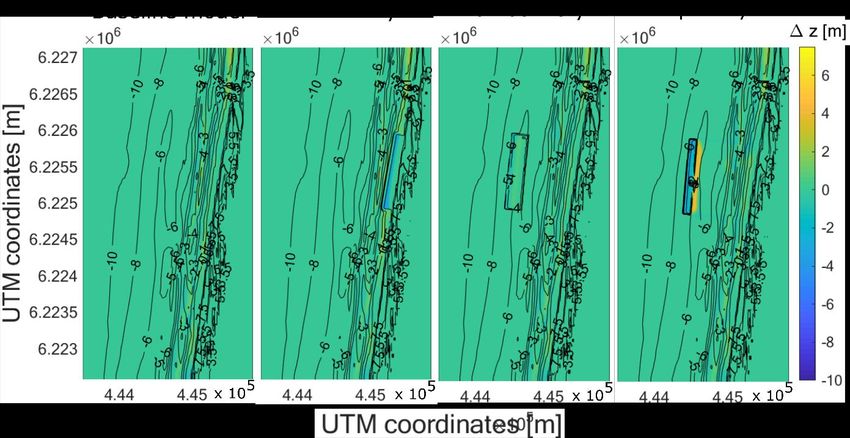
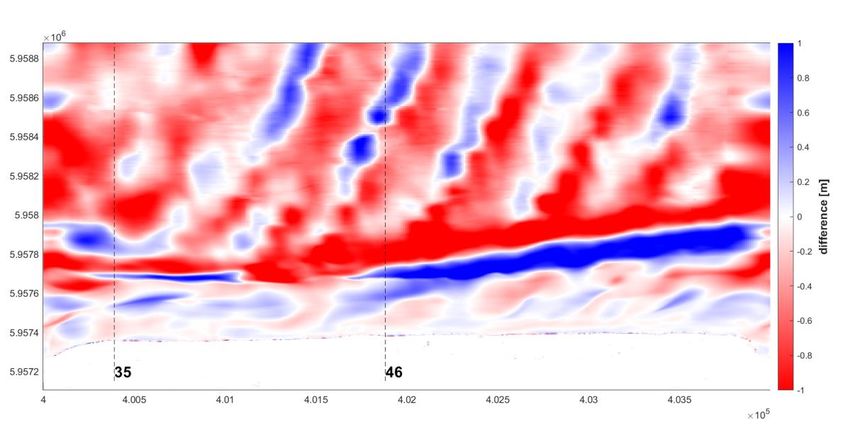
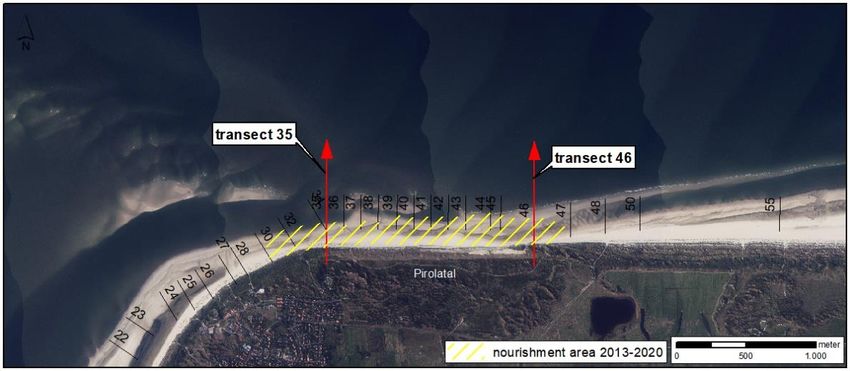
30Report With the aim to gain insight in conceptual climate change adaption strategies, some assumptions were made in the scenario modelling: • For the sea level rise (SLR) scenarios, a SLR of 1 m was added to the tidal water level input and represents the expected SLR in 2100 (IPCC, 2013). Although SLR may differ for each lab or considering different climate change scenarios, this single value was chosen as this is a first assessment of the potential impact of SLR during storm conditions. The wave conditions are kept the same for all scenarios and represent the 1/100-year event for each lab. • Regarding the “Bruun-rule” in SLR scenarios, the profile below the dune face is heightened up 1 m and the profile itself is shifted landwards from the Depth of Closure (DoC) in a specific length regarding the Bruun rule (Bruun 1963/88 and Hands 1983). • As for the conceptual design of beach and shore face nourishments analysed at Sylt and Krogen, it is assumed, that the storm arrives just after the placement of the nourishments. No morphological changed has occurred between placement is done and the storm arrives. 5.1.2 Scenario creation Langeoog The nourishment scenarios for Langeoog are designed based on previous nourishments on the island. The area where nourishments are needed to secure coastal safety varied in the last decades. The latest nourishments took place on the northern beach of the island, north of the fresh water extraction area called “Pirolatal” (Figure 5-1). Figure 5-1 Location of scenario transects 35/46 in the Langeoog nourishment area For Langeoog, 2 transects were selected for the scenario modelling. Transect 35 and 46 are regular monitored transects on Langeoog (see Figure 5-1). Transect 35 is located at the north-western end of the island, where the ebb delta shoals are merging onto the beach. Transect 46 is located in the north of the island, at the eastern end of the current nourishment area. For both transects, changes were made in the profile regarding the scenario selection, whereas the rest of the profile (dune and foreshore area) remains the same in each scenario. The design scenarios are shown in Figure 5-2. 31
Report

Figure 5-2 designs for nourishments scenarios in transect 35 and 46

The nourishments from 2013 and 2017/18 and 2020 are realistic designs which were realised in the
respective year. However, the chosen shoreface nourishment is fictional as no such nourishment has
been implemented on Langeoog so far. This is due to various reasons, for instance a very wide and
shallow shoreface area which makes it difficult to place the sand there. Higher beach, beach, and
shoreface designs are all created with volumes of same quantity of about 400 m³/m.

32
Report

Figure 5-3 Designs for sea level rise scenarios in transect 35 and 46

The sea level scenario designs are, as previously stated, highly conceptual. The scenarios “nourish to
DoC (depth of closure)” and “nourish to –2 m” can also be stated as a “hold-the-line" strategy (Figure
5-3). The dune is kept in the same place, but the shoreface area is nourished down from the dune foot
to the respective height. The scenario based on the “Bruun rule” is based on the assumption, that with
a sea level rise of about 1 m, the coastal profile would retreat in a specific distance. Here, a dune
retreat of 150 m and a vertical heightening of the profile by 1 m is assumed, starting from the position
of the dune foot down to DoC. The retreat of 150 m is calculated using the Bruun formula (depth of
closure = 10 m; upper point of profile adjustment = 10 m; cross-shore distance of depth of closure =
3000 m) (Bruun 1962).

The ebb tidal delta and shoreface area of Langeoog is shaped as a wide shallow area. To test the
influence of incoming wide shoals from the ebb tidal delta, two different bathymetries of 2004 and
2013 area compared (Figure 5-4). These different points in time represent different natural
morphological configurations. In 2004, high shoals are present in ebb-tidal delta near the beach,

33
Report
whereas in 2013 there were no large shoals present. To avoid the influence from different beach
heights, both model bathymetries have the same 2013 height levels for the beach section higher than
the low mean water level.

Figure 5-4 Model bathymetry for 2D-model test of the morphological configuration

5.1.3 Scenario creation Krogen/Sylt
To investigate the effect of nourishments on acute erosion from storms research has to be done. Local
weather conditions often limit the ability to perform physical measurements immediately before and
after a storm, making isolating acute erosion difficult. Implementing theoretical nourishments into
XBeach input data and running it, would resolve this issue, and solely give the effect that a nourishment
has on acute erosion.

The nourishment strategies used are designed based on an analytic approach, where nourishment
volumes are related to the yearly erosion rate in the specific area, and the experienced dune retreat
during storms. The shape of the nourishments is however conceptual and is chosen to investigate the
effect of a shoreface nourishment carried out using rainbowing or splitting on retreat of the dune face
from a storm by different configurations of the pathway determined by XBeach.

It was decided to investigate 3x and 6x the annual erosion of the given area, and to compensate for it
with a singular nourishment, which in real life would be a beach-, rainbowing, or split nourishment,
over a length of ~1000 m. Volumes used for Sylt and Krogen can be seen in

34
Report
Table 5-2.

The “3x” and “6x” stem from the annual erosion volume determined from, both Krogen and Sylt. In
Denmark, objectives on the amount of erosion within a framework of 5 years is agreed along the west
coast of Denmark. To meet the objectives normally 1 and perhaps 2 nourishments are installed during
the 5-year period.

35
Report
Table 5-2 The table holds total nourishment volumes for Syllt and Krogen determined from a 3x yearly erosion and a 6x yearly erosion

                                                  Sylt                                                   Krogen
  Nourishment
     type              3x yearly erosion [m3]            6x yearly erosion          3x yearly erosion             6x yearly erosion
                                                         [m3]                       [m3]                          [m3]
 Beach                             600.000                    1.200.000                  250.000                       500.000
 nourishment
 Rainbowing                        600.000                    1.200.000                    250.000                    500.000
 Split                             600.000                    1.200.000                    250.000                    500.000

The nourishments are implemented with design parameters as seen below in Table 5-3 Slope is
denoted as “rise over length”, I.e. 0.1 = 1 m / 10 m. Wet slope is adopted from the default value in
XBeach. The design height of the beach nourishments is determined based on a water level of a 100-
year return period with wave set up at Krogen and a design storm chosen by the Agency for Coastal
Defence, National Park and Marine Conservation, Schleswig Holstein.

Table 5-3 The table contains relevant design parameters for the different nourishment strategies at Sylt and Krogen

                                                 Sylt                                                    Krogen
  Nourishment
     type
                        Height [m]        Wet slope [-]        Dry slope [-]       Height [m]         Wet slope [-]     Dry slope [-]
 Beach                        5                 0.3                  0.1                4.5                0.3               0.1
 nourishment
 Rainbowing                   -4                 0.3                   -                  -4                0.3                -
 Split                        -2                 0.3                   -                  -2                0.3                -

All nourishments have been applied along a rigid straight line. Along the line sediment is deposited
with the design slope, and volume continuously being calculated and checked against total design
volume. Once the nourishment initially reaches design height, it starts expanding westward, still
maintaining design slopes and heights. When the design volume is reached this process stops. The
method does not have uniform distribution along the defined rigid path, but keeps even width to the
user defined starting position.

The shore face nourishment (“split”) has been designed approximately along the –6 m contour. This is
based on the DCA practice in working with the split hopper dredger vessels. They historically have
sailed to the current min. depth (approx. -6 m), unloaded, moving the contour line westward, and
repeating these steps. The result hereof is a split nourishment with a high, narrow elevated crest level.

The “rainbowing” nourishment allows the sediment to be boosted 100-150 m east of the -6 m line.
DCA experience indicates rainbowing makes for larger spread of sediment, making a wide plateau with
low elevated crest level.

The “beach” nourishment pumps a mixture of water and sand through pipes onto the beach and
repositioned with machinery. The mixture flows towards the ocean, generating a gentle slope. A crest

36
Report height is for Krogen 4.5 m was used, while it was 5 m at Sylt. The result is a flat plateau extending from the dune foot, followed by a gentle slope, steepening slightly when wet. The different conceptual nourishment designs together with the baseline profile can be seen in Figure 5-5. Figure 5-5 Transects showing the different conceptual nourishment designs. The sea level rise (SLR) scenarios are created for a profile where adaptation (nourishment) has been carried out to keep the position of the coastline fixed and for a profile which has due to the yearly erosion rate been shifted landwards (not adapted) regarding the Bruun rule. In both profiles, the pathway from the depth of closure to the maximum storm surge level (MSSL) plus the sea level rise (SLR) of 1 m is elevated by 1m. All SLR scenarios are ran with a modified storm surge curve, where all water levels are vertical adjusted by adding the 1m sea level rise. The different sea level rise scenarios can be seen in Figure 5-6 . Figure 5-6 Transects showing the different sea level rise scenarios investigated. 37
Report
5.2 Scenario results Langeoog
In Figure 5-7 the results of the scenario modelling are shown in groups to display the modelled
variations regarding the scenario.

38
Report

Figure 5-7 1D scenario transects with results (dashed line)

39
Report
Table 5-4 Results from the scenario models in erosion volume in [m³] and retreat [m]. The beach nourishment ranges to a
maximum design level of NHN +4 m, where the higher beach nourishment ranges to a maximum design level of NHN +6 m.
Nourished sand volumes per m are equal in all nourishment scenarios. Retreat values are positive for landward directed
displacement of the dune face.

                                    volume [m³/m]                               retreat [m]
                                    V_erod    V_depo    upper        dune      dune      MHW          MSL      MLW
                         scenario
  transect

                                         ed     sited    dune         face      foot     (+1.3       (0 m)     (-1.3
             No.

                                     Above     above      face       (5 m)     (3 m)       m)                    m)
                                      MSSL      MSSL     (8 m)
                                      (4 m)     (4 m)
  35               without               43         0        3           7        -7       -25            2       -15
              1    nourishment
  46                                    34          0        5           7         0          -8        -25         5
  35               beach                 6          4        0           0        33          9         -34       -17
              2    nourishment
  46                                     4          4        0           1        65       -22          -49         1
  35               higher beach         42          0        0          19        17       -13          -40        -3
              3    nourishment
  46                                    33          0        0          16        10          -6        -23         7
  35               Shoreface            45          0        4           8        -7       -28           -1        -6
              4    nourishment
  46                                    32          0        5           7         0          -7        -21         4

  35               SLR without          94          0       11          11       -24       -42           -2        -5
              5    adaptation
  46                                    75          0       12          14       -14       -20          -23         6
  35               SLR 150m             44          1        4           6       -19          6           3         1
              6    landward shift
  46                                    34          2        7           4        -4       -18            0         1
  35               SLR nourish          46          2        4           7       -20          6          -2         5
              7    to DoC
  46                                    31          2        5           6        -7       -19            0         1
  35               SLR nourish          50          2        5           7       -18          9         23        -25
              8    to -2m
  46                                    34          1        6           6        -3       -15           -3        -5

In Table 5-4 the model results for nourishment- and SLR-scenarios with modelled volume and retreat
values are listed. The eroded sand volume above the maximum storm surge level gives insight in the
dune erosion, but may be misleading in the higher beach nourishment scenario (no. 3) because of the
high nourishment placement. For this scenario the dune erosion volumes are still large, but this is due
to erosion of the beach nourishment and the original dune remains unaffected (Figure 5-8).

In comparison to scenario 1 without nourishment (3/5 m retreat), both scenarios 2 and 3 do not show
any retreat on the upper dune face at 8 m. Most retreat in scenario 2 is found at the dune foot (33/65
m), whereas in scenario 3 this retreat is distributed to both the dune face and dune foot area. The
modelled end profiles show that scenario 2 yields a wide beach area (between dune foot and mean
tidal low water), where in scenario 3 a narrow beach is formed. No major differences can be observed
in scenario 4 compared to scenario 3.

40
Report Scenario no. 5 shows the maximum dune erosion of all scenarios due to the 1 m SLR added to the tidal input. Scenarios 6, 7 and 8 show similar results, also in comparison to scenario 1. Figure 5-8 1D scenario model results of the nourishment scenarios with volume and retreat values displayed 41
Report
Figure 5-9 and Figure 5-10 show the result of the morphological configuration scenario. The difference
of the two compared bathymetries can be seen in the foreshore area clearly. However, the beach
shows some variation in erosion and accumulation patterns, there is not much difference in dune
erosion. Smaller differences can be seen in the profile figures, but they do not follow clear patterns.
The model did not show significant differences in beach and dune erosion within these two
bathymetries. For future research, a new model grid (curvilinear or larger) may be needed to get
significant effect from the ebb tidal delta bathymetry.

Figure 5-9 difference of modelled end bathymetries from 2013 and 2004

Figure 5-10 Transect 35 and 46 of the 2D morphological configuration scenario

42
Report
5.3 Results Sylt
In total three different nourishment strategies are investigated for Sylt, a beach nourishment, a
shoreface nourishment by rainbowing and a shoreface nourishment by a splitting barge.

These results of Sylt concerns first a comparison between with and without nourishment and the
difference between the different nourishment strategies (aim 1). The alongshore 2D variations in
bathymetry are considered as different morphological configurations, due to the difference in
configuration of the bar system along the coast. The along shore variations of the coastal state
indicators erosion, deposit volumes and retreat distances are presented (aim 2).

Finally, by altering the mean sea level, by a sea level rise (SLR) of 1m, the coastal state indicators are
investigated for a single 1D profile.

All analysed transects in the analysis are assumed to have a west-east orientation. The coastline itself
differs less the five degrees from the orientation of the analysed transects. This was done due to a
strict time plan. Figure 5-11 presents the 2D variations of the coastal state indicators along the
coastline of Sylt.

Figure 5-11 A map of coastal state indicators as the erosion volume, the deposited volume and the retreat distance along the coastline of
Sylt. Grey filled area indicates nourishment, where a transect (dotted black line) is located where the ambient erosions is large.

43
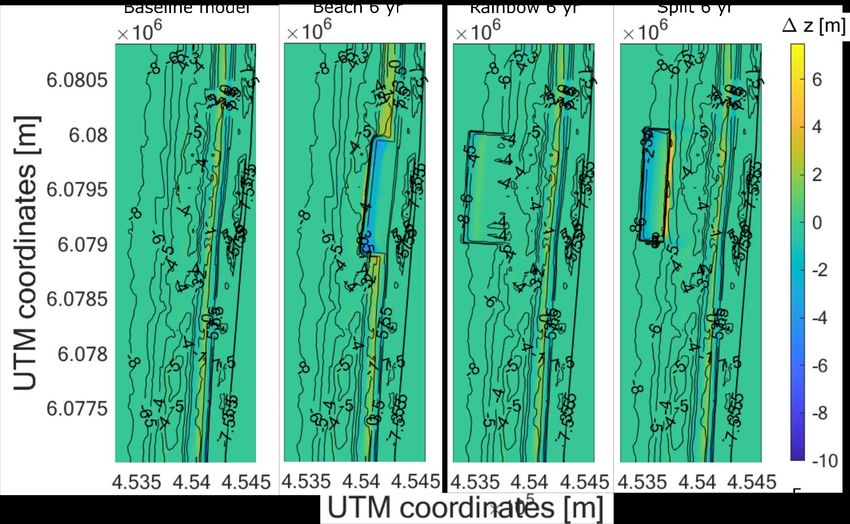
Report
Figure 5-11, shows the along shore variations of the coastal state indicators for the morphological
reference level of 5.5 m, at the dune face above the beach nourishment.

Only erosion takes place at the dune face level and higher up in the profile, hence the maximum storm
surge level (MSSL) is less than 3.5 m and even with the wave setup, sand is not carried up in the dune
face level.

It is seen that the beach nourishments prevent erosion at 5.5m and further up in the dune face along
the entire nourishment area, since the retreat at 5.5 m and erosion volume for both beach
nourishments are close to zero. From the difference plot in Figure 5-12 it can be concluded that the
beach nourishment is spread out and provides protection to the adjacent area, with most sand volume
deposited to the north of the beach nourishment.

The rainbow nourishment follows the pattern of the baseline model (without a nourishment) for
both retreat and erosion volume, it however reduces the erosion in the dune face of 2-3 m, as seen
from Figure 5-11 and

44
Report
Table 5-5.

The split nourishment adds significant protection to the dune face compared to the rainbow
nourishment throughout the nourishment zone of up to 4 m regarding

45
Report
Table 5-5. Though, it does not totally prevent erosion in the dune face as the beach nourishment. It
reduces the retreat in the dune face of 5-7m and erosion volume of 4-10 m3 above MSSL (3.5 m)
compared to if no nourishment was carried out.

In the southern part of the nourishment area (grey filled area in Figure 5-11), local increase in dune
face retreat of 2-3 m is observed when splitting compared to the other nourishment strategies and
without a nourishment. From Figure 5-12, a difference plot shows the morphological changes of the
baseline model, beach, rainbow and split for the large 6 years nourishment. On the landward side of
the split nourishment, boundary effects as channels of deeper water are generated at the lateral
boundaries of the nourishment during the storm. These deeper water channels are coinciding with the
local increase in erosion from Figure 5-11.

Figure 5-12 Difference plot of the baseline model, beach, rainbow and split nourishment. Yellow colour represents accretion and blue colour
represents erosion.

Figure 5-13 shows that both types of shoreface nourishments are migrating towards the coast. The
split nourishment is however transported further landward, depth induced wave breaking is enhanced
on the high elevated crest of the nourishment and it is therefore more affected by the wave acting
forces.

46
Report
As seen from Figure 5-11, the black dotted line, within the nourishment zone, indicates a coastal
transect where the ambient dune face erosion is large as determined from the baseline model. Figure
5-13 highlights the differences between the nourishment strategies of the dry part of the profile.

Figure 5-13 Transect plot of the selected profile, dotted black line, from Figure 5.3-1. The transect is shown for all types of nourishments,
beach, rainbowing and splitting. Further, the baseline profile without nourishment is included.

Figure 5-13 shows the effect on dune erosion for each of the conceptual nourishment strategies for
one transect. Upper most, the different conceptual designs of shoreface and beach nourishment are
plotted. Beneath, the figure is divided in nourishments of 3 years erosion rate to the left and 6 years
to the right. The rows present the different nourishment strategies as beach, rainbow and split. Solid
black lines represent pre storm profiles, dotted red line presents the post storm profile of each
nourishment strategy and the dotted black line presents the ambient post storm profile taken from
the baseline model, without any nourishment.

Based on the transect plot, Figure 5-13, beach nourishments extent the beach more than 50 m
seaward compared to the beaches with shoreface nourishments and without nourishment. The

47
Report
beach nourishments mitigate the erosion in the dune face above the nourishment, whereas the
shoreface nourishments still undergo erosion of 4-8 m in the dune face, see

48
Report
Table 5-5.

Figure 5-14 presents the model results of the sea level rise scenarios. First, the 1D conceptual profiles
are plotted, where the blue line indicates the baseline model, the red-orange curve indicates the
scenario where adaptation (nourishment) has been carried and the yellow-orange curve presents the
scenario where no adaptation (no nourishment) has been carried out.

Figure 5-14 Pre and post storm profiles are plotted for all sea level rise scenarios.

In Figure 5-14, pre and post storm profiles are plotted for all sea level rise scenarios. The difference
in erosion volume and retreat distances between the adapted (nourished) and the not adapted (not
nourished) does not give a clear signal. The adapted scenario observes 1 m larger retreat in the dune
face and the upper dune face. Whereas the not adapted profile observes 3 m larger retreat at the
dune foot, as found from

49
You can also read