INDIVIDUAL MUSCULOSKELETAL CHARACTERISTICS OF RUNNERS AND ADVANCED FOOTWEAR TECHNOLOGY - DIVA
←
→
Page content transcription
If your browser does not render page correctly, please read the page content below
Individual Musculoskeletal
Characteristics of Runners and
Advanced Footwear Technology

 Sebastian Stattin

 GYMNASTIK- OCH IDROTTSHÖGSKOLAN
 Master’s Degree Project 47:2022
 Sports Science 2019–2022
 Supervisor: Toni Arndt
 Co-Supervisor: Johanna Rosén
 Examinor: Magnus Lindwall
Abstract
Background: In recent years, sudden improvements in long-distance running performance
have been suggested to be due to the latest technological innovations in running footwear.
However, inter-individual differences appear to be large in the performance enhancing effect
these shoes elicit where some runners experience a decline in performance while others
improve substantially. The reason for this is not yet fully understood but may be due to
differences in anthropometric and neuromuscular characteristics between runners.
Aim: The aim of this thesis was to investigate the association between individual
anthropometrical and neuromuscular characteristics of runners with changes in running
mechanics while wearing these new generation shoes.
Method: Eight male endurance runners performed four different testing protocols during one
single visit. These consisted of an anthropometrical protocol where measurements of height,
weight, leg length and Achilles tendon moment arm length were determined; a jumping
protocol where vertical stiffness and eccentric utilization ratio (EUR) were recorded using a
force platform; a running protocol where contact time, step length, ankle propulsive power
and knee absorption power were measured using a force platform and a 12-camera motion
analysis system; and finally a force-velocity protocol where each participant performed calf
raises and back squats with incremental loads in a smith machine while barbell velocity was
simultaneously recorded. The collected data were then statistically analyzed using Wilcoxon
Signed-Rank Test and Spearman’s Rank Correlation Coefficient.
Results: Greater peak power in the back squat was associated with a greater reduction in peak
knee absorption power (r = -0,905, p = 0,005) and less vertical stiffness during jumping was
associated with longer step lengths with the advanced footwear technology (AFT) shoes (r = -
0,738, p = 0,046). No associations were found between vertical stiffness during jumping and
contact time, EUR with step length and contact time, peak power in the calf raise and Achilles
tendon moment arm with peak ankle propulsive power.
Conclusion: Runners with less vertical stiffness in the lower limb during jumping exhibited
greater step length increase with AFT shoes. This may be due to the spring-like behavior the
shoes possess. However, the larger step length increases the demands on lower limb strength
and runners with less power in the lower limb may increase their knee absorption power
during ground contact, leading to potentially less efficient running mechanics. Those with
greater power in the lower limb may, on the other hand, run more efficiently by decreasing
their knee absorption power leading to less muscular effort.
Sammanfattning
Bakgrund: De senaste årens förbättringar inom långdistanslöpning har föreslagits bero på de
teknologiska framstegen som gjorts inom löparskokonstruktion. Det verkar emellertid finnas
en skillnad i den prestationshöjande effekt som dessa skor framkallar, där vissa löpare
upplever en försämring medan andra förbättras avsevärt. Orsaken till detta är fortsatt okänt
men kan ha att göra med skillnader i antropometriska och neuromuskulära egenskaper mellan
löpare.
Syfte: Syftet med denna uppsats var att undersöka sambandet mellan individuella
antropometriska och neuromuskulära egenskaper hos löpare med förändringar i löpmekanik
som dessa nya generationens skor framkallar.
Metod: Åtta manliga långdistanslöpare utförde fyra olika testprotokoll under ett enda besök.
Dessa bestod av ett antropometriskt protokoll där längd, vikt, benlängd och
momentarmslängd av Akillessenan mättes; ett hopprotokoll där vertikal styvhet och EUR
registrerades med hjälp av en kraftplatta; ett löpprotokoll där kontakttid, steglängd,
fotledskraft och knäledskraft mättes med hjälp av kraftplattor och ett rörelseanalyssystem med
12 kameror; och slutligen ett kraft-hastighetsprotokoll där varje deltagare utförde tåhävningar
och knäböj med stigande belastning i en smith-maskin medan skivstångshastighet samtidigt
registrerades. Den insamlade data analyserades därefter med Wilcoxon Signed-Rank Test och
Spearman’s Rank Correlation Coefficient.
Resultat: Högre peak power i benböj var associerat med en större minskning av maximal
knäabsorptions power (r = -0,905, p = 0,005) och mindre vertikal styvhet under vertikalhopp
var associerad med längre steglängd med AFT-skorna (r = -0,738, p = 0,046). Inget samband
hittades mellan vertikal styvhet under vertikalhopp och kontakttid, EUR med steglängd och
kontakttid, maximal power i tåhävningar och hälsenans momentarm med maximal
propulsionspower i fotleden.
Konklusion: Löpare med mindre vertikal styvhet i de nedre extremiteten under vertikalhopp
uppvisade större steglängdsökning med AFT-skor. Detta kan bero på det fjäderliknande
beteende skorna har. Den längre steglängden ökar dock kraven på styrkan i den nedre
extremiteten och löpare med mindre kraft, har potentiell ökad knäabsorptions power under
markkontakt vilket kan resultera i en mindre effektiv löpmekanik. De med bättre
kraftutveckling i de nedre extremiteten kan däremot potentiellt springa mer effektivt med
dessa nya generationens skor genom en minskning i knäabsorptions power vilket i sin tur
leder till mindre muskulär ansträngning.
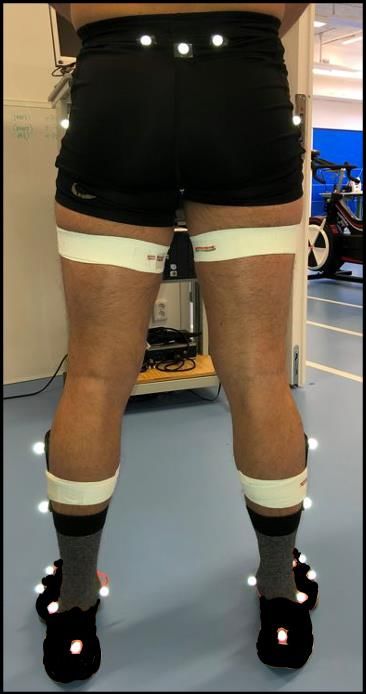
Table of Contents

1 Background ............................................................................................................................. 1
 1.1 The History of Running Shoes: A Brief Introduction ....................................................... 1
 1.2 Running Shoes .................................................................................................................. 4
 1.2.1 Technological Evolution or Technological Doping? ................................................ 4
 1.2.2 Advanced Footwear Technology .............................................................................. 5
 1.2.3 Effect on Running Mechanics ................................................................................... 9
 1.2.4 Individual Characteristics and AFT Shoes .............................................................. 10
 1.3 Research Aims and Hypotheses ...................................................................................... 11
2 Methodology ......................................................................................................................... 11
 2.1 Study Design ................................................................................................................... 11
 2.2 Participants .................................................................................................................... 12
 2.3 Ethical Considerations ................................................................................................... 12
 2.4 Shoe Conditions.............................................................................................................. 12
 2.5 Experimental Set-up and Protocol ................................................................................. 13
 2.5.1 Anthropometric Protocol ......................................................................................... 13
 2.5.2 Jumping Protocol..................................................................................................... 14
 2.5.3 Running Protocol..................................................................................................... 15
 2.5.4 Force-velocity Protocol ........................................................................................... 17
 2.6 Data Analysis ................................................................................................................. 18
 2.7 Statistics ......................................................................................................................... 20
3 Results ................................................................................................................................... 21
 3.1 Biomechanical Differences ............................................................................................ 21
 3.2 Association with Individual Characteristics .................................................................. 22
4 Discussion ............................................................................................................................. 24
 4.1 Knee Absorption Power ................................................................................................. 25
 4.2 Ankle Propulsive Power ................................................................................................. 26
 4.3 Step Length and Contact Time ....................................................................................... 27
 4.4 Methodological Considerations ..................................................................................... 29
 4.5 Practical Implications .................................................................................................... 30
 4.6 Future Research ............................................................................................................. 31
 4.7 Conclusion ...................................................................................................................... 31
5 Acknowledgement ................................................................................................................. 32
6 References ............................................................................................................................. 33

Supplementary Appendices

Appendix 1: Literature Review
1 Background
Running remains one the most performed recreational activities worldwide and has grown in
popularity the last couple of years. In the United States alone almost 18 million individuals
participated in US sanctioned running events in 2019 (Running USA, 2019), while recent data
from the UK suggest that 10% of the adult population engage in running-related activities
(Active Lives Survey, 2021). Coinciding with this, elite running performances and seasonal
best times have seen substantial improvements during the last five years in long-distance
running events such as 5 km, 10 km, half marathons, and marathons (Bermon et al., 2021;
Senefeld et al., 2021). A large proportion of these improvements have occurred after 2018 and
with many national and world records set since then. In 2019, during a special unofficial
event in Vienna, the Kenyan athlete Eliud Kipchoge was the first human to run the marathon
distance under 2 hours, completing it in 1:59:40 (hours:minutes:seconds) (INEOS, 2019). A
strong contributing factor to this ground-breaking achievement, and many other performances
and records, is believed to stem from the new advanced footwear technology (AFT) (Muniz-
Pardos et al., 2021).

1.1 The History of Running Shoes: A Brief Introduction
For most of our existence, humans have either been walking or running barefoot. During the
Upper Paleolithic era there seems to have been a paradigm shift with archeological records
suggesting that protective footwear was started being used, at least in parts of Europe
(Trinkaus & Shang, 2008). The first direct evidence of footwear, however, was in the form of
sandals recovered in Fort Rock, Oregon, USA, dating back 10 000 years (Connolly &
Cannon, 1999). With a flat sole made from sagebrush bark and a strap between the toes, the
sandals were easy to make and protected the plantar surfaces of the feet from various
elements. From the Chalcolithic era, more sophisticated types of footwear were being crafted.
One of the oldest leather shoes, called Areni-1, was found in almost perfect condition in
Armenia and dates back to 5 500 BC (Pinhasi et al., 2010). These were made from cowhide
and lined with grass, wool or straw and were tied around the foot with a string. Since then,
shoes have undergone a lot of changes, but it wasn’t until the beginning of the 19th century
that the athletic shoe started emerging. In 1832, Wait Webster invented the first rubber sole,
which provided greater durability and replaced the older wooden outsole (Knapik et al.,
2015). At the end of the 19th century, shoe soles made from vulcanized rubber were

 1
introduced. This allowed for more flexible soles which were later used in the creation of the
first pair of sneakers, launched in 1916, called the “Keds” (Vanderbilt & Sjögren, 2001). In
the 1890’s, one of the earliest spiked running shoes started being sold commercially by the
manufacturing company J.W. Foster and Sons (later Reebok) and in 1926 Adolf Dassler and
his brother Rudolf (the founders of Adidas and Puma, respectively) took the spikes a step
further when they introduced a variety of spiked running shoes that were tailored for certain
running events. These were made famous by Jesse Owens who used a pair of customized
shoes in the 1936 Olympic Games in Berlin. The evolution continued in the second half of the
20th century, when the founder of ASICS, Kihachiro Onitsuka, released the first pair of
cushioned running shoes called Onitsuka Tiger (Vanderbilt & Sjögren, 2001). Later, in the
1970’s, Nike released the Nike Tailwind which was the first shoe to incorporate air-cushioned
soles (Nike Air). These soles were constructed with tiny air bags that were meant to soften the
impact upon landing. The shoe was a commercial success and grew in popularity after Nike
released an advertisement in the 1979 October issue of the Runner’s World stating that
researchers from University of Tennessee had shown that athletes who ran with the Nike
Tailwind shoe consumed 2,8 % less energy compared to other conventional running shoes
(Runners World, 2018). A year later, however, the article was withdrawn due to claims of
bias during the testing of the shoes (Vanderbilt & Sjögren, 2001). In 1975, Brooks released
the first pair of running shoes who utilized ethylene vinyl acetate (EVA) in the midsole foam
which were lighter than the previous rubber material used and provided better cushioning and
shock absorption. Later in 1977 they released the Vantage shoe which had a wedge inside it to
reduce overpronation (Brooks, 2021; Knapik et al., 2015). This marked a trend that continued
into the ‘80s and well into the 00’s where running shoe design wasn’t merely based upon the
type of running, but also what running style the runner had. These were differentiated into
three styles: neutral runners, supination runners and pronation runners (Fig 1.1). The idea was
that by tailoring the shoe after the runner, the likelihood of injury would be reduced. For
instance, runners with a low midfoot arch were presumed to be at higher risk for
overpronation and therefore at higher risk of injury. These runners were usually
recommended “motion control” shoes as they were advertised as being able to control
excessive motion.

 2
Figure 1.1. Illustration of a) pronation runner, b) neutral runner, and c) supination runner. This
 image was taken from RunRepeat (2021) with their written consent.

 The notion of certain injury preventing running shoes was, however, disrupted
in 2004 with the emergence of minimalist shoes. It started with the release of Nike Free, and
later in 2005 with the Vibram FiveFingers shoes which aimed to reproduce barefoot running
while still providing protection for the plantar surface of the foot (Knapik et al., 2015). These
were usually constructed with a flexible upper and heel counter, eliminated arch support and a
markedly reduced midsole thickness and heel-to-toe drop. The revolution gained further
traction in 2009 after the release of the book “Born to Run” by Chris McDougall. In the book,
McDougall argued that the use of minimalist footwear or barefoot running were better options
in reducing the likelihood of running injuries compared to other running footwear, which he
claims have not shown any empirical evidence of injury reduction despite the technological
advancements made over the years (McDougall & Nilsson, 2012). This was based on
observations of the Tarahumara Indians who did not appear to suffer from running injuries
despite covering long running distances without the aid of modern footwear. During this time,
Hoka broke the trend of minimalist shoes with the release of their flagship maximalist shoe,
the Hoka One One (Baron, 2020; Megroz, 2013). These shoes were lightweight and, in
contrast to the minimalist shoes, had a thick and highly cushioned foam. Since then, the trend
has turned to performance, with the latest breakthrough belonging to Nike with the launch of
their AFT shoe, the Vaporfly.

 3
1.2 Running Shoes

1.2.1 Technological Evolution or Technological Doping?
The sudden improvements in running performance have been suggested to be related to the
latest innovations in running footwear (Joyner et al., 2020). Since 2017, the top 20 and top
100 elite runners’ seasonal bests in 10km, half-marathon and marathon have decreased
significantly, and a contributing factor seems to be the adoption of AFT (Bermon et al.,
2021). Similarly, an improvement of 2,8 and 4,3 minutes were shown for the top 50 elite
marathon males and females respectively, while wearing running shoes with AFT (Senefeld et
al., 2021). Recreational runners also seem to reap the rewards induced by these shoes. In
2018, the New York Times published an analysis in conjunction with Strava in which they
concluded that runners across different ranges of running ability, performed better with AFT
shoes compared to their habitual running shoes while running half-marathon and marathon
(New York Times, 2018). In addition, the probability of breaking a personal record increased
by 73-75%. In laboratory settings, several studies have found that the energetic cost of
running is reduced by 4 % while wearing AFT shoes among elite and recreational male
runners compared to more traditional shoes (Barnes & Kilding, 2019; Hoogkamer et al., 2018;
Hunter et al., 2019; Hébert-Losier et al., 2022). The magnitudes of these improvements are
akin to the performance enhancing effect of various blood doping substances (Durussel et al.,
2013; Haile et al., 2019). However, recent research seems to suggest there is a difference
between different AFT shoes with some performing better than others (Joubert & Jones,
2022). Furthermore, inter-individual differences seem to be large while running in AFT shoes,
ranging from -9,6 % to a 13,3 % increase in metabolic savings (Barnes & Kilding, 2019;
Hoogkamer et al., 2018; Hunter et al., 2019; Hébert-Losier et al., 2022)
 Inevitably, these results have sparked a debate whether these new advancements
in technology may provide some with an unfair advantage over others, while also raising the
question about whether this should be classified as technological doping (Dyer, 2020).
Furthermore, the use of AFT shoes seems to contradict World Athletics’ (WA) technical rule
5.2 which states the following: “Athletes may compete barefoot or with footwear on one foot
or both feet. The purpose of shoes for competition is to give protection and stability to the feet
and a firm grip on the ground. They must not give athletes any unfair assistance or
advantage…” (World Athletic, 2020a). In the late 00’s, swimming faced a similar dilemma
when polyurethane material was introduced in the swimsuits, which culminated in the 2009
World Championship in Rome with 43 new world records (Morales et al., 2019). This

 4
eventually led to a rule change by FINA (the governing body) from 1 January 2010 which
banned the use of this material and only authorized certain models for men and woman. Given
similar concerns in running, WA announced in January 2020 a rule change in technical
specifications regarding running shoes which limited stack height to 40 mm and the use of a
single carbon-fiber plate (World Athletic, 2020b). This was in accordance with a paper
released in 2019 (Burns & Tam, 2020), which has been disputed by some for not resolving the
issue (Frederick, 2020; Hoogkamer, 2020). The reason for this is that it presupposes that the
stack height and the carbon-fiber plate are the main reasons for the increase in performance.

1.2.2 Advanced Footwear Technology
The mechanism behind the performance enhancing effect that the AFT shoe elicits is not yet
fully understood but is probably due to a combination of various features which makes them
stand out from more traditional shoes. The features suggested to be responsible are 1) a stiff
plate embedded in the midsole, 2) the midsole foam, 3) shoe mass, 4) stack height and 5) the
geometry of the sole. In the following sections, each of these features will be discussed as
well as the potential mechanisms of action on running mechanics.

1.2.2.1 Longitudinal Bending Stiffness
The use of a stiff carbon fiber plate or grid in running shoes is not a new phenomenon.
Although widely used in sprinting shoes, it is not until recently that it has become popular in
long-distance shoes. By increasing the longitudinal bending stiffness (LBS), the embedded
stiff plate has shown to potentially reduce the energetic cost of running (Roy & Stefanyshyn,
2006). The reason for this could be because the increased LBS stiffens the
metatarsalphalangeal (MTP) joint, limiting dorsiflexion and reducing the energy lost at the
joint (Cigoja et al., 2019; Hoogkamer et al., 2019; Willwacher et al., 2013). The MTP joint
has been observed to be an important location for energy cost during running (Sun et al.,
2020). Another potential source of influence is around the ankle joint. With increased bending
stiffness, the point of force application could potentially move more anteriorly, thereby
increasing the moment arm to the ankle joint (Oh & Park, 2017; Willwacher et al., 2016;
Willwacher et al., 2014). This would increase the ankle joint moment provided that the
ground reaction force (GRF) stays the same. During running, the point of force application
moves considerably resulting in an external moment arm under constant change. Meanwhile,
the internal moment arm to plantar flexor muscles undergoes much less alteration. This refers

 5
to the gear ratio which is the ratio between external and internal moment arms (Carrier et al.,
1994). Gear ratio is considered to be a parameter in walking and running that affects
efficiency and load regulation. For instance, increasing the gearing ratio by increasing the
external moment arm has been found to reduce angular velocity at the joint and the muscle
fascicle shortening velocity (Cigoja et al., 2021; Madden et al., 2016; Takahashi et al., 2016).
This has also been observed in runners with shorter Achilles tendon moment arms where,
given a certain angular velocity, a shorter moment arm permits a slower shortening velocity
of the muscle fascicles (Nagano & Komura, 2003). The reduction in shortening velocity of the
muscle fascicles is accompanied with an increase in force potential, referring to the
optimization the force-velocity potential (Hill, 1938), resulting in less metabolic demand
(Fletcher et al., 2013). Due to the substantial contribution of the triceps surae muscle to the
energetic cost of running (Fletcher & MacIntosh, 2015), an increase in force potential of the
muscle would allow it to work more economically, potentially reducing the metabolic cost
overall (Fletcher & MacIntosh, 2018).
 Finally, the curvature of the plate may also play a role in the performance
enhancing effect seen with increased LBS. Recently, it has been theorized that the curved
plate (typically seen in the most prominent AFT shoes) creates a so called “teeter-totter”
effect (Nigg et al., 2021). This proposes that during the second half of the stance phase, while
the resultant GRF is displaced anteriorly towards the front of the curved plate, it produces a
reaction force at the heel in a direction that is perpendicular to the plate. The additional force
on the heel may then increase the propulsion during take-off, potentially improving running
economy by up to 6 %. However, this has yet to be confirmed as it is based on unpublished
simulated data.

1.2.2.2 Midsole Foam
The new generation of shoes also contains a thick, lightweight, compliant and resilient
midsole foam. This is usually made of thermoplastic rubber, for instance polyamide block
elastomer (PEBA) (Burns & Tam, 2020). The primary role of the foam is to cushion impact
and return mechanical energy stored during ground contact (Sun et al., 2020). These factors
depend on the compliance and resilience of the foam. Compliance is the amount of
deformation that the material goes through while potential energy is stored under load, while
resilience is the fraction of mechanical energy returned. Naturally, some of the energy
returned will dissipate as heat, as with all materials with viscoelastic properties (Shorten,
1993), but the new types of material used in the foam have been shown to be very effective in
 6
minimizing this loss. In comparison with other foam materials, PEBA has been shown to
return 87% of the potential energy stored while also being more complaint (Hoogkamer et al.,
2018). These two in combination may greatly improve the performance enhancing effect the
shoes possess. As early as the 1980’s, research has shown that a more compliant and resilient
foam can improve performance, which has also been confirmed in later studies (Black et al.,
2022; Worobets et al., 2014). This may be due to the higher mechanical energy returned from
the foam.
 The ability to efficiently store and return energy has been considered an
important trait in runners (Barnes & Kilding, 2015, Novacheck, 1998). To explain this, the
spring-mass model is frequently used where the leg is described to behave like a linear spring,
loaded by the runner’s weight during initial ground contact (Dalleau et al., 1998). During this
time, elastic potential energy is transmitted from the body’s muscles, joints, tendons, and
ligaments and then subsequently returned during propulsion (Yin et al., 2020). This spring-
like mechanism is characterised by its stiffness which is based on Hooke’s law which states
that the force required to compress or extend a linear spring with a constant stiffness, is
proportional to the deformation it goes through (A. Freedman & D. Young, 2015). In running,
vertical stiffness is a proxy often used to reflect this ability with previous studies showing that
greater vertical stiffness in runners leads to more economical running (Barnes et al., 2014,
Dalleau et al., 1998). This enhanced storage and return of elastic energy that greater stiffness
may facilitate, improves the stretch-shortening cycles (SSC) during running and subsequent
performance (Brazier et al., 2019). Vertical stiffness is calculated by dividing peak vertical
GRF with maximal vertical displacement of centre of mass (COM) (Morin et al., 2005).
Another often used proxy for SSC in various sports are eccentric utilization ratio (EUR). This
is described as the ratio between the countermovement jump (CMJ) and squat jump (SJ)
performance where an ideal EUR is suggested to be circa 1,1 (McGuigan et al., 2006). With
the new soles more energy efficient, the muscles are required to perform less work in order to
aid the tendons absorbing and returning energy, leading to a reduction in the rate of oxygen
demand (Shorten, 1993). Runners with poorer SSC ability or lower vertical stiffness may
therefore benefit more with these AFT shoes due to the spring-like behaviour the midsole
foam possess.
 Finally, the performance enhancing effect can also be due to the alteration in leg
stiffness induced by the compliant material. While running on surfaces of different degrees of
stiffness, humans usually adapt by modifying leg stiffness to reduce impact forces. For
instance, while running on a more compliant surface such as natural grass, humans tend to

 7
increase leg stiffness compared to harder surfaces where a decrease in leg stiffness usually
occurs (Ferris et al., 1998). Runners typically increase leg stiffness by reducing knee flexion
which in turn reduces knee extensor moment resulting in an improved mechanical advantage
of the muscles around the joint (Biewener, 1989). This reduces the required muscle force of
the knee extensor muscles and thus metabolic demand (Kipp et al., 2018). Leg stiffness,
compared to vertical stiffness, is calculated by multiplying the GRF vector acting through the
leg with maximal leg compression. This has earlier been found to have a strong correlation
with vertical stiffness during jumping (Rogers et al., 2017).

1.2.2.3 Shoe Mass and Stack Height
Another advantage that these new generation of foams provides is its low density. By being
made from material with lower density, the shoes weight will decrease which has previously
been shown to reduce the energetic cost of running by 1% per 100g of mass removed (Franz
et al., 2012; Hoogkamer et al., 2016). The likely reason for this is the reduced moment of
inertia of the leg during swing phase (Barnes & Kilding, 2015). Furthermore, the low density
material also facilitates a thicker foam without adding any significant mass. The thicker
midsole would allow for more deformation to occur within the shoe which would increase the
energy stored in the foam (Nigg et al., 2020). This would also increase the time spent on the
ground as thicker midsoles need more time to deform (Chambon et al., 2014). With increased
contact time, less metabolically expensive muscle fibres need to be recruited and shortening
velocity will decrease which would benefit performance (Kram & Taylor, 1990; Roberts et
al., 1998). Another possible explanation could be the increase in effective leg length of the
runner. Previous research has found that longer legs are advantageous for running
performance (Mooses et al., 2015; Sleivert & Rowlands, 1996), although the underlying
mechanism for this is not yet clear (Lucia et al., 2006). One would think that because longer
legs contribute to greater moment of inertia, the cost of moving the legs during swing phase
would be greater, but it doesn’t appear to be any consensus on whether this increase is of any
significance or not when it comes to running performance (Saunders et al., 2004). However,
the explanation for the improvement in performance could be due to an increase in step
length. By increasing the step length, the number of steps for a given distance is reduced and
less energy is spent accelerating the leg compared to an increase in frequency. This has been
found to be more efficient (Mooses et al., 2015) and would therefore be more beneficial for
running performance. In addition, runners who experience a greater artificial increase in leg
length due to thicker midsoles may see larger improvements in running performance (Pontzer,
 8
2007; Steudel-Numbers et al., 2007). With a stack height above 30 mm, the new generation of
shoes may be more beneficial for those with shorter legs.

1.2.2.4 Sole Geometry
Finally, the geometry of the sole could also play a role in the performance enhancing effect.
Virtually all new running shoes with AFT have an outsole with a concave shape. This could
potentially make the transition from foot-strike to toe-off much smoother while also orienting
the GRF more anteriorly during toe-off, taken that the anterior part of the sole aids in the sole
rebound sufficiently (Nigg et al., 2020). Furthermore, changes in running mechanics induced
by the rocker-like bottom could also be of importance. Previously, several studies have shown
significant changes in ankle biomechanics with rocker shoes. For instance, both ankle joint
moment and work have been seen to be reduced (Boyer & Andriacchi, 2009; Sobhani et al.,
2013; Sobhani et al., 2017) and may be related to changes in terminal stance. In more
traditional shoes, the point of GRF application is usually located at the MTP joint, while in
rocker shoes a proximal shift is seen where the force application is applied at the apex of the
rocker bottom (Sobhani et al., 2015). This shift in force application reduces the moment arm
and therefore ankle joint moment. While these changes in ankle biomechanics have in some
studies been accompanied with changes in knee kinematics such as peak knee extension
moment and net work (Sobhani et al., 2017), others have found no significant difference
(Boyer & Andriacchi, 2009; Sobhani et al., 2013; Sobhani et al., 2015).

1.2.3 Effect on Running Mechanics
Numerous studies have previously shown the effect of running footwear on running
mechanics (Sun et al., 2020). However, many of these have used custom shoes with specific
characteristics (e.g., modified stack height, weight or midsole bending stiffness), while few
have specifically looked at AFT shoes. Most of the research that has studied AFT shoes has
looked at gross biomechanical measures such as stride length and ground contact time
(Barnes & Kilding, 2019; Hoogkamer et al., 2018; Hunter et al., 2019; Joubert & Jones,
2022). These have shown conflicting results with increased (Hoogkamer et al., 2018; Joubert
& Jones, 2022), decreased (Barnes & Kilding, 2019) or no difference (Hoogkamer et al.,
2019; Hunter et al., 2019) in ground contact time, greater (Hunter et al., 2019) or no
difference (Joubert & Jones, 2022) in center of mass vertical oscillation and greater
(Hoogkamer et al., 2019) or no difference (Hunter et al., 2019) in vertical impulse. The reason

 9
for this could be because of difference in methodology, but also because of individual
difference in running mechanics and/or individual characteristics. Step length and aerial time
seems to be the only consistent gross biomechanical variables in the literature which have
been found to increase with AFT shoes (Barnes & Kilding, 2019; Hoogkamer et al., 2019;
Hunter et al., 2019; Joubert & Jones, 2022), suggesting a “bouncier” step.
 While there appear to be some inconsistencies in these gross biomechanical
variables, their significance in terms of performance seems to be small as it only explains
20 % of the variance on energetic savings (Hoogkamer et al., 2018). Kinematic and kinetic
data may provide further information. To date, only one study has explored this in detail
(Hoogkamer et al., 2019). They found no difference in hip and knee kinematics and kinetics
but some changes in the ankle and MTP joint. Peak ankle dorsiflexion moment and negative
and positive joint work were smaller with AFT shoes, while joint angular velocity was slower
during stance. This would imply less metabolic demand on the plantar flexor muscles by
reducing the force required to propel forward and decreasing muscle shortening velocity
(Kipp et al., 2018; Kram & Taylor, 1990). As for the MTP joint, smaller peak joint
dorsiflexion and slower velocity were observed resulting in less negative joint work.
Although these changes in kinematics and kinetics could possibly explain some of the
performance enhancing effect further, these analyses were done on a group level meaning that
individual differences would be hard to observe. Furthermore, differences in individual
characteristics were not accounted for which could explain the discrepancy seen between
participants.

1.2.4 Individual Characteristics and AFT shoes
Despite observed changes in running performance and mechanics, no research has to our
knowledge examined individual differences in anthropometry and neuromuscular
characteristics that might explain the discrepancy seen between runners with AFT shoes. Few
studies have investigated the effect that specific aspects of AFT have on the muscle-tendon
unit (MTU). For instance, increased LBS has been found to decrease the shortening velocity
of the gastrocnemius muscle. This may be due to increased contact time as no observational
changes in ankle joint moment occurred (Cigoja et al., 2021). The increased contact time
would decrease the rate of force generation of the muscle which would therefore reduce the
metabolic demand (Kram & Taylor, 1990). Furthermore, increased LBS has also been shown
to induce greater energy return from the Achilles tendon (Cigoja et al., 2021), while more

 10
compliant foams could potentially increase the stretch of the tendon (Esposito et al., 2022)
and therefore store more energy (Fletcher & MacIntosh, 2015). Runners who exhibit greater
energy storage capacity in the Achilles tendon (e.g., increased tendon stiffness) have been
shown to perform better (Arampatzis et al., 2006; Kovács et al., 2020). If indeed these
changes elicited by the features seen in the new generation shoes can explain the performance
enhancing effect, it would make sense that differences between individuals would elicit
different outcomes.

1.3 Research Aims and Hypotheses
The aim of this thesis was to investigate the association between individual anthropometrical
and neuromuscular characteristics of runners with changes in mechanics while running in
AFT shoes. The hypotheses were:
 ▪ H1: Runners with less power in the lower limb will have a greater reduction in knee
 absorption power with AFT shoes than those with more power
 ▪ H2: Individuals with lower power production ability in the plantar flexor muscles will
 reduce their ankle propulsive power more with AFT shoes compared to non-AFT
 shoes than those with higher power production
 ▪ H3: A shorter Achilles tendon moment arm will be more strongly positively correlated
 with ankle propulsive power changes with AFT shoes compared to non-AFT shoes
 ▪ H4: There will be a significant negative association between vertical stiffness during
 jumping and step length as well as contact time with AFT shoes compared to non-AFT
 shoes
 ▪ H5: EUR will be significantly negatively associated with step length and contact time
 with AFT shoes compared to non-AFT shoes
 ▪ H6: Individuals with greater relative leg length increase due to the AFT shoes will
 increase their step length and contact time

2 Methodology

2.1 Study Design
This thesis is an experimental cross-sectional study with within-subject design.

 11
2.2 Participants
Eight male endurance runners (age 34,1 ± 9,1, height 182,5 cm ± 6,5, bodyweight 72,7 kg ±
9,3) were recruited to the study through local running clubs, social media, and personal
contacts. Inclusion criteria were: (i) age between 18 and 50, (ii) training volume of at least 30
km per week, (iii) 10-km sub-38-min personal best and (iv) fitting in an EU men’s size 42, 43
or 45,5 shoe. Participants were excluded from the study if they had sustained any hip, knee, or
foot injury during the past six months. One of the initially recruited participants dropped out
of the study due to a lower leg injury sustained before the trial had commenced. Further
descriptive data can be found in table 2.1.

Table 2.1. Descriptive participant data (mean ± standard deviation)
 PB 10km [min:sec] Running/week [h] Total Volume/week [h] Days/week
 34:40 ± 3:15 7,3 ± 2,4 9,9 ± 2,8 6,3 ± 0,8
PB = personal best

2.3 Ethical Considerations
Due to this study being a master thesis, no ethical approval was required (The Ethical Review
Act, 2003:460). However, ethical rules were taken into consideration, and the study was
conducted in accordance with the code of the Helsinki Declaration (2013). Prior to
participating, written consent was obtained from each participant after being informed both
orally and in writing about the purpose of the study. In addition, they were informed about the
possibility of withdrawing their participation in the study at any time without being required
to state a reason. Following the written consent, each participant completed a health
questionnaire to ensure their general well-being. During the trials, each participant was given
the opportunity to extend their warm-up if required. All data collected during the trials were
coded to allow for anonymization.

2.4 Shoe Conditions
Participants wore two different running shoes: one pair with AFT and one without. These
were selected in a randomized order for each participant before each running trial. The
selection of running shoes was based on previously performed mechanical tests on energy
return characteristics conducted by a research group at KTH. The AFT shoe was selected as it
displayed the greatest mechanical energy return, while the non-AFT shoe was selected based

 12
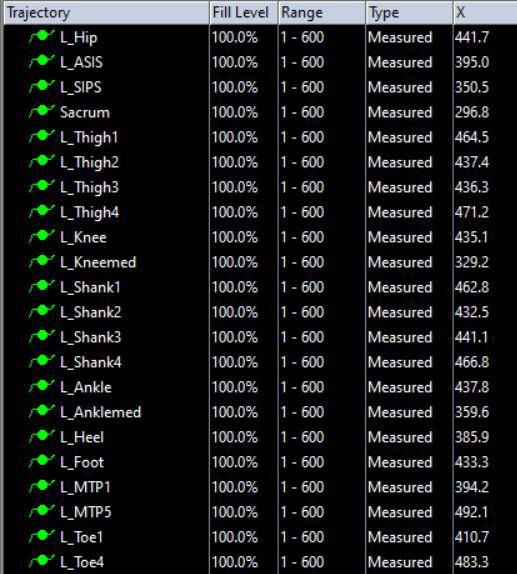
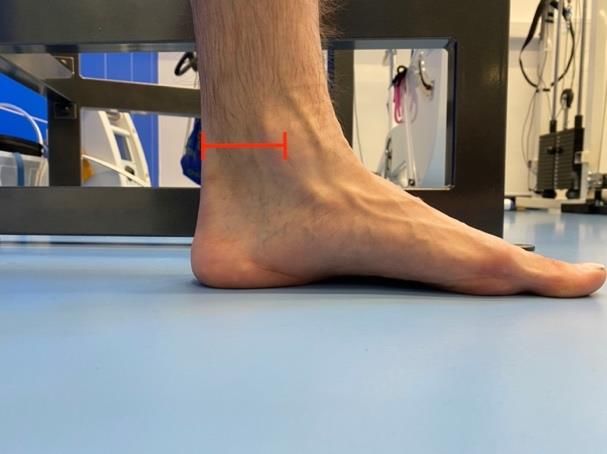
on features seen in more traditional running shoes and their lack of performance during the
 mechanical testing. Due to the data not yet being publicly available, the shoes were
 anonymized. Descriptive data of energy return characteristics can be found in table 2.2.

 Table 2.2. Shoe characteristics data. Thickness 12% from the heel, Forefoot compression,
 Rearfoot compression, and Tensile bending stiffness described in relative energy return.
Shoe Thickness 12% [mm] Weight [g] Plate FRF Comp RER [%] RF Comp RER [%] TBS RER [%]
AFT 37 214 Yes 83,9 82 77,6
Non-AFT 28 286 No 63,7 65,4 64,1
 FRF = Forefoot, RF = Rearfoot, TBS = Tensile bending stiffness, Comp = Compression, RER
 = Relative energy return

 2.5 Experimental Set-up and Protocol
 This study took place at the Swedish Sports Confederation’s Laboratory for Performance
 Development at Bosön, Sweden, and comprised of four testing protocols. These were
 anthropometrics, jumping, running and force-velocity protocols and all were performed
 during a single visit.

 2.5.1 Anthropometric Protocol
 The anthropometrical measurements were conducted at the beginning of each session,
 immediately after the participants had completed the health declaration form. Height (cm)
 was measured with a standard height rod to the nearest 0,1 cm while body weight (kg) was
 measured using a force plate with a sampling frequency of 1600 Hz (Kistler Instruments AG,
 Winterthur, Switzerland). The output from the force plate data was divided by the
 gravitational constant of 9,81 m/s2 to obtain the participants’ body weight in kg. While in a
 supine position with a fully extended knee, leg length was measured with a tape measure from
 the most prominent part of the greater trochanter to the midpoint of the lateral malleolus (Fig.
 2.1). The Achilles tendon moment arm was estimated using a modified version of a
 previously validated method by Scholz et al. (2008). By definition, the distance between the
 joint axis of the ankle and the shortest line of action to the Achilles tendon can be described as
 its moment arm. In standing, the horizontal distance between the lateral and medial malleolus
 and posterior part of the Achilles tendon were measured using a tape measurement (Fig. 2.2).
 The mean distance from these two measurements were then divided by two and defined as the
 moment arm of the Achilles tendon.

 13
Figure 2.1. Leg length as measured from the Figure 2.2. Achilles tendon moment arm
 greater trochanter (far left) to the lateral measured from the apex of the malleoli to
 malleoli (far right) the posterior part of the Achilles tendon,
 perpendicular to the malleoli.

2.5.2 Jumping Protocol
Following the anthropometrical protocol and prior to the jumping protocol, each participant
performed a 5-minute running warm-up trial around a 200 m indoor track wearing their own
shoes. The participant then completed ten warm-up jumps three times, followed by three
maximal vertical jumps with a 1-minute rest in-between. For the ten warm-up jumps, each
participant was instructed to jump with as little knee flexion as possible while also
minimizing ground contact time. After the warm-up, three different types of vertical jumps
were performed on a force plate (Kistler Instruments AG, Winterthur, Switzerland) three
times each with a 2-minute rest in-between. These were in the following order: squat jump
(SJ), countermovement jump (CMJ) and stiffness jumps. For each type of jump, the
participant was instructed to hold their hands at their hips at all times. During the SJ, the
participant assumed a squat position of 90° knee flexion and were then told to hold this
position isometrically until the test leader told them to jump as high as possible. The trial was
discarded if the participant made any countermovement during the propulsive phase, which
was screened both visually and through force-time data. For the CMJ, the participant was told
to stand upright, then squat to a self-selected depth before directly initiating a maximal
vertical jump. Lastly, the stiffness jumps consisted of five continuously performed jumps
where the participant was instructed to minimize ground contact time while also aiming to
jump for maximum height with as little knee flexion as possible during ground contact.

 14
2.5.3 Running Protocol
After completing the jumping protocol, 43 reflective markers were placed on different
anatomical landmarks of the pelvis and legs using double-sided adhesive tape (Fig 2.3). These
were attached bilaterally on the ASIS, PSIS, proximal 1/3 of the sacrum, proximal to the apex
of the iliac crest laterally, the medial and lateral femoral condyles as well as the medial and
lateral malleoli. For the thigh and shank, a cluster of four markers on a plastic plate were used
secured with an elastic band and tape. Finally, six markers were attached on each shoe located
at the posterior heel, metatarsal joint I and V, lateral cuneiform and dorsal tip of digiti pedis I
and IV. The markers on the medial femoral condyles and malleolus were removed after a
static calibration trial due to the increased likelihood of them falling off and disturbing the
participants during their run. Before the running trials, each participant completed a set of
warm-up trials to allow familiarization with the new shoes. The participants only performed 2
to 5 warm-up trials as its previously been observed that runners quickly adapt their running
mechanics in response to changes in running surface (Ferris et al., 1999). Following this, the
participants ran across a 15-meter runway embedded with two force plates (Kistler
Instruments AG, Winterthur, Switzerland) at a speed of 15 km/h while simultaneously being
recorded with a 12-camera three-dimensional motion capture system with a sampling
frequency of 200 Hz (Oqus4, Qualisys AB, Gothenburg, Sweden) (Fig. 2.4). The acquired
movement data from the marker positions were then synchronized with the GRF-data using
the motion analysis software (Qualisys Track Manager, Qualisys AB). Two pairs of timing
gates (Smartspeed Pro, Fusion Sport, Coopers Plains, Australia) were placed 5 meters apart
and used to monitor running speed with a 5 % acceptable variance. Furthermore, a trial was
deemed successful if the participant landed with his right or left foot completely on one of the
force plates. The running trials continued until three successful attempts per leg were recorded
in each shoe condition.

 15
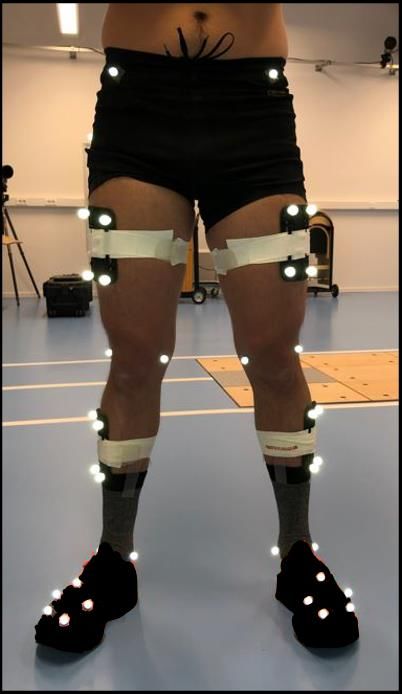
Figure 2.3. Placement of the reflective markers depicted a) anteriorly and b) posteriorly. This
picture was taken during the pilot and the pilot participant used his own personal running
shoes.

 16
Figure 2.4. Running protocol set-up with a runway of 15 meters, two force plates, two pairs
 of timing gates and a 12-camera motion capture system.

2.5.4 Force-velocity Protocol
The final protocol completed during the testing session was the force-velocity (F-v) protocol
which consisted of calf-raises and back squats. The F-v session was performed in a smith
machine with a standardized warm-up of 10 repetitions with the unloaded barbell for each
exercise before commencing the trial. Thereafter, all participants completed three repetitions
of each exercise at four different loads (30, 50, 70 and 90 % of bodyweight). If the last load
was deemed too heavy by the participant, the final repetition was instead reduced to 80 %.
The interval between the loads were chosen based on the likelihood of observing differences
in velocity with each increase (Jidovtseff et al., 2011). Each set was followed by 2-minutes
rest. For the calf-raises, the participants were instructed to raise their heels to maximum
height as fast as possible after a signal from the test leader. To ensure they reached maximum
height before descending and not bouncing during ground contact, each participant was asked
to descend and commence on a signal from the test leader, which took less than 1 second.
After completing four sets of three repetitions of calf-raises, back squats were initiated.
Before the warm-up, a stop pad was placed at a depth that the thighs were approximately

 17
parallel to the floor to ensure that no countermovement was performed, and that the participant started from the same depth for each trial. The participant was then instructed to descend to the stop pad before performing a concentric squat as fast as possible without lifting the heels. As for the calf-raises, a signal was given from the test leader before commencing the next repetition. The concentric sections of the trials were measured with a linear position transducer (LPT) (GymAware PowerTool, Kinetic Performance Technologies, Canberra, Australia) which measures vertical barbell displacement and has previously been validated for barbell velocity (Banyard et al., 2017). The floor unit of the LPT was positioned on the floor to the far right of the participant while the tether was attached on the barbell vertically from the floor unit using a Velcro strap. The data from the LPT device were then transmitted through Bluetooth to a tablet (iPad; Apple, Inc., Cupertino, CA, USA) and then further analyzed. 2.6 Data Analysis For the jumping protocol, GRF data were exported to a computational software (Matlab, MathWorks Inc, Natick, MA, USA) for further processing. Using Newton’s second law of motion, velocity was calculated during the propulsion phase for the SJ and CMJ by numerically integrating the GRF-time data: ( )− ( ) = ∫ 0 (1) where FY is the GRF, m is body mass and g are the gravitational acceleration constant of 9,81 m s-1. Vertical power was then estimated using the following equation: = × (2) The peak power ratio between the CMJ and SJ (based on the mean of all three trials) was then used to estimate EUR. The stiffness jumps were used to measure lower-limb vertical stiffness. For this, we calculated vertical displacement of center of mass (COM) on the last three stiffness jumps during each trial by numerically double-integrating the GRF-data: ( )− ∆ ( ) = ∬ 0 (3) 18
From the initial value, the following equation was derived and used in the second
integration:

 0 = − (4)
 2

where ta is aerial time. Vertical stiffness was then estimated using the following equation:

 = (5)
 ∆

where RFpeak is relative peak force due to stiffness being influenced by body mass (Farley et
al., 1993). Force data for both the CMJ and the SJ data as well as for the stiffness jumps were
filtered with a fourth order Butterworth low-pass filter with a cut-off frequency of 10 Hz.
 For the running protocol, data was collected in Qualisys Track Manager
(Qualisys AB, Gothenburg, Sweden). Each marker was labelled after the label list below (fig
2.5) and then either manually added or gap-filled in case a marker disconnected or
disappeared during the recording. The data was then exported to Visual 3D (C-Motion,
Germantown, USA). The marker data was filtered using a low-pass Butterworth filter with a
cutoff frequency of 15 Hz. The stance phase was normalized to percent body weight. To
determine touchdown and take-off, a threshold of 5% of body weight based on the GRF data
was used. In addition, all trials were controlled visually for any incorrect touchdowns or take-
offs after the threshold had been implemented. Knee and ankle joint power were then
calculated through Visual 3D using inverse dynamics, ground contact time by calculating the
time between touchdown and take-off, and step length by calculating the distance between
instances of peak downward velocity of the pelvis. This method has previously been validated
to estimate touchdowns regardless of foot-strike type using kinematic data (Milner &
Paquette, 2015).
 Finally for the F-V protocol velocity and acceleration were calculated from the
first and second derivatives of the barbell displacement and force was determined by
multiplying the acceleration data with system mass (body weight and external load). Power
was then calculated as in Eq 2. Lastly, rate of force development (RFD) was calculated and
defined as the steepest part of the force-time curve.

 19
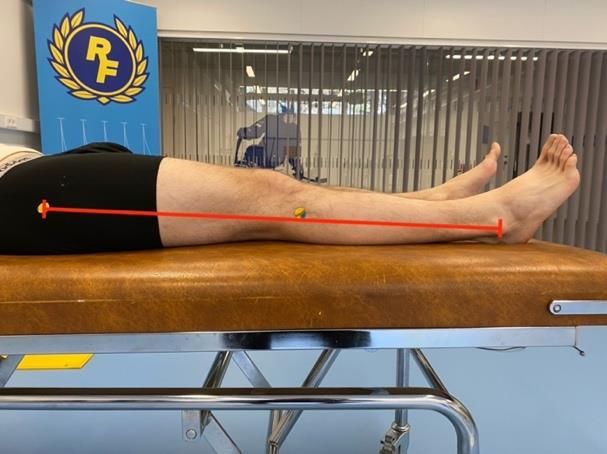
Figure 2.5. a) The process labelled markers and b) label list for the left side of the lower limb.

2.7 Statistics
Descriptive statistics were calculated for each variable of interest and are presented as median
and interquartile range (IQR). The assumption of normality for each variable previously
mentioned was assessed by performing a Shapiro-Wilk test, assessment of skewness and
kurtosis, and visual inspection of histograms. As none of the variables met the criteria for
normal distribution, non-parametrical statistics were applied. For the biomechanical
differences between the shoes, the Wilcoxon Signed-Rank Test was used, while correlations
were analyzed using the Spearman’s Rank Correlation Coefficient. This was conducted by
using the difference in the biomechanical variable between the shoes as the dependent
variable and either the anthropometrical or neuromuscular variable as the independent
variable. The biomechanical difference was calculated by subtracting the value of the non-
AFT shoe from the value of the AFT shoe. The following interpretation of the Spearman’s
Rank Correlation coefficient was used: < 0,3 was poor association, 0,3 - 0,5 fair association,
0,6 - 0,7 moderate association, 0,8 - 0,9 very strong association (Akoglu, 2018). The level of
significance was set at p ≤ 0,05. All statistical analyzes were performed with SPSS Statistics
version 28.0.1.1 (IBM Corp., Armonk, NY, USA).

 20
3 Results
3.1 Biomechanical Differences
There were no significant differences between the AFT and non-AFT shoes for any of the
biomechanical variables. The median and p-values showed a tendency for differences,
although not significant, in ground contact time and ankle propulsive power indicating longer
contact time and less work done at the ankle joint with the AFT shoe. The complete
biomechanical data are shown in Table 3.1.

 Table 3.1. Biomechanical measures for each shoe.
 AFT non-AFT Significant
 Median (IQR) Median (IQR) difference (p-
 value)
 Contact time s 0,210 (0,006) 0,208 (0,007) 0,075
 Step Length m 1,480 (0,168) 1,475 (0,114) 0,484
 Knee Absorption Power W/kg 24,7 (15,2) 25,1 (6,3) 0,401
 Ankle Propulsive Power W/kg 14,3 (1,6) 14,6 (1,9) 0,123
 s = second, m = meter, W = Watt

Furthermore, we sought to explore some of the individual differences between the shoes from
the observable data (Table 3.2). These showed that contact time and step length were greater
in the AFT shoe for most participants, with #1 and #3 showing a shorter contact time and
decreased step length. However, the differences were small for contact time where the largest
difference was 6,7 ms for participant #6. Step lengths were more variable with participant #6
running with, on average, almost 10 cm shorter step length with the AFT shoe while
participant #7 ran with approximately 5 cm longer steps. For knee absorption power, two
participants decreased their power substantially with the AFT shoe. Participant #1, for
instance, decreased his knee absorption power with 35 % while participant #5 decreased his
power with 23 %. The two participants, #2 and #4, that increased their knee absorption power,
increased it with 10 %. Finally, most participants reduced their ankle propulsive power with
the AFT shoes by an average of 9 % (± 8 %). Participant #2 and #3 increased their ankle
propulsive power with the AFT shoe by 1 % and 3 % respectively.

 21
Table 3.2. Individual differences for each participant comparing the biomechanical measures
 between the shoes. The difference was calculated by subtracting the measured value of the AFT
 shoe against the non-AFT shoe.
 Participant Contact time (s) Step Length (m) Knee Absorption Ankle Propulsive
 Power (W/kg) Power (W/kg)
 #1 0,0000 - 0,0106 - 7,9886 - 3,5774
 #2 0,0025 0,0349 3,3417 0,1671
 #3 - 0,0008 0,0378 - 1,8157 0,5157
 #4 0,0008 0,0269 3,0740 - 0,6034
 #5 0,0058 0,0008 - 5,4109 - 0,1245
 #6 0,0067 - 0,0979 - 1,9706 - 2,5229
 #7 0,0042 0,0456 0,3289 - 2,1368
 #8 0,0000 - 0,0093 - 1,2192 - 0,0809
 The numbers marked in bold text represent the measurements where the non-AFT shoe was greater
 than the AFT shoe.

3.2 Association with Individual Characteristics
When comparing the correlations between the individual characteristics of the runners and the
biomechanical difference between the shoes, only two of the independent variables were
found to significantly correlate with the corresponding biomechanical variable. Peak power
during the squat was shown to have a very strong negative correlation with peak knee
absorption power (r = -0,905, p = 0,005). This means that those who produced greater power
during the squat, reduced their knee absorption power more with the AFT shoe (fig. 3.1). The
two participants who produced the lowest peak power during the squat, were also those who
increased their knee absorption power with the AFT shoe compared to the non-AFT shoe.
Furthermore, vertical stiffness during jumping was found to be moderately negatively
correlated with step length (r = -0,738, p = 0,046), meaning that participants with lower
stiffness, increased their step length more in the AFT shoe (fig. 3.2). The three participants
who took longer steps with the non-AFT shoe, were also those with the highest vertical
stiffness during jumping.

 22
You can also read