India Water Resources Profile Overview - WATER RESOURCES PROFILE SERIES
←
→
Page content transcription
If your browser does not render page correctly, please read the page content below
WATER RESOURCES PROFILE SERIES
The Water Resources Profile Series synthesizes information on water resources, water quality, the water-related
dimensions of climate change, and water governance and provides an overview of the most critical water resources
challenges and stress factors within USAID Water for the World Act High Priority Countries. The profile includes: a
summary of available surface and groundwater resources; analysis of surface and groundwater availability and quality
challenges related to water and land use practices; discussion of climate change risks; and synthesis of governance
issues affecting water resources management institutions and service providers.

India Water Resources Profile Overview
          India is one of the most water stressed countries in the world. Per capita annual freshwater availability (1,427
          m3) is lower than the Falkenmarki threshold for water stress and 66 percent of water resources are abstracted.ii
          Approximately 31 percent of India’s water resources originate in neighboring countries. Water is abundant in the
          lower reaches of the Ganges River Delta in the east but deficits are common in the northwest, west, and south
          depending on timing and course of summer and winter monsoons.

           Total water demand is projected to exceed renewable supply in almost every state by 2030. Growing water
           stress may significantly impact agricultural output, particularly in the northwest, and cause significant economic
           losses.

           Insufficient water storage and poor reservoir management threaten municipal water supply, particularly in
           periods of drought. Shortages are worsened by high groundwater abstractions that reduce base river flow,
           watershed deforestation and degradation, and concentrated demand in urban areas.

           Lack of municipal wastewater treatment has led to microbial contamination and reduced dissolved oxygen in
           many rivers. This has impacted ecosystems and biodiversity, particularly in the Yamuna (Delhi), Cooum (Chennai),
           and the Mithi Ulhas rivers (Mumbai).

           Groundwater use is unsustainable in many cities and agricultural areas. Aquifer depletion is most rapid in
           northwestern India. Declining groundwater levels threaten livelihoods in rural communities and urban water
           supply.

           Fluoride (northwest and south) and arsenic (lower reaches of the Ganges Basin) are naturally occurring in
           groundwater. High salinity (northwest) is also natural and caused by flood irrigation and over-pumping coastal
           aquifers. Heavy metal contamination in urban areas derives from industrial and municipal waste.

          Climate change is increasing the frequency and scale of severe droughts, particularly in the northwest and south.
          Glacial melt and more intense monsoon precipitation will contribute to landslides and severe flooding in the
          northern highland areas and the lower reaches of the Ganges and Brahmaputra Basins. Flood risks are severe
          and cause over $7 billion in losses each year.

          India has a strong federalist system in which states have primary domain over water allocation and water
          use within their territories. State policies are not always legally or practically compatible, which can impede
          integrated water resources management. States are not obligated or incentivized to employ IWRM approaches.

iThe Falkenmark Water Stress Index measures water scarcity as the amount of renewable freshwater that is available for each person each year. A
country is said to be experiencing water stress when water availability is below 1,700 m3 per person per year; below 1,000 m3 is considered water
scarcity; and below 500 m3 is absolute or severe water scarcity.
iiSDG 6.4.2 measures water stress as the percentage of freshwater withdrawals against total renewable freshwater resources. The water stress thresholds

are: no stress 100%.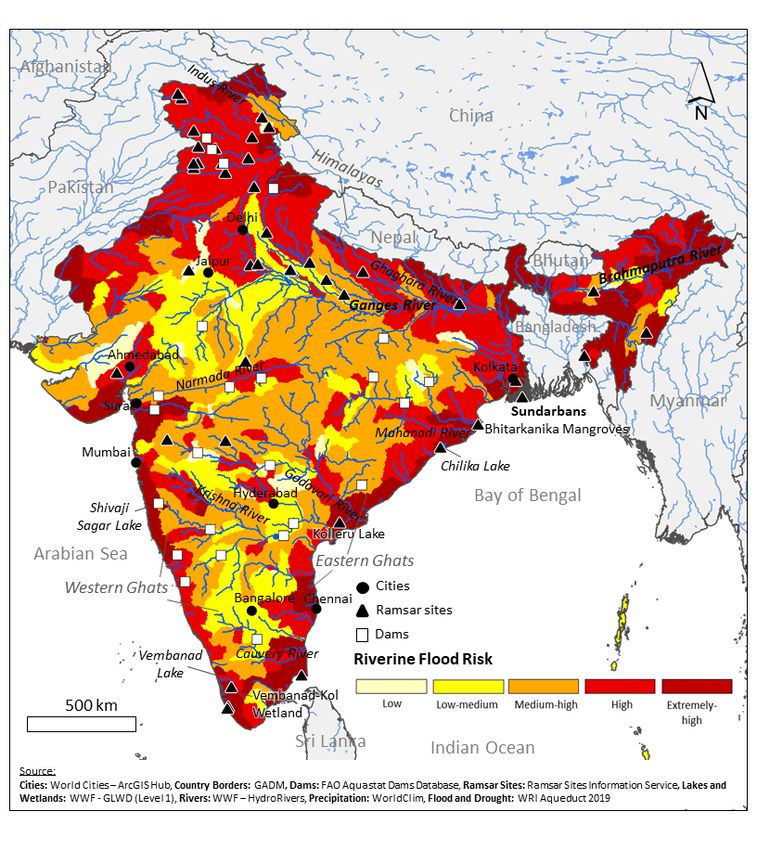
Water Resources Availability
KEY TAKEAWAYS
Water availability is seasonally and regionally variable, and is influenced by the intensity, timing, and duration of summer and winter
monsoons.
60 percent of India’s renewable surface water derives from the Ganges and Brahmaputra Basins.
Alluvial aquifers cover one-third of India throughout the Indo-Gangetic Plain and contain half of India’s renewable groundwater
resources.
This section summarizes key characteristics of surface and groundwater resources. Table 1 summarizes key water
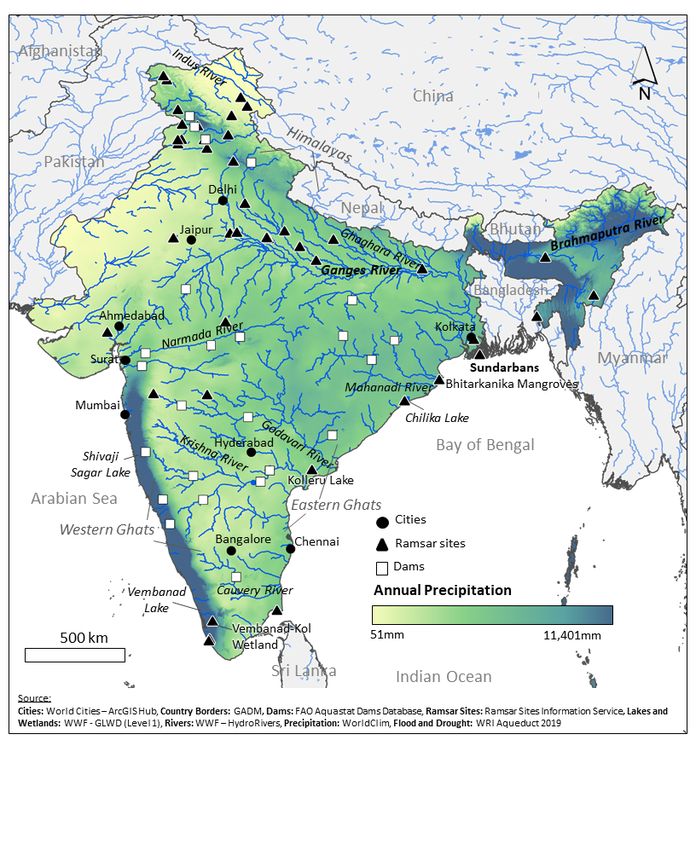
resources data and Figure 1 presents key surface water resources, wetlands, and dams.
Surface Water Resources
India divides its surface water into 22 basins. The Ganges, Krishna and Godavari Basins, which provide 10 percent of
Indus, Godavari, and Brahmaputra Basins cover more India’s renewable water.11
than half the country.9 The Ganges and Brahmaputra
Basins have headwaters in the Himalayas and are part of The summer monsoons (June-September) provide 60 to
the transboundary Ganges-Brahmaputra-Meghna Basin 90 percent of annual precipitation and sustain river flows
which outlets through the Ganges Delta.10 Almost 60 at lower elevations.16–19 River flow in highland areas of
percent of India’s renewable water is in the Ganges and the Indus, Ganges, and Brahmaputra Basins is sustained
Brahmaputra Basins.11 However, only 37 percent of the by melting snowpack and glaciers. There are more
water is exploitable.12 High volume and rapid flows into than 4,000 glaciers in the upper Ganges Basin alone.20
the Bay of Bengal during the summer monsoons are hard Snowpack and glacial melt constitute between 50 and
to store and almost none of the flow in the Brahmaputra 75 percent of total highland river flows and are a critical
Basin is considered usable. 13,14 The Ganges is the resource in the Himalayan foothills.19
longest river (2,500 km) and flows across 11 states. 15
The Indus Basin does not contribute much to India’s India’s has over 1,000 large and medium-sized lakes
total renewable water supply, but its flows are critical to and reservoirs. The largest freshwater reservoirs are
downstream water users in Pakistan. Many rivers within the Shivaji Sagar, Indira Sagar, and Sardar Sarovar.21
the Indus Basin are seasonal and terminate in seasonal Prominent brackish lakes include the Vembanad, Chilika,
salt marshes called the Rann of Kutch in the Thar Desert. and Pangong. The Sundarbans wetlands near the Ganges
The Western Ghats coastal mountain range form the River Delta contains one of the largest mangrove forests
upper catchments of numerous river basins, including the in the world.22
TABLE 1. WATER RESOURCES DATA Year India South Asia (Median)
Long-term average precipitation (mm/year) 2017 1,083 1,712
Total renewable freshwater resources (TRWR) (MCM/year) 2017 1,911,000 210,200
Falkenmark Index - TRWR per capita (m3/year) 2017 1,427 2,529
Total renewable surface water (MCM/year) 2017 1,869,000 210,200
Total renewable groundwater (MCM/year) 2017 432,000 20,000
Total freshwater withdrawal (TFWW) (MCM/year) 2010 647,500 12,950
Total dam capacity (MCM) 2005 224,000 17,144
Dependency ratio (%) 2017 30.52 5.71
Interannual variability 2013 1.7 1.30
Seasonal variability 2013 4.2 3.55
Environmental Flow Requirements (MCM/year) 2017 937,100 83,790
SDG 6.4.2 Water Stress (%) 2010 66.49 15.67
Source: FAO Aquastat
2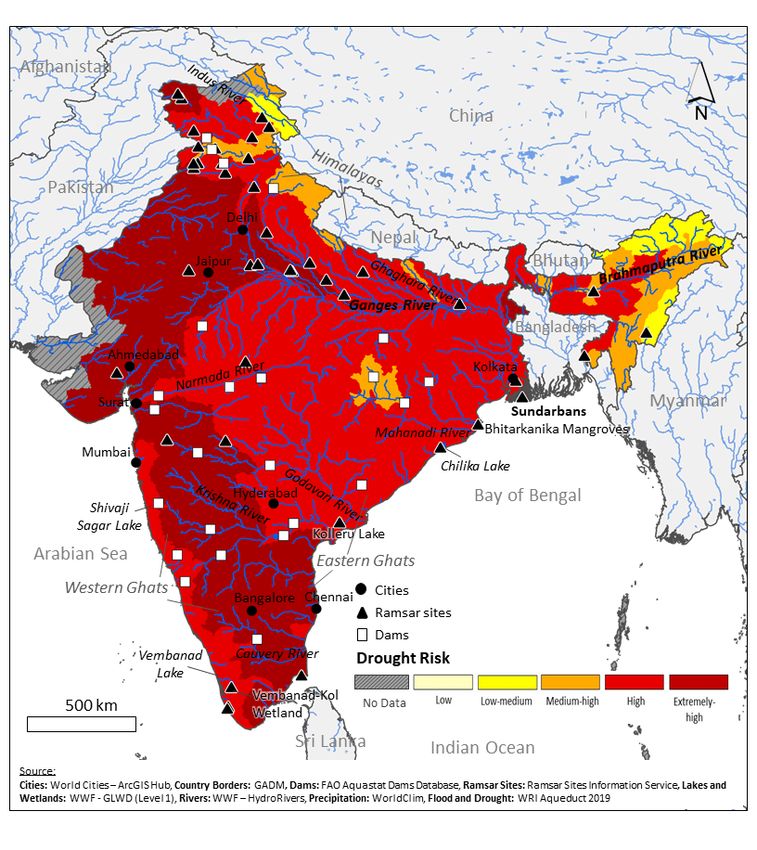
FIGURE 1: MAP OF WATER RESOURCES

Groundwater Resources                                        have variable hydrogeologic properties that depend on
Groundwater is classified into 14 principal systems          the degree of fracturing.24 Groundwater in consolidated
that are further subdivided into 42 major aquifers.23        aquifers is accessible at shallow depths but storage
Most of these aquifers can be broadly characterized          capacity within these aquifers is generally low.25 Deeper,
as consolidated and unconsolidated for mations.              potentially more productive aquifers can be found in
Groundwater availability is more consistent and robust in    some locations, but drilling costs are high and drilling
unconsolidated formations.                                   success rates are variable as borehole depths can range
                                                             between 60 to 100 meters.24
Consolidated, hard rock aquifers underlay the two-thirds
of India in the central and southern regions. The aquifers

                                                                                                                          3
Aquifers in the unconsolidated formations contain roughly aquifers have greater storage capacity and support high
half of all renewable groundwater in lowland areas, well yields.25 The depth to water table in northwestern
along parts of the eastern coastline, and in a broad band India is more than 40 meters and is less than 10 meters
across the Indo-Gangetic Plain in northern India.25 These throughout the eastern Indo-Gangetic Plain.26
Surface Water Outlook
KEY TAKEAWAYS
Canal and flood irrigation contribute to inefficient and unsustainable use of surface water. Base flow rates in many rivers are also
decreasing due to over-abstraction, drought, and degradation of spring sources.
Several large cities, especially in the south and west, are vulnerable to drought and reduced flows due to poor reservoir management
and low storage capacity. The Ganges and Brahmaputra Basins are at risk of severe flooding during monsoons.
Aquatic biodiversity in wetlands is vulnerable to upstream hydraulic development, water quality threats, and reductions in river flow
rates.
Municipal and agricultural waste are depleting surface waters of dissolved oxygen, particularly downstream of cities in the dry season.
Industrial effluent are contaminating surface waters with heavy metals, surfactants, and pesticides.
This section describes key sources of demand and uses of surface water, and associated challenges stemming
from water availability and water quality challenges.
Irrigation accounts for 90 percent of all freshwater River base flow rate has declined 59 percent over the
withdrawals, and over 60 percent of the withdrawals past few decades in some of its lower reaches.40 Similarly,
are from surface water.5 Surface water for irrigation deforestation, fires, and land use changes, among
is generally conveyed through extensive canals in the other factors have reduced spring outflows throughout
Ganges Basin in the states of Uttar Pradesh, Madhya India, especially in the Western and Eastern Ghats and
Pradesh, Haryana, and Bihar. 5,27,28 Urban municipal Himalayan regions. 41 Urbanization and agriculture in
water services rely on surface and groundwater, although the Krishna Basin have reduced forest cover to only 3
surface water abstractions are slightly higher. In rural percent, increased flooding, degraded water quality, and
areas, groundwater is the main water source for domestic increased sedimentation in dams.42 In the Himalayan
use. 30,31 Industry accounts for only two percent of regions, 15 percent of the population depend on springs,
total withdrawals. 5,32 There are also numerous non- which periodically dry up. Around half of all springs in the
consumptive surface water uses including hydropower region have reduced outflows.43
generation (10 percent of total power generation) and
transportation and shipping through over 5,000 km of Poor reservoir management and low storage capacity
navigable rivers.33,34 threaten municipal water supply in several major
cities, especially in the southern peninsula and the
Over-abstraction and inefficient irrigation, primarily west. Two-thirds of national storage capacity are held
of rice and wheat, threaten surface water availability, in 123 major reservoirs but their capacity fluctuates
economic growth, and food security. Since the 1960s, between 20 and 70 percent between June and October
India’s “Green Revolution” more than quadrupled due to seasonal water availability.44 Low storage capacity
irrigated croplands.35 This has increased water stress and worsened by sedimentation from upstream land use
jeopardized economic development and food security.1 changes and poor reservoir operations compound these
Canal distribution systems and flood and furrow irrigation fluctuations. Lower than average monsoon rainfall and
systems are only 35-45 percent efficient 36 and water low reservoir storage capacity have resulted in water
stress from these losses may contribute to a more than crises in several major cities, including Bangalore,
6 percent decline in GDP by 2050. 2 India’s National Hyderabad, Delhi, and Chennai, which experienced acute
Water Mission aims to increase water use efficiency by 20 water shortages during a 2016-2019 drought. In 2019,
percent and promote micro-irrigation systems.39 Chennai suspended municipal water distribution urban
residents as its reservoirs dried up.45
Declining base flow rates are reducing dry season
flows and impacting irrigation, ecosystems and Monsoon flooding is a key risk to agriculture,
biodiversity, and municipal use, especially in the infrastructure, economic growth, and human health.
Ganges, Cauvery, Narmada, and Mahanadi Rivers. Approximately 12 percent of India faces high risk of
Reduced base flow rates are caused by unsustainable flooding, particularly in the states of Assam, Bihar, Orissa,
groundwater abstraction, more intense and frequent Uttar Pradesh, and West Bengal.46 Floods cost almost $7
drought, and degraded headwater springs. The Ganges billion per year and routinely cause massive loss of human
4life.4 In 2019, monsoon flooding killed 1,800 people, from erosion and siltation caused by illegal in-stream
destroyed infrastructure and cropland, and displaced of sand and gravel mining.59 These have threatened aquatic
1.8 million people.47 Flood management strategies have life by depleting oxygen levels. 60 Dissolved oxygen
focused on infrastructure, including the construction of in portions of the Yamuna (near Delhi), Cooum (near
dykes, although there is a need for improved technical Chennai), and Mithi and Ulhas Rivers (both in Mumbai)
capacity, flood forecasting and warning outreach, and have been found to be too low to support aquatic life.61
better land use planning and flood plain mapping.4,48
Expanding urban slums that encroach on flood plains and Heavy metals and surfactants from industrial waste
along the coast are vulnerable, particularly in cities like threaten public health. Heavy metals in surface water
Mumbai.49 include cadmium, chromium, and lead at concentrations
that exceed WHO guideline limits for drinking water.
Wetland and riverine biodiversity are threatened These are likely derived from diverse sources of industrial
by decreasing inflows of freshwater, surface water waste. Notably, lead concentrations exceeded WHO
abstraction for municipal and agricultural purposes, guideline limits for drinking water by more than 20
and drought. India has over 700,000 wetlands, including percent in approximately 70 rivers.62
37 official Ramsar Sites which span over a million
hectares. 22,50 The five largest Ramsar Sites include Agrochemical contamination is particularly high in
the Sundarbans (423,000 hectares (ha)), Vembanad- the Ganges Basin, threatening water quality and
Kol (151,250 ha), Chilika Lake (116,500 ha), Kolleru human health. Concentrations of numerous pesticides,
Lake (90,100 ha), and Bhitarkanika Mangroves (65,000 including malathion, are several times higher than WHO
ha).51 Dams reduce river flows to downstream brackish guideline limits for drinking water in the lower reaches
wetlands and estuaries 52 and droughts have caused of the Ganges Basin in West Bengal.63 Organochlorine
relatively large rivers, such as the Ken in central India, to pesticides constitute up to 70 percent of all pesticides
dry up.53,54 Declining flow rates in the Ganges River have used. These pesticides present serious threats to
increased salinity in the Delta.55 The recently approved water quality and public health as they persist in the
National Waterways Act, which calls for expanded fluvial environment and are neurotoxic.64
transportation capacity, will affect 90 percent of the
Ganges River Dolphin’s habitat and may further strain its Open cast mines, particularly in the Western Ghats,
population without appropriate mitigation measures.56 threaten surface water quality and biodiversity.
Heavy tropical rainfall can rapidly disperse mine tailings
Widespread discharge of untreated municipal waste and increase siltation of watercourses, increasing the
and agricultural runoff have reduced dissolved oxygen risk of landslides and reducing downstream reservoir
(DO) threaten aquatic ecosystems and biodiversity. capacity. Most of the Western Ghats may soon attain
Over 38 million liters of untreated municipal sewage are protected status, although 15 percent of the proposed
discharged directly into the environment each day.57,58 ecologically sensitive area may be reserved for mining
Watercourses are also heavily polluted with solid waste, and industry.65–67
particularly downstream of urban areas, and can suffer
Groundwater Outlook
KEY TAKEAWAYS
Aquifers in northwestern India are severely overexploited and unsustainable groundwater abstraction will affect most states by 2030.
Domestic wells in many cities such as Chennai and Delhi face declining water levels and in some cases have run dry during drought.
Natural contamination in groundwater widespread. Arsenic is found within the Indo-Gangetic Plain and high salinity occurs naturally
and is caused by flood irrigation and over pumping.
Poor sanitation systems, heavy metal contaminants from industry, and fertilizers and pesticides threaten public health and degrade
groundwater quality.
This section describes key sources of demand and uses of groundwater, and associated challenges stemming from
water availability and water quality challenges.
Total freshwater demand is projected to exceed supply source for municipal systems but is used to supplement
by as much as 50 percent by 2030 due to increased surface water supply. Over 20 percent of urban residents
demand for groundwater.3 Groundwater abstractions are obtain water through private or community wells and
mostly for irrigation, especially in the Ganges Basin and groundwater is the primary source of drinking water in rural
the northwest, and constitute 60 percent of total irrigation areas.70 Over one-third of industrial withdrawals are from
withdrawals.1,5,68,69 Groundwater is a relatively minor water groundwater, although total withdrawals are low compared
5to other sectors. 30 Groundwater overexploitation is Ganges Basin in West Bengal, Bihar, and Jharkhand and
widespread and conditions are expected to worsen also in Uttar Pradesh and Delhi.31
nationwide.73 The crisis is most severe in the northwest,
particularly in Punjab, where total abstractions exceed Saline groundwater is naturally present in many
recharge by over 65 percent. 74,75 If trends continue, locations but is worsened by over pumping in coastal
Punjab’s groundwater will be fully depleted in most aquifers and flood irrigation. Groundwater salinity is
locations by 2040.74 high in the northwest and in the south from natural and
anthropogenic sources.84 For example, soil salinization has
Poor management, high demand, and drought threaten affected approximately 10 percent of the cultivated areas
groundwater availability in urban areas throughout in Haryana (northwest).85 Over-pumping of coastal aquifers
India, particularly in southern India and in Delhi. has also led to saline intrusion in Mumbai.86
Declining groundwater has been observed in major cities
throughout southern India.77 Wells in Chennai dried up Untreated wastewater, agrochemicals, and industrial
after the 2019 drought, which coincided with municipal wastes such as lead, chromium, and cadmium threaten
reservoirs becoming depleted.78 Groundwater in Delhi has public health and groundwater. Elevated nitrate
declined 0.5 to 2 meters annually, threatening domestic concentrations can be found in groundwater in more
water sources for many residents.79 than half of India’s administrative districts.81,84 Nitrates
are attributed to inadequate sanitation systems, including
Natural contamination from fluoride is widespread and septic systems and latrines, that allow wastewater to
naturally-occurring arsenic can be found across the Indo- infiltrate directly into groundwater and agricultural
Gangetic Plains. Fluoride is one of the largest sources of fertilizers. Lead, chromium, and cadmium can also be
contamination nationally, with the highest concentrations found at high concentrations and are likely the tied to
being in the northwest and in the south.23,80 Fluoride industrial and solid waste.81 Chromium contamination has
can be found in excess of WHO guidelines in nearly half been linked to tanneries and chromium ore processing.87
of India’s districts and has been implicated in fluorosis Cadmium concentrations are also consistently high, up
afflicting over 60 million people.81–83 Over 10 million to 20 times WHO guideline limits for drinking water, in
people are also exposed to concentrations of arsenic western Uttar Pradesh due to the processing electronic
in groundwater, particularly in the lower reaches of the wastes.88
Water Resources and Climate
KEY TAKEAWAYS
Climate change will lead to higher total precipitation and increased rainfall intensity, but the frequency and spatial extent of droughts
will increase, particularly in northwestern and southern India.
Flood risks will increase due to heavy rainfall and melting glaciers, threatening highland populations with natural disaster. Coastal
cities, particularly in the Bay of Bengal, are threatened by rising sea levels and more frequent cyclones.
This section covers climate variability and climate change, their impacts on water availability and water quality, and
the risks they pose to local communities and their economies.
Rising temperatures will increase evaporation, but Droughts will become more frequent and impact larger
precipitation is projected to increase. India’s climate is areas, especially in the northwest and south where
highland in the north, arid in the west, and tropical or sub- risks are already high. Approximately 16 percent of
tropical in all other locations.7 Summer and winter monsoon India is considered drought prone. The area susceptible
seasons are critical for replenishing water resources. The to drought is expected to grow by 150 percent, primarily
summer (southwestern) monsoon generates 80 percent in northern, northwestern, and southern India. 92,93
of the total precipitation. The summer (northeastern) Overall, the frequency of severe droughts is expected to
monsoon provides most of the precipitation in the increase between 10 to 15 percent nationwide,90 while the
coastal southeast. Average temperatures have increased frequency of rapid onset “flash droughts” may increase
0.6 °C of over the past century and projections suggest seven-fold by the end of the century.94
temperatures will increase 2-4°C later this century.89,90 Total
annual precipitation and summer monsoon rainfall have Increased temperatures will accelerate melting of
decreased in recent decades, although projections suggest snowpack and glaciers in highland areas and increase
precipitation gains between 61 and 110 mm/year.90,91 flooding. Cyclones and sea level rise will threaten the
Warmer temperatures and higher evaporation rates may coastal communities and groundwater quality. The
offset these increases.90 percent of total precipitation from extreme rainfall events
6is expected to increase between 30 and 48 percent. precipitation threaten coastal cities with increased flooding,
Increases will be highest in the Brahmaputra Basin, which is especially Mumbai, Chennai, Kolkata, and Surat.97,98 It is
already vulnerable to flooding.90,95 In 2013, one of India’s projected that cycles will be more frequent and intense
worst floods occurred when a glacial lake outburst flood in the Bay of Bengal.99,100 Cyclone Phailin caused over
(GLOF) in Uttarakhand killed thousands of people and $4 billion in crop damage throughout Orissa in 2013 and
caused extensive damage and in 2021, a collapsed glacier Cyclone Amphan flooded West Bengal in 2020 and caused
destroyed a dam.96 Rising sea levels and heavy monsoon over $13 billion in damage.101,102
FIGURE 2: DROUGHT RISK FIGURE 3. RIVERINE FLOOD RISK
Water Policy and Governance
KEY TAKEAWAYS
India has a strong federalist system in which states have primary domain over water allocation and water use within their territories.
State policies are not always legally or practically compatible, which can impede integrated water resources management. States are
not obligated or incentivized to employ IWRM approaches.
Key water resource management decisions and hydraulic developments are often determined through top-down planning, including
national-level infrastructure such as the Indian Rivers Inter-link project which will significantly alter inter-state and international river
flows.
This section provides an overview of key policies, institutions, and management challenges. Key laws, policies,
and plans are summarized in Table 2 and the roles and responsibilities of select transboundary, national, and sub-
national water management entities are summarized in Table 3.
States have heterogeneous water laws and policies Inter-state coordination in IWRM is limited despite
that vary in enforceability and compatibility. State- efforts to promote cooperation. Key bills and
level IWRM approaches do not always align with the amendments (see Table 2 above), such as the proposed
NWP.108 India has a strong federalist system in which River Basin Management Bill and the Dam Safety
states have primary domain over water allocation and Bill, seek to address inter-state cooperation but they
water use within their territories. National “model” water have been criticized for potentially curtailing state
laws and policies are intended to provide a common authority.113,114 Only a few River Boards exist but they
vision for state-level water governance. The NWP were established through water dispute tribunal decisions
espouses IWRM basin-planning and encourages multi- and independent legislative acts, rather than through
sectoral coordination among relevant entities. Only 16 state-led initiatives. 110 Water dispute adjudication
out of 36 states and territories have aligned their water processes disincentivize states from participating in inter-
policies with the NWP, which was approved in 2012. state River Boards because under the current framework
Coordination among key water sector entities at the a member state of a River Board cannot file a dispute
state-level is variable and generally limited.109 without the consent or participation of other member
7states.110 Water disputes between states are common, deficits, was ultimately greenlighted by the Supreme
particularly as they relate to water allocation and sharing Court in 2015.115,116 This project will involve building
arrangements.111 For example, the national Indian Rivers 3,000 new reservoirs and could submerge 2.7 million
Inter-link project, which will transfer surface water via hectares and displace 1.5 million people.117
canals from areas with surplus resources to areas with
TABLE 2. KEY LAWS, POLICIES, AND PLANS
Name Year Purpose
National Water Policy 2012 “Model bill”iii outlining integrated water resources management. Clarifies
(NWP) institutional framework, sector roles, responsibilities, and priorities. Policy is
currently being revised by the Ministry of Jal Shakti to emphasize the role of
public-private partnerships in water management and the creation of a “model”
national water law.
River Board Act 1956 Provides legal mechanism for states to organize interstate River Boards to govern
water resources across state lines.
River Basin Management 2019 (approved) Intended to replace the 1956 River Board Act. Establishes 13 transboundary river
Bill basin authorities (including the Ganges, Indus, Godavari, and Cauvery Basins) to
develop basin management master plans with a two-tier governance structure
composed of a Governing Council and an Executive Board. Approved but
pending enactment.
Dam Safety Bill 2019 (approved) Shifts power from the states to the federal government to manage larger
reservoirs. Approved, but pending enactment.
Inter-State Water 2019 (approved) Amends original bill enacted in 1956. Establishes clear and expedited timelines
Disputes Tribunal Bill for resolving water disputes among states through dispute resolution committees
and a single, permanent tribunal for all disputes. Approved, but pending
enactment.
Act for the Conservation, 2016 Builds on several prior “model” groundwater bills. Recommends the
Protection, Regulation establishment of groundwater protection zones and security plans, institutional
and Management of frameworks for groundwater monitoring and management, permitting, and
Groundwater environmental impact assessments.
Tr a n s b o u n d a r y a g re e m e n t s a n d m a n a g e m e n t regularly by the CWC at over 500 testing locations
i n s t i t u t i o n s d o n o t a l l o w f o r c o m p re h e n s i v e covering all major river basins covering 67 main rivers and
management of international waters. The Ganges numerous tributaries.121 These surface water monitoring
Water Sharing Treaty between India and Bangladesh, stations routinely monitor basic physiochemical parameters
which is slated to expire in 2026, does not employ a (including dissolved oxygen), however, microbial testing
basin-wide approach118 and Bangladesh does not always and more comprehensive chemical studies are conducted
receive the minimum required flows as defined by the as needed at numerous regional laboratories. The CPCB
Treaty.119 India is not party to any water sharing treaties recently deployed a real-time water quality network in the
with China, Bhutan, and Bangladesh for the Brahmaputra Ganges Basin capable of monitoring 10 key parameters.122
Basin, although several bilateral and multilateral The CGWB manages a network of 23,000 observation
memoranda of understanding and working groups have wells from which samples are obtained quarterly and
been established related to hydropower development. analyzed.123 Three quarters of CGWB samples analyzed
India is a signatory to the Indus River Treaty with in the most recent reporting period were only analyzed
Pakistan and the Mahakali Treaty with Nepal, however,
for basic chemical constituents while most remaining
coordination remains limited.
samples were also tested for trace elements such as heavy
metals.123 Low technical capacity of SPCB staff impedes
Water Quality Monitoring
enforcement of permits and often results in non-compliance
Surface and groundwater quality data is routinely
from industrial polluters.120
collected, consolidated, and publicly disseminated.
The CWC and CGWB monitor surface and groundwater
quality, respectively, while the CPCB (through SPCBs) also
monitors water quality to verify compliance with effluent
discharge permits. Surface water quality is monitored
iiiAs
national level laws/policy regarding water resources management are non-binding, they are referred to as “models” which may be adopted,
modified, or remain unused by state governments as they deem appropriate.
88TABLE 3. WATER RESOURCES MANAGEMENT ENTITIES
Mandate Institution Roles and Responsibilities
Commission between Pakistan and India that seeks to implement the
Permanent Indus Commission (PIC) Indus Water Treaty and coordinate development and management
of hydraulic infrastructure.
Transboundary
Commission between Bangladesh and India that implements
Joint River Commission (JRC) the Ganges Water Sharing Treaty by coordinating water sharing,
irrigation development, and flood control projects.
Established in 2019, manages and develops water resources through
national, regional, or state offices. Supports several corporate,
Ministry of Jal Shakti statutory, and autonomous bodies, including river boards. There
are two departments responsible for bulk management of water
resources in river basins and water and sanitation service delivery.
Attached office within the Ministry of Jal Shakti. Houses the National
Water Development Agency (NDWA), which develops design and
feasibility reports for the decades-old national Indian Rivers Inter-link
Central Water Commission (CWC) project. Provides technical support to state governments to regulate,
conserve, and utilize water resources through flood control projects,
irrigation services, and drinking water supply systems. Monitors
surface water quality.
Regulates and manages groundwater abstractions and development
Central Ground Water Authority (CGWA)
through permitting.
Subordinate office within the Ministry of Jal Shakti. Leads
National groundwater exploration and mapping, conducts water balance
Central Ground Water Board (CGWB)
assessments and projections for aquifers, evaluates and proposes
groundwater recharge projects, and monitors groundwater quality.
Executive body that approves model national water policy. Chaired
National Water Resources Council (NWRC) by the Prime Minister and composed of state and national-level
ministers.
Lead ministry in charge of water service delivery. Also supports water
Ministry of Housing and Urban Affairs
quality monitoring, water balance studies, and aquifer management.
Provides technical consultation to the NWRC during the review and
approval process of water policy. Led by the Secretary of the Ministry
The National Water Board (NWB)
of Jal Shakti and secretaries from related line ministries as well as
chief secretaries of states and territories.
Houses the Central Pollution Control Board (CPCB), which
The Ministry of Environment and Forests coordinates the State Pollution Control Boards (SPCB). SPCBs
of India (MOEF) develop and enforce environmental regulations for effluent discharge
by issuing discharge permits and monitoring for compliance.
Responsibilities are program/project-specific, such as flood control,
hydropower generation, and reservoir and hydraulic infrastructure
River Boards
operation and maintenance. Focus on program implementation and
infrastructure management within state boundaries.
Wields independent authority to develop state-level water law and
State Governments policy. National-level water laws and policies are non-enforceable
Sub-national models to guide state laws and policies towards a common vision.
Judicial bodies that are constituted on demand to adjudicate water
Water Dispute Tribunals
disputes among states.
Organizations composed of farmers that support operations and
Water Users Associations (WUA) management of public irrigation systems to ensure equitable access
and sustainability.
9References
(1) Jain, M.; Fishman, R.; Mondal, P.; Galford, G. L.; Bhattaral, N.; Naeem, S.; Lall, U.; Singh, B.; DeFries, R. S. Groundwater Depletion Will Reduce Cropping Intensity in India. Sci. Adv. 2021, 7.
(2) World Bank Group. High and Dry : Climate Change, Water, and the Economy; Washington, D.C., 2016.
(3) 2030 Water Resources Group. Charting Out Water Future- Economic Frameworks to Inform Decision-Making; 2009.
(4) Mohanty, M. P.; Mudgil, S.; Karmakar, S. Flood Management in India: A Focussed Review on the Current Status and Future Challenges. Int. J. Disaster Risk Reduct. 2020, 49. https://doi.org/https://
doi.org/10.1016/j.ijdrr.2020.101660.
(5) FAO. Aquastat Main Database http://www.fao.org/nr/water/aquastat/data/query/results.html (accessed Jul 8, 2020).
(6) FAO; UN Water. Clean Water and Sanitation - Progress on Level of Water Stress; 2018.
(7) USAID. Climate Risk Profile India; 2018. https://doi.org/https://hdl.handle.net/10568/80457.
(8) Brittanica. Cherrapunji: India https://www.britannica.com/place/Cherrapunji (accessed Sep 17, 2020).
(9) WRIS. River Basin Report Download https://indiawris.gov.in/wris/#/Basin (accessed Sep 16, 2020).
(10) FAO. Ganges-Brahmaputra-Meghna Geography, population and climate http://www.fao.org/nr/water/aquastat/countries_regions/profile_segments/gbm-GeoPop_eng.stm (accessed Sep 16,
2020).
(11) Amarasinghe, U.; Sharma, B.; Aloysius, N.; Scott, C.; Smakhtin, V.; de Fraiture, C. Research Report 83: Spatial Variation in Water Supply and Demand across River Basins of India; Colombo, 2005.
(12) FAO. Country Profile- India; 2015. https://doi.org/10.1787/b0801bd1-en.
(13) ADRI. India Water Facts https://www.adriindia.org/adri/india_water_facts (accessed Sep 18, 2020).
(14) Hongzhou, Z. China-India: Revisiting the ‘Water Wars’ Narrative https://thediplomat.com/2015/06/china-india-revisiting-the-water-wars-narrative/ (accessed Sep 18, 2020).
(15) The World Bank. The National Ganga River Basin Project https://www.worldbank.org/en/news/feature/2015/03/23/india-the-national-ganga-river-basin-project (accessed Sep 17, 2020).
(16) Central Water Commission (CWC) & National Remote Sensing Centre (NRSC). Brahmaputra Basin Version 2.0; 2014.
(17) Halpert, M.; Bell, G. Climate Assessment for 1996 https://www.cpc.ncep.noaa.gov/products/assessments/assess_96/toc.html (accessed Sep 17, 2020).
(18) Central Water Commission (CWC) & National Remote Sensing Centre (NRSC). Ganga Basin; 2014. https://doi.org/Version 2.0.
(19) Armstrong, R. L.; Rittger, K.; Brodzik, M. J.; Racoviteanu, A.; Barrett, A. P.; Khalsa, S. J. S.; Raup, B.; Hill, A. F.; Khan, A. L.; Wilson, A. M.; Kayastha, R. B.; Fetterer, F.; Armstrong, B. Runoff from
Glacier Ice and Seasonal Snow in High Asia: Separating Melt Water Sources in River Flow. Reg. Environ. Chang. 2019, 19, 1249–1261. https://doi.org/10.1007/s10113-018-1429-0.
(20) Maurya, A. S.; Shah, M.; Deshpande, R. D.; Bhardwaj, R. M.; Prasad, A.; Gupta, S. K. Hydrograph Separation and Precipitation Source Identification Using Stable Water Isotopes and Conductivity:
River Ganga at Himalayan Foothills. Hydrol. Process. 2011, 25 (10), 1521–1530. https://doi.org/10.1002/hyp.7912.
(21) Srivastava, U.; Desai, D.; Gupta, V.; Rao, S.; Gupta, G.; Raghavachari, M.; Vatsala, S. Inland Fish Marketing in India-Reservoir Fisheries; Concept Publishing Co.: New Delhi, 1985.
(22) Bassi, N.; Kumar, M. D.; Sharma, A.; Pardha-Saradhi, P. Status of Wetlands in India: A Review of Extent, Ecosystem Benefits, Threats and Management Strategies. J. Hydrol. Reg. Stud. 2014, 2,
1–19. https://doi.org/10.1016/j.ejrh.2014.07.001.
(23) CGWB. Aquifer Systems of India; 2012.
(24) Chandra, P. Groundwater of Hard Rock Aquifers of India. In Groundwater of South Asia; Mukherjee, A., Ed.; Springer: Singapore, 2018; pp 61–84. https://doi.org/https://doi.org/10.1007/978-981-
10-3889-1_5.
(25) Jha, B.; Sinha, S. Towards Better Management of Ground Water Resources in India. Water E nergy Int. 2009, 67 (1).
(26) Central Ground Water Board (CGWB). Maps http://cgwb.gov.in/Maps.html (accessed May 14, 2021).
(27) Drishti. Different Irrigation Systems https://www.drishtiias.com/to-the-points/paper3/different-irrigation-systems (accessed Sep 21, 2020).
(28) Anwar, S. Canal Irrigation in India https://www.jagranjosh.com/general-knowledge/canal-irrigation-in-india-1448272174-1#:~:text=irrigated by canals.-,The maximum part of the total irrigated area
of the,%2C Haryana%2C Punjab and Bihar. (accessed Sep 21, 2020).
(29) Jain, R.; Kishore, P.; Singh, D. K. Irrigation in India: Status, Challenges and Options. J. Soil Water Conserv. 2019, 18 (4), 354. https://doi.org/10.5958/2455-7145.2019.00050.X.
(30) FICCI Water Mission. Water Use in Indian Industry Survey; 2011.
(31) Rao. Filtering Through India’s Drinking Water Challenges https://www.waterworld.com/international/desalination/article/16202105/filtering-through-indias-drinking-water-
challenges#:~:text=Sources%2C Supply and Distribution of,rural and urban Indian populations.&text=It is estimated that approximately,excess arse (accessed Sep 21, 2020).
(32) Joseph, N.; Ryu, D.; Malano, H. M.; George, B.; Sudheer, K. P. Estimation of Industrial Water Demand in India Using Census-Based Statistical Data. Resour. Conserv. Recycl. 2019, 149, 31–44.
https://doi.org/10.1016/j.resconrec.2019.05.036.
(33) International Hydropower Association. India https://www.hydropower.org/country-profiles/india (accessed Sep 21, 2020).
(34) CIA. The World Factbook https://www.cia.gov/library/publications/the-world-factbook/fields/386.html (accessed Sep 21, 2020).
(35) Singh, N.; Singh, O. Role of Water in the Success of Green Revolution in India http://www.millenniumwaterstory.org/Pages/Photo stories/Water & Livelihood/Role of Water in the Success of Green
Revolution in India.html (accessed Oct 9, 2020).
(36) Kulkarni, A. A.; Nagarajan, R. Hydrospatial Modelling and Simulations for Assessing the Irrigation Canal Conveyance Losses. Model. Simul. Eng. 2019, 2019. https://doi.org/10.1155/2019/1803748.
(37) Dhawan, V. Water and Agriculture in India Background Paper for the South Asia Expert Panel during the Global Forum for Food and Agriculture; 2017.
(38) Narayanamoorthy, A. Tap drip irrigation to save water https://www.thehindubusinessline.com/opinion/tap-drip-irrigation-to-save-water/article27688289.ece (accessed Oct 9, 2020).
(39) Ministry of Water Resources. National Water Mission under National Action Plan on Climate Change; 2009.
(40) Mukherjee, A.; Bhanja, S. N.; Wada, Y. Groundwater Depletion Causing Reduction of Baseflow Triggering Ganges River Summer Drying. Sci. Rep. 2018, 8 (1), 1–9. https://doi.org/10.1038/s41598-
018-30246-7.
(41) Kumari, R.; Banerjee, A.; Kumar, R.; Kumar, A.; Saikia, P.; Khan, M. L. Deforestation in India: Consequences and Sustainable Solutions. In Forest Degradation Around the World; IntechOpen, 2018.
(42) Gartner, T. Watersheds Lost Up to 22% of Their Forests in 14 Years. Here’s How it Affects Your Water Supply https://www.wri.org/insights/watersheds-lost-22-their-forests-14-years-heres-how-it-
affects-your-water-supply (accessed May 14, 2021).
(43) NITI Aayog. Report of Working Group I Inventory and Revival of Springs in the Himalayas for Water Security; 2018.
(44) CWC. Reservoir Level & Storage Bulletin http://cwc.gov.in/reservoir-storage?page=1 (accessed Oct 9, 2020).
(45) Masih, N.; Slater, J. As a major Indian city runs out of water, 9 million people pray for rain https://www.washingtonpost.com/world/2019/06/28/major-indian-city-runs-out-water-million-people-pray-
rain/ (accessed Sep 21, 2020).
(46) Joshi, H. Floods across the country highlight need for a robust flood management structure https://india.mongabay.com/2020/08/floods-across-the-country-highlight-need-for-a-robust-flood-
management-structure/ (accessed Sep 21, 2020).
(47) Relief Web. India: Floods and Landslides - Jun 2019 https://reliefweb.int/disaster/fl-2019-000084-ind (accessed Sep 21, 2020).
(48) Padma, T. V. New Recommendations for a Proactive Flood Policy in India https://eos.org/articles/new-recommendations-for-a-proactive-flood-policy-in-india (accessed May 14, 2021).
(49) Murthy, S. L. Land Security and the Challenges of Realizing the Human Right to Water and Sanitation in the Slums of Mumbai, India. Health Hum. Rights 2012, 14 (2).
(50) Ramsar. India https://www.ramsar.org/wetland/india (accessed Sep 22, 2020).
(51) Ramsar. Annotated List of Wetlands of International Importance India; 2019.
(52) Sudhish, N. Escalating salinity upsetting wetland ecosystem in Kerala https://earthjournalism.net/stories/escalating-salinity-upsetting-wetland-ecosystem-in-kerala (accessed Sep 22, 2020).
(53) Verma, R. Water storage in major Indian river basins depleting https://www.downtoearth.org.in/news/water/no-basic-facilities-no-vote-say-residents-of-160-villages-63813 (accessed Sep 21, 2020).
(54) Roy, E. India’s latest crisis: 600 million people struggle with drought https://www.lowyinstitute.org/the-interpreter/india-s-latest-crisis-600-million-people-struggle-drought#:~:text=Since 2015%2C
India has been experiencing widespread drought conditions.&text=in the future.-,Today millions of farmers hit by drought and crop (accessed Sep 21, 2020).
(55) Ghosh, S. Gangetic river dolphins in the Indian Sundarbans struggle with swelling salinity https://india.mongabay.com/2019/01/gangetic-dolphins-in-the-indian-sundarbans-struggle-with-swelling-
salinity/ (accessed Sep 22, 2020).
(56) Aggarwal, D.; Kumar, N.; Dutta, V. Impact on Endangered Gangetic Dolphins Due to Construction of Waterways on the River Ganga, India: An Overview. Environ. Sustain. 2020, 3, 123–138.
(57) CPCB. Consolidated Status Report; 2020.
(58) Times of India. 63% of sewage flows into rivers untreated every day: Central .. https://timesofindia.indiatimes.com/city/agra/63-of-sewage-flows-into-rivers-untreated-every-day-Central-Pollution-
Control-Board/articleshow/54531095.cms (accessed Sep 21, 2020).
(59) CPCB. Consolidated Status Report; Delhi, 2020.
(60) CWC. Effect of Time and Temperature on DO Levels in River Waters; 2019.
(61) Chandrashekhar, V. Dying Waters: India Struggles to Clean Up Its Polluted Urban Rivers https://e360.yale.edu/features/dying-waters-india-struggles-to-clean-up-its-polluted-urban-rivers (accessed
Sep 21, 2020).
(62) CWC. Status of Trace & Toxic Metals in Indian Rivers; 2019.
(63) Duttagupta, S.; Mukherjee, A.; Bhattacharya, A.; Bhattacharya, J. Wide Exposure of Persistent Organic Pollutants (PoPs) in Natural Waters and Sediments of the Densely Populated Western Bengal
Basin, India. Sci. Total Environ. 2020, 717, 137187. https://doi.org/10.1016/j.scitotenv.2020.137187.
(64) Agrawal, A.; Pandey, R. S.; Sharma, B. Water Pollution with Special Reference to Pesticide Contamination in India. J. Water Resour. Prot. 2010, 2, 432–448. https://doi.org/10.4236/
jwarp.2010.25050.
(65) National Herald. Plea in Supreme Court seeks to protect Western Ghats as a whole; court issues notice https://www.nationalheraldindia.com/india/plea-in-supreme-court-seeks-to-protect-western-
ghats-as-a-whole-court-issues-notice (accessed Sep 22, 2020).
(66) Chatterjee, B. Exclude 15% of Western Ghats ESA for mining, industries: State requests Centre https://www.hindustantimes.com/mumbai-news/exclude-15-of-western-ghats-esa-for-mining-
industries-state-requests-centre/story-PrnMTA9DyE4pUQXSnyyiIM.html (accessed Sep 22, 2020).
(67) Chatterjee, B. Take action against mining units without clearances on Western Ghats, Centre tells Maharashtra https://www.hindustantimes.com/mumbai-news/take-action-against-mining-units-
without-clearances-on-western-ghats-centre-tells-maharashtra/story-fDTFvYsW4mI1j4iwXEO8fM.html (accessed Sep 22, 2020).
(68) Jain, R.; Kishore, P.; Singh, D. K. Irrigation in India: Status, Challenges and Options. J. Soil Water Conserv. 2019, 18 (4), 354. https://doi.org/10.5958/2455-7145.2019.00050.x.
(69) Gandhi, V.; Bhamoriya, V. Groundwater Irrigation in India Growth, Challenges, and Risks. Geography 2009.
(70) Kapil, S. Nearly 80 per cent Indian households without piped water connection https://www.downtoearth.org.in/news/water/nearly-80-per-cent-indian-households-without-piped-water-
connection-67928 (accessed Sep 24, 2020).
(71) Dijk, W. M. van; Densmore, A. L.; Jackson, C. R.; Mackay, J. D.; Joshi, S. K.; Sinha, R.; Shekhar, S.; Gupta, S. Spatial Variation of Groundwater Response to Multiple Drivers in a Depleting Alluvial
Aquifer System, Northwestern India. Prog. Phys. Geogr. 2019, 44 (1), 94–119. https://doi.org/https://doi.org/10.1177/0309133319871941.
10(72) Fienen, M. N.; Arshad, M. The International Scale of the Groundwater Issue. In Integrated Groundwater Management. Concepts, Approaches and CHallenges; Jakeman, A. J., Barreteau, O., Hunt,
R.J., Rinaudo, J.-D., Ross, A., Eds.; SpringerOpen, 2016; pp 21–48. https://doi.org/10.1007/978-3-319-23576-9_2.
(73) Central Ground Water Board. Ground Water Year Book 2019-2020; 2021.
(74) CGWB. Ground Water Resources of Punjab State; 2018.
(75) CGWB. Dynamic Ground Water Resources of India; 2017.
(76) Gideon, V. M. Securing Groundwater Access in Urban India https://science.thewire.in/environment/securing-groundwater-access-in-urban-india/ (accessed May 17, 2021).
(77) Nair, A. S.; Indu, J. Changing Groundwater Storage Trend of India after Severe Drought. Int. J. Remote Sens. 2020, 41 (19).
(78) Mohanavelu, A.; Kasiviswanathan, K. S.; Mohanasundaram, S.; Ilampooranan, I.; He, J.; Pingale, S. M.; Soundharajan, B.-S.; Mohaideen, M. M. D. Trends and Non-Stationarity in Groundwater Level
Changes in Rapidly Developing Indian Cities. Water 2020.
(79) Chaudhary, J. Delhi’s groundwater plummets https://www.downtoearth.org.in/news/water/delhi-s-groundwater-plummets-60830 (accessed May 17, 2021).
(80) Ali, S.; Fakhri, Y.; Golbini, M.; Thakur, S. K.; Alinejad, A.; Parseh, I.; Shekhar, S.; Bhattacharya, P. Groundwater for Sustainable Development Concentration of Fluoride in Groundwater of India : A
Systematic Review , Meta-Analysis and Risk Assessment. Groundw. Sustain. Dev. 2019, 9. https://doi.org/10.1016/j.gsd.2019.100224.
(81) Mohan, V. Across India High Levels of Toxins In Groundwater https://timesofindia.indiatimes.com/india/govt-body-finds-high-levels-of-groundwater-contamination-across-india/
articleshow/65204273.cms (accessed Sep 24, 2020).
(82) Adimalla, N.; Venkatayogi, S.; Das, S. Assessment of Fluoride Contamination and Distribution : A Case Study from a Rural Part of Andhra Pradesh , India. Appl. Water Sci. 2019, 9 (94), 1–15. https://
doi.org/10.1007/s13201-019-0968-y.
(83) Reddy, K.; Puppala, R.; Kethineni, B.; Reddy, H.; Reddy, A.; Kalyan, V. Prevalence of Dental Fluorosis Among 6–12-Year-Old School Children of Mahabubnagar District, Telangana State, India − A
Cross-Sectional Study. Indian Assoc. Public Heal. Dent. 2017, 15 (1), 42–47.
(84) CGWB. Ground Water Quality in Shallow Aquifers of India; 2010.
(85) Krar, P. Parts of Haryana have salty groundwater and rains add to the salt content https://economictimes.indiatimes.com/news/economy/agriculture/parts-of-haryana-have-salty-groundwater-and-
rains-add-to-the-salt-content/articleshow/71342070.cms (accessed Sep 24, 2020).
(86) Central Ground Water Board. Ground Water Information Greater Mumbai District Maharashtra; 2013.
(87) Bhattacharya, M.; Shriwastav, A.; Bhole, S.; Silori, R.; Mansfeldt, T.; Kretzschmar, R.; Singh, A. Processes Governing Chromium Contamination of Groundwater and Soil from a Chromium Waste
Source. ACS Earth Sp. Chem. 2020, 4, 35–49. https://doi.org/10.1021/acsearthspacechem.9b00223.
(88) Idrees, N.; Tabassum, B.; Abdallah, E.; Hashem, A.; Sarah, R.; Hashim, M. Saudi Journal of Biological Sciences Groundwater Contamination with Cadmium Concentrations in Some. Saudi J. Biol.
Sci. 2018, 25 (7), 1365–1368. https://doi.org/10.1016/j.sjbs.2018.07.005.
(89) Ministry of Earth Sciences/ India Meteorological Department. Statement on Climate of India during 2019 https://mausam.imd.gov.in/backend/assets/press_release_pdf/Statement_on_Climate_of_
India_during_2019.pdf (accessed Sep 25, 2020).
(90) World Bank Group. Climate Change Knowledge Portal: India https://climateknowledgeportal.worldbank.org/country/india/climate-data-projections (accessed Sep 25, 2020).
(91) Kulkarni, A.; Sabin, T. P.; Chowdary, J. S.; Rao, K. K.; Priya, P.; Gandhi, N.; Bhaskar, P.; Buri, V. K.; Sabade, S. S.; Pai, D. S.; Ashok, K.; Mitra, A. K.; Niyogi, D.; Rajeevan, M. Precipitation Changes in
India. In Assessment of Climate Change over the Indian Region; Springer Singapore, 2020; pp 47–72. https://doi.org/10.1007/978-981-15-4327-2.
(92) Aadhar, S.; Mishra, V. Impact of Climate Change on Drought Frequency over India Impact of Climate Change on Drought Frequency over India. In Climate Change and Water Resources in India;
Ministry of Environment, Forest and Climate Change (MoEF&CC), Government of India, 2018; pp 117–129.
(93) INCCA. Climate Change and India: A 4x4 Assessment; 2010.
(94) Mishra, V.; Aadhar, S.; Mahto, S. S. Anthropogenic Warming and Intraseasonal Summer Monsoonvariability Amplify the Risk of Futureflash Droughts in India. Clim. Atmos. Sci. 2021, 4 (1).
(95) Ali, H.; Modi, P.; Mishra, V. Increased Flood Risk in Indian Sub-Continent under the Warming Climate. Weather Clim. Extrem. 2019, 25. https://doi.org/10.1016/j.wace.2019.100212.
(96) BBC News. Uttarakhand dam disaster: Race to rescue 150 people missing in India https://www.bbc.com/news/world-asia-india-55975743 (accessed Feb 18, 2021).
(97) Anand, N.; Terens, C. Explained: How climate change could impact Mumbai by 2050 https://indianexpress.com/article/explained/the-rising-threat-to-mumbai-6160595/ (accessed Sep 25, 2020).
(98) Dhiman, R.; Vishnuradhan, R.; Eldho, T. I.; Inamdar, A. Flood Risk and Adaptation in Indian Coastal Cities : Recent Scenarios. Appl. Water Sci. 2019, 9 (1), 1–16. https://doi.org/10.1007/s13201-018-
0881-9.
(99) Sangomla, A. A warming Bay of Bengal may have turned Amphan into super cyclone: Experts https://www.downtoearth.org.in/news/climate-change/a-warming-bay-of-bengal-may-have-turned-
amphan-into-super-cyclone-experts-71214 (accessed Oct 1, 2020).
(100) Bhatia, K. T.; Vecchi, G. A.; Knutson, T. R.; Dixon, K. W.; Whitlock, C. E.; Murakami, H.; Kossin, J. Recent Increases in Tropical Cyclone Intensification Rates. Nat. Commun. 2019, 10 (635), 1–9.
https://doi.org/10.1038/s41467-019-08471-z.
(101) Neubert, M.; Smith, A. Deadly Cyclone Phailin destroys $4bn worth of crops across area size of Delaware https://www.nbcnews.com/news/world/deadly-cyclone-phailin-destroys-4bn-worth-crops-
across-area-size-flna8C11390149 (accessed Oct 1, 2020).
(102) Sud, V.; Rajaram, P. Cyclone Amphan caused an estimated $13.2 billion in damage in India’s West Bengal: government source https://www.cnn.com/2020/05/22/weather/cyclone-amphan-damage-
intl-hnk/index.html#:~:text=Cyclone Amphan kills dozens and leaves thousands homeless&text=Kolkata%2C India (CNN) The,in the Indian state’s government. (accessed
Oct 1, 2020).
(103) Mohan, V. National water policy in the pipeline but states still divided https://timesofindia.indiatimes.com/india/national-water-policy-in-the-pipeline-but-states-still-divided/articleshow/73681298.
cms (accessed Sep 30, 2020).
(104) Acharyulu, M. The great Indian river question: Three Bills threatening federalism https://www.downtoearth.org.in/news/water/the-great-indian-river-question-three-bills-threatening-
federalism-72913 (accessed Oct 1, 2020).
(105) Acharyulu, M. The great Indian river question: Three Bills threatening federalism https://www.downtoearth.org.in/news/water/the-great-indian-river-question-three-bills-threatening-
federalism-72913 (accessed Oct 2, 2020).
(106) Pandit, C.; Biswas, A. K. India’s National Water Policy : ‘ Feel Good ’ Document , Nothing More India ’ s National Water Policy : ‘ Feel Good ’ Document , Nothing More. Int. J. Water Resour. Dev.
2019. https://doi.org/10.1080/07900627.2019.1576509.
(107) Mehrotra, K. Jal Jeevan Mission-Urban: Govt selects 10 cities for survey https://indianexpress.com/article/india/jal-jeevan-mission-urban-govt-selects-10-cities-for-survey-7191861/ (accessed May
17, 2021).
(108) Ahmed, M.; Araral, E. Water Governance in India : Evidence on Water Law , Policy , and Administration from Eight Indian States. Water 2019, 11 (2071).
(109) Department of Water Resources, R. D. and G. R. Annual Report 2019-20; 2019.
(110) Raju, K.; Taron, A.; Change, E. River Basin Organisations in India: An Overview. In IWMI-TATA; International Water Management Institute (IWMI), 2007.
(111) Drishti. Inter-State River Water Sharing Disputes https://www.drishtiias.com/to-the-points/Paper2/inter-state-river-water-sharing-disputes (accessed Sep 30, 2020).
(112) Drishti. Inter-State River Water Sharing Disputes https://www.drishtiias.com/to-the-points/Paper2/inter-state-river-water-sharing-disputes (accessed Oct 6, 2020).
(113) The Economic Times. Lok Sabha passes Dam Safety Bill https://economictimes.indiatimes.com/news/politics-and-nation/lok-sabha-passes-dam-safety-bill/articleshow/70502693.cms (accessed Oct
1, 2020).
(114) The Hindu. 'Bill aims to reduce river water to a commodity’ https://www.thehindu.com/news/national/karnataka/bill-aims-to-reduce-river-water-to-a-commodity/article28629395.ece (accessed Oct
1, 2020).
(115) Seth, B. Supreme Court go-ahead for interlinking rivers https://www.downtoearth.org.in/news/supreme-court-goahead-for-interlinking-rivers-36857 (accessed Sep 30, 2020).
(116) Chokkakula, S. The Supreme Court and Interstate River Water Disputes https://www.cprindia.org/projects/supreme-court-and-interstate-river-water-disputes (accessed Oct 1, 2020).
(117) Jolly, A. Why linking rivers won’t work https://www.indiatoday.in/magazine/nation/story/20160425-river-linking-narendra-modi-national-green-tribunal-828761-2016-04-14 (accessed Sep 30, 2020).
(118) Hanasz, P. Sharing waters vs. sharing rivers: The 1996 Ganges Treaty https://globalwaterforum.org/2014/07/28/sharing-waters-vs-sharing-rivers-the-1996-ganges-treaty/ (accessed Oct 1, 2020).
(119) Rahman, K. S.; Islam, Z.; Navera, U. K.; Ludwig, F. A Critical Review of the Ganges Water Sharing Arrangement. Water Policy2 2019, 21, 259–276. https://doi.org/10.2166/wp.2019.164.
(120) Sawhney, A. Compliance dilemmas in Indian environmental policy https://www.eastasiaforum.org/2018/10/10/compliance-dilemmas-in-indian-environmental-policy/ (accessed Mar 11, 2021).
(121) CWC. Annual Report 2018-2019; 2019.
(122) Herbert, A.; Kumar, U. Real Time Water Quality Monitoring System (RTWQMS) in Indian Rivers. In National Conference on River Flow Processes Modelling (RFPM-2017); 2017.
(123) CGWB. Annual Report 2018-19; 2019.
ABOUT THIS PROFILE
This profile was produced by USAID's Sustainable Water Partnership activity.
DISCLAIMER
The author’s views expressed in this publication do not necessarily reflect the views of the United States Agency for International
Development or the United States Government
11You can also read