Implementation Plan for the Southern Pacific Border and Sierra-Cascade Mountains Provinces - Open-File Report 2021-1012
←
→
Page content transcription
If your browser does not render page correctly, please read the page content below
Implementation Plan for the Southern Pacific Border
and Sierra-Cascade Mountains Provinces

Open-File Report 2021–1012

U.S. Department of the Interior
U.S. Geological Survey
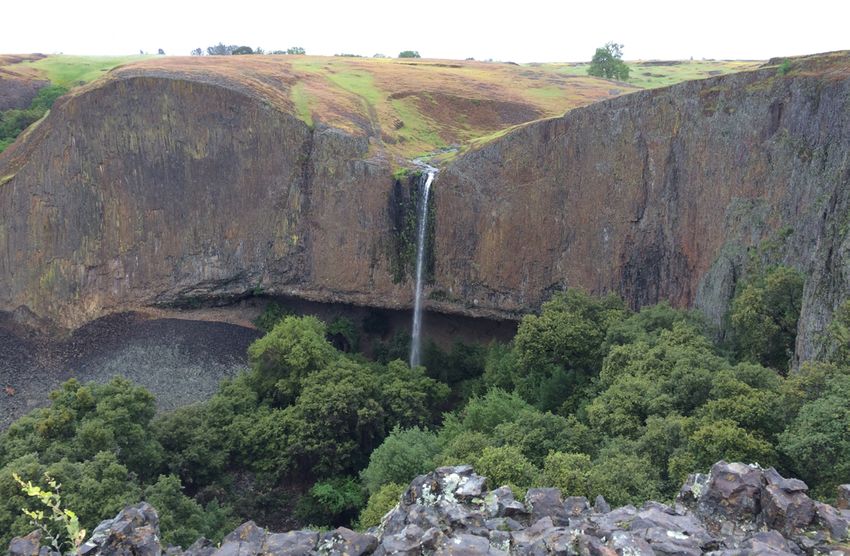
Cover. Photograph showing Lovejoy Basalt (~15–16 million years old) at North Table Mountain near Oroville, California.
This flow originated in the northeastern Sierra Nevada and flowed more than 200 kilometers across the Sierra Nevada into
the Sacramento Valley, where it is mostly concealed, to as far south as Vacaville (almost to the San Francisco Bay). U.S.
Geological Survey photograph taken April 6, 2017, by Victoria Langenheim.
Implementation Plan for the Southern Pacific Border and
Sierra-Cascade Mountains Provinces

By Victoria E. Langenheim, Russell W. Graymer, Robert E. Powell, Kevin M. Schmidt, and
Donald S. Sweetkind

Open-File Report 2021–1012

U.S. Department of the Interior
U.S. Geological Survey
U.S. Geological Survey, Reston, Virginia: 2021

For more information on the USGS—the Federal source for science about the Earth, its natural and living resources,
natural hazards, and the environment—visit https://www.usgs.gov or call 1–888–ASK–USGS (1–888–275–8747).
For an overview of USGS information products, including maps, imagery, and publications,
visit https://store.usgs.gov.

Any use of trade, firm, or product names is for descriptive purposes only and does not imply endorsement by the
U.S. Government.

Although this information product, for the most part, is in the public domain, it also may contain copyrighted materials
as noted in the text. Permission to reproduce copyrighted items must be secured from the copyright owner.

Suggested citation:
Langenheim, V.E., Graymer, R.W., Powell, R.E., Schmidt, K.M., and Sweetkind, D.S., 2021, Implementation plan for the
southern Pacific Border and Sierra-Cascade Mountains provinces: U.S. Geological Survey Open-File Report 2021–1012, 11 p.,
https://doi.org/10.3133/ofr20211012.

ISSN 2331-1258 (online)
iii

Contents
Introduction.....................................................................................................................................................1
Status of Geologic and Topographic Mapping..........................................................................................2
     Synopsis of Recent NCGMP-Sponsored Science and Mapping...................................................2
     Description of Lidar Mapping Status..................................................................................................4
     Description of Geophysical Survey Status........................................................................................4
Scientific and Societal Relevance...............................................................................................................6
     Seismotectonics....................................................................................................................................6
     Basin Stratigraphy, Structure, and Resources.................................................................................6
     Mineral Resources................................................................................................................................6
     Surface and Groundwater Resources...............................................................................................6
Regional Mapping Strategy..........................................................................................................................6
Scientific Objectives......................................................................................................................................7
     Phase 1 Scientific Objectives..............................................................................................................7
     Phase 2 Scientific Objectives..............................................................................................................8
     Phase 3 Scientific Objectives..............................................................................................................8
Geologic Mapping Objectives......................................................................................................................8
     Phase 1 Geologic Mapping Objectives..............................................................................................8
           Mapping Objective 1. Merge and Update 3D Maps of Different Resolution and Content......... 8
           Mapping Objective 2. Geologic and Geophysical Mapping in Areas of Poor Coverage along
                         the Transform Margin.......................................................................................................9
           Mapping Objective 3. Regional Compilation of a 1:250,000-Scale Seamless Geologic
                         Map Database.................................................................................................................9
           Mapping Objective 4. New Detailed Geologic Mapping in Support of Fellow
                         Department of Interior Agencies..................................................................................9
           Mapping Objective 5. New Mapping in Support of 3D Mapping and (or) Regional
                         Compilations.....................................................................................................................9
     Phase 2 Geologic Mapping Objectives..............................................................................................9
     Phase 3 Geologic Mapping Objectives..............................................................................................9
Needed Capabilities.....................................................................................................................................10
Partners..........................................................................................................................................................10
     Other USGS Programs........................................................................................................................10
     Other Federal Agencies......................................................................................................................10
     State and Local Agencies..................................................................................................................10
     Private Industry....................................................................................................................................10
     Academic Entities................................................................................................................................10
Anticipated Outcomes.................................................................................................................................11
References Cited..........................................................................................................................................11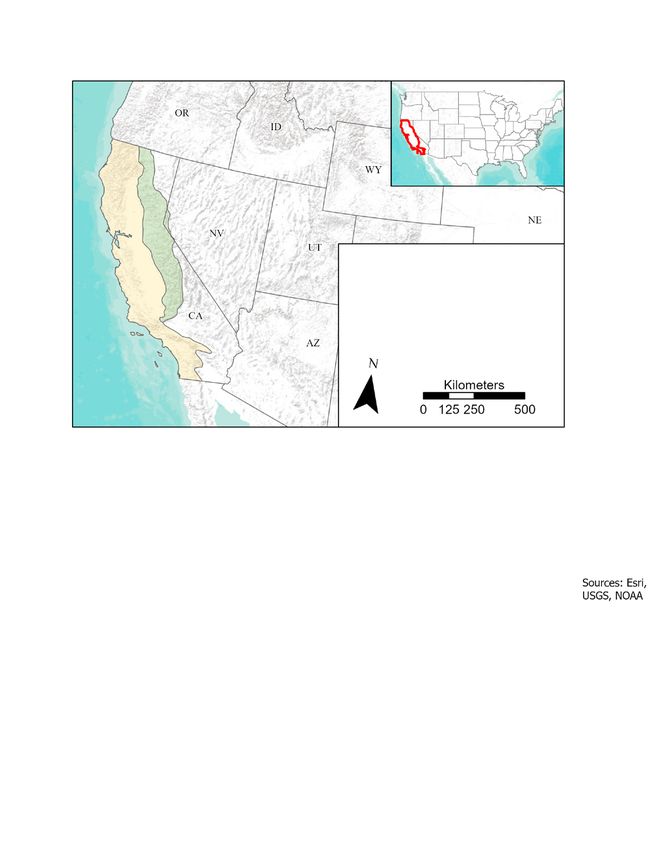
iv
Figures
1. Map showing the extent of the southern Pacific Border and Sierras-Cascade
Mountains provinces in California and Nevada.......................................................................2
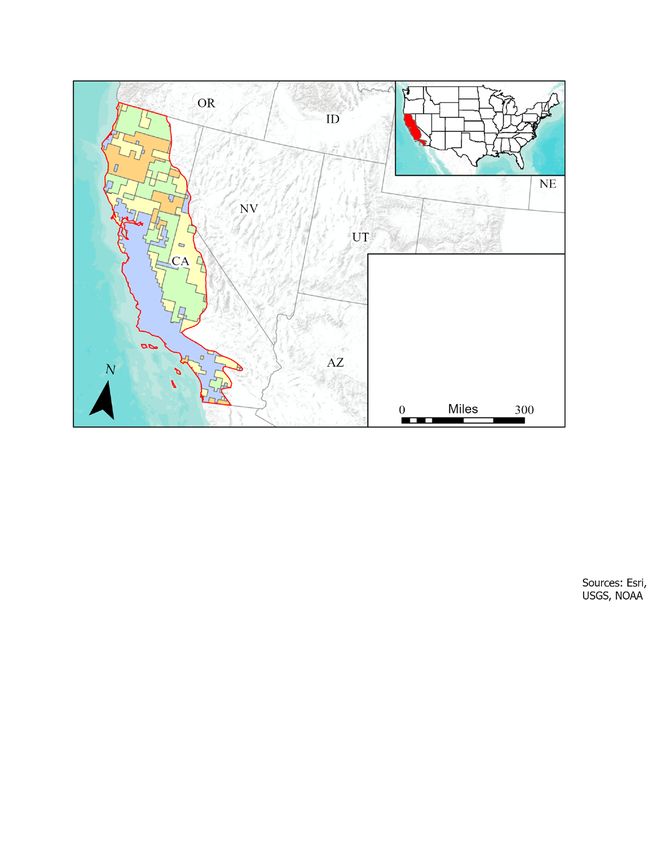
2. Map of California and Nevada showing 1:24,000- and smaller scale published map
coverage in the National Geologic Map Database catalog...................................................3
3. Map of FEDMAP- and STATEMAP-funded mapping efforts from 2015 to 2020 in the
southern Pacific Border and Sierra-Cascade Mountains provinces in California and
Nevada............................................................................................................................................3
4. Map of California and Nevada showing the footprints of three-dimensional maps for
the first and second phase...........................................................................................................4
5. Map of existing or funded light detection and ranging (lidar) data coverage within the
southern Pacific Border and Sierra-Cascade Mountains provinces...................................5
6. Map showing the status of aeromagnetic survey availability and quality in the southern
Pacific Border and Sierra-Cascade Mountains provinces.......................................................5
Abbreviations
3D three dimensional
3DEP 3D Elevation Program
4D four dimensional
BALANCE Basin and Landscape Co-Evolution
CGS California Geological Survey
CRADA Cooperative Research and Development Agreement
Earth MRI Earth Mapping Resources Initiative
GIS Geographic Information Systems
lidar light detection and ranging
MRP Mineral Resources Program
NCGMP National Cooperative Geologic Mapping Program
NPS National Park Service
SAFSOC San Andreas Fault System in Southern California
USGS U.S. Geological Survey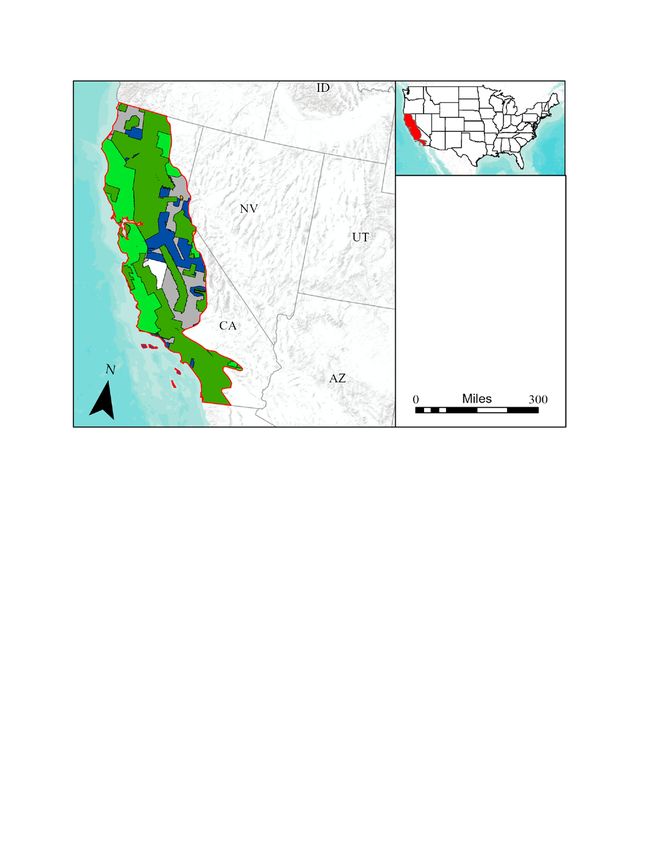
Implementation Plan for the Southern Pacific Border and
Sierra-Cascade Mountains Provinces
By Victoria E. Langenheim, Russell W. Graymer, Robert E. Powell, Kevin M. Schmidt, and Donald S. Sweetkind

Introduction                                                            recreational opportunities that attract visitors from around the
                                                                        world, whereas previously these ranges attracted people to mine
     The National Cooperative Geologic Mapping Program                  their resources. The agricultural capacity of the Central Valley is a
(NCGMP) is publishing a strategic plan titled Renewing the              critical resource for the Nation that is increasingly water limited.
National Cooperative Geologic Mapping Program as the Nation’s                  The southern Pacific Border and Sierra-Cascade Mountains
Authoritative Source for Modern Geologic Knowledge (Brock and           provinces, at the edge of the North American continent, were
others, in press). The plan provides a vision, mission, and goals for   profoundly influenced by subduction zone tectonics during
the program during the years 2020–2030, which are:                      the Mesozoic and early Cenozoic (ongoing in northernmost
                                                                        California) and subsequently by the inception, development,
     • Vision.—Create an integrated, three-dimensional, digital         and present activity of the San Andreas transform margin
         geologic map of the United States.                             system. Although the geology of this region is the poster child of
     • Mission.—Characterize, interpret, and disseminate a              fundamental conceptual models of subduction zone complexes,
       national geologic framework model of the Earth through           forearc basins, ophiolite obductions, magmatic arcs, and suspect
       geologic mapping.                                                terranes, as well as hosting one of Earth’s most notorious
                                                                        continental transform faults—the San Andreas Fault—important
     • Goal.—Focus on geologic mapping as a core function               questions that have important societal consequences remain to
       of the U.S. Geological Survey (USGS) within the                  be answered. Most of California’s population reside in these
       long-term vision of adequately mapping the Nation’s              provinces and live within 30 miles of an active fault (according
       geologic framework in three dimensions.                          to www.earthquakeauthority.com) yet new faults continue to be
       In order to achieve the goals outlined in the strategic plan,    discovered, highlighting the importance of deformation off the
the NCGMP has developed an implementation plan. This plan               main San Andreas Fault. Bedrock, surficial, and three-dimensional
will guide the annual review of projects carried out by USGS            (3D) geologic maps depicting stratigraphic structure and depth to
staff (FEDMAP) described in the plan and the development of             crystalline basement rocks provide critical context and information
the annual FEDMAP prospectus that will ensure the effective             for understanding fault rupture, distributed deformation, fault
application of the NCGMP strategy.                                      connectivity, and history in addition to providing crucial data
       This publication describes the implementation plan of the        that enable forecasting of shaking amplitude and length from
NCGMP strategy for the southern Pacific Border and Sierra-              hypothetical earthquake scenarios.
Cascade Mountains provinces, as defined by Fenneman (1917,                    The tectonic evolution of California produced not only
1928, and 1946). This implementation plan focuses on the                stunning mountains, with associated hazards from landslides and
geology of California and a sliver of Nevada surrounding Lake           active volcanoes, but also fertile valleys that make California the
Tahoe (fig. 1). The southern Pacific Border and Sierra-Cascade          top agricultural producer in the country in terms of cash receipts
Mountains provinces encompass the varied landscapes of the              (according to www.ers.usda.gov/faqs). These valleys lie atop large
high Sierra Nevada, the Central Valley, and Coast Ranges in             basins that not only store groundwater but, in many cases, host
northern and central California and the Peninsular Ranges,              oil and gas fields, contributing to the fourth highest hydrocarbon
Continental Borderland, Los Angeles Basin-San Gabriel-San               production by State in the country in 2016 (according to https://
Bernardino valleys, western and central Transverse Ranges, and          www.aei.org/carpe-diem/animated-chart-of-us-oil-production-by-
northernmost Salton Trough in southern California. Societal             state-1981-2017). Water is a key resource increasingly stressed
demands create a need for earth-science data in each of these           by growing agricultural, industrial, and residential needs. Warmer
landscapes. The broader San Francisco Bay area, Central Valley,         and drier conditions have led to an increased reliance on extracting
Los Angeles-San Gabriel-San Bernardino lowlands, and the                groundwater resources, whose availability and quality are dictated
coastal lowlands that border the Peninsular Ranges are densely          at the first order by the 3D spatial distribution of bedrock and
populated (about 30 million people) areas at high risk of natural       Quaternary surficial deposits. Thus, assessment of this critical
hazards. The mountains of the Sierra Nevada, Peninsular Ranges,         resource is inextricably tied to knowledge of the surficial and
and Transverse Ranges, and the coast all provide numerous               subsurface geologic structure and material types.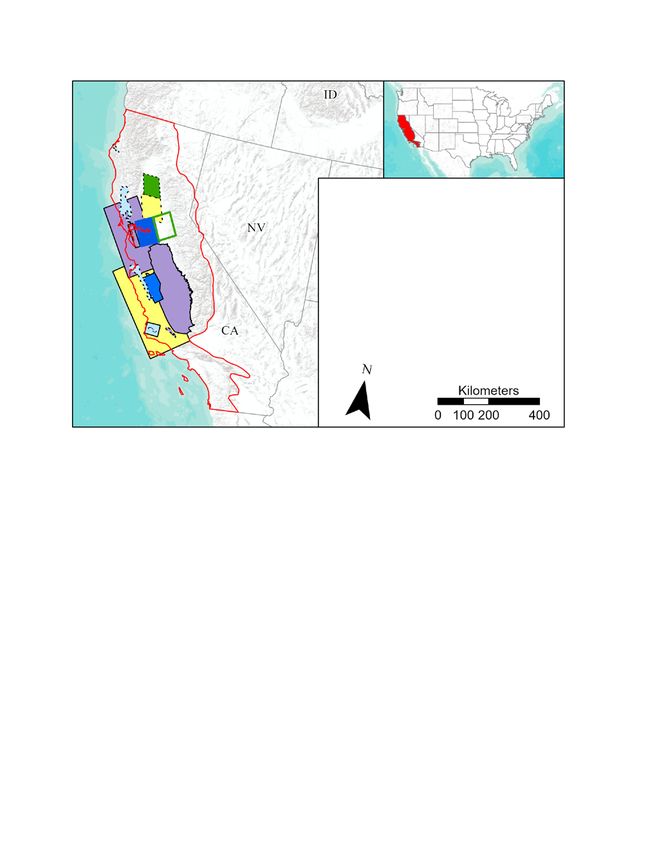
2   Implementation Plan for the Southern Pacific Border and Sierra-Cascade Mountains Provinces

                                                                                                EXPLANATION
                                                                                              Physiographic provinces

                                                                                                Sierra-Cascade Mountains

                                                                                                Southern Pacific Border

                         N
                                                                              0         100       200       300     400      500 MILES

                                                                              0   100     200    300    400 500 KILOMETERS

                   Figure 1. Map showing the extent of the southern Pacific Border and Sierra-Cascade Mountains
                   provinces in California and Nevada. AZ, Arizona; CA, California; ID, Idaho; NE, Nebraska; NV, Nevada;
                   OR, Oregon; UT, Utah.

Status of Geologic and Topographic                                      surveys (STATEMAP) (figs. 3 and 4) provide an important
                                                                        springboard for future work in the provinces.
Mapping                                                                      • 2003–2008, Understanding Geohydrologic Systems
                                                                               from Geologic Framework and History, project chief:
      Previous mapping efforts in the provinces span multiple
                                                                               V.E. Langenheim
scales from 1:24,000 to 1:250,000 and multiple decades (fig.  2).
Many of the previous 1:24,000-scale maps, for example, in the                • 2008–2013, Geohydrology of Coast Ranges Basins,
California Coast Ranges, are from Thomas Dibblee, based on                     project chief: V.E. Langenheim
his mapping efforts in the 1950s and 1960s. Since then, mapping
and dating methods have substantially changed and improved.                  • 2013–2018, Geologic Controls on Hydrology in
Although substantial progress has been made by State and Federal               Sacramento Valley and Other Basins, California,
surveys, notable gaps exist, especially at scales of 1:24,000 away             project chief: V.E. Langenheim
from densely populated areas. Although the entire State is covered
at a mapped scale of 1:250,000, most of these maps predate the               • 2007–2011, 3D/4D Mapping of the San Andreas Fault
1980s, are not seamless, and in some cases, such as the Alturas and            Zone, project chief: R.W. Graymer
Ukiah quadrangles, have blank areas.
                                                                             • 2010–2018, Seismic Hazards in the Sacramento Delta,
                                                                               project chief: R.W. Graymer
Synopsis of Recent NCGMP-Sponsored Science                                   • 2004–2011, Basin and Landscape Co-Evolution
and Mapping                                                                    (BALANCE), project chief: J.C. Matti
      Because of the provinces’ geologic complexity and the                  • 2011–2016, San Andreas Fault System in Southern
high degree of societal relevance, the NCGMP has a long-                       California (SAFSOC), project chief: R.E. Powell
standing footprint in the provinces, including the projects
listed below carried out by USGS staff (FEDMAP). Maps and                    • 2016–2021, San Andreas Fault System in Southern
data developed during these projects and by State geological                   California 2 (SAFSOC 2), project chief: R.E. Powell
Status of Geologic and Topographic Mapping 3
UT WY
EXPLANATION
Published map coverage by scale
Greater or equal to 1:24,000
1:24,000–1:63,000
1:64,000–1:100,000
AZ 1:250,000
N
0 100 200 300 400 MILES
0 100 200 300 400 KILOMETERS
Figure 2. Map showing the scale of existing published map coverage in the National Geologic Map
Database catalog. Not depicted are three-dimensional geologic maps. The red outline shows the
southern Pacific Border and Sierra-Cascade Mountains provinces in California and Nevada. AZ, Arizona;
CA, California; ID, Idaho; NE, Nebraska; NV, Nevada; OR, Oregon; UT, Utah; WY, Wyoming.
OR
WY NE
UT
EXPLANATION
Funded mapping 2015–2020
FEDMAP funded mapping
STATEMAP funded mapping
AZ
N
0 100 200 300 400 MILES
0 100 200 300 400 KILOMETERS
Figure 3. Map of FEDMAP- and STATEMAP-funded mapping efforts from 2015 to 2020 in the
southern Pacific Border and Sierra-Cascade Mountains provinces in California and Nevada (red
outline). AZ, Arizona; CA, California; ID, Idaho; NE, Nebraska; NV, Nevada; OR, Oregon; UT, Utah;
WY, Wyoming.4 Implementation Plan for the Southern Pacific Border and Sierra-Cascade Mountains Provinces
OR
EXPLANATION
Footprint of 3D mapping
Published 3D model
3D model in review
Model in progress
Phase 1
Phase 2
AZ Model deeper than groundwater basin
Geohydrologic basin model
N
0 100 200 300 400 MILES
0 100 200 300 400 KILOMETERS
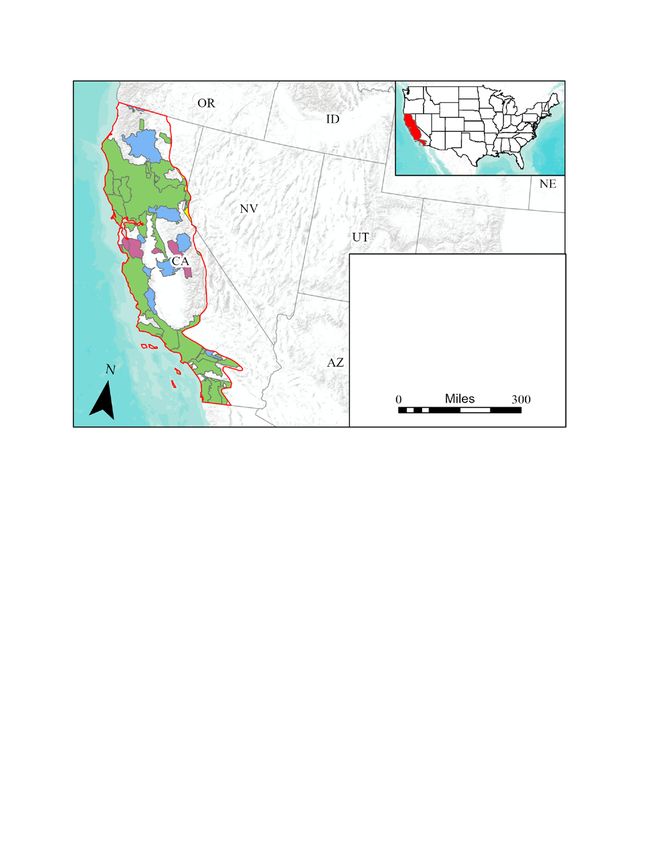
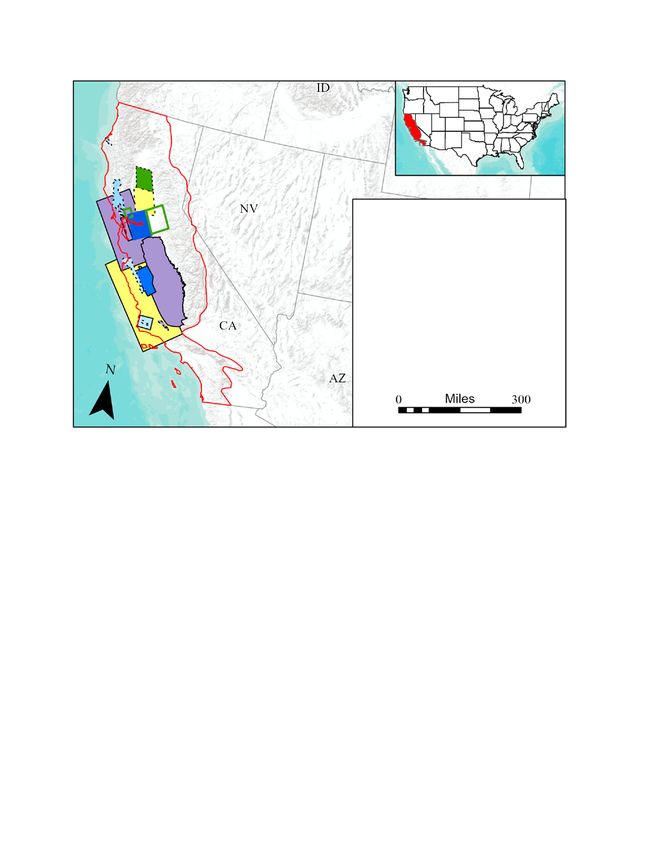
Figure 4. Map of footprints of three-dimensional (3D) maps for the first and second phase proposed in
this plan in addition to maps in various stages of publication from previous, related projects. Solid outlines
denote models that extend deeper than the groundwater basin; dashed lines indicate geohydrologic
basin models. Red outline shows the southern Pacific Border and Sierra-Cascade Mountains provinces
in California and Nevada. AZ, Arizona; CA, California; ID, Idaho; NV, Nevada; OR, Oregon.
Description of Lidar Mapping Status Elevation Program (3DEP) interest but are currently without
funding (fig. 5).
Although not critical for small-scale geologic mapping,
high-resolution topographic data are critical for mapping at
scales of 1:100,000 or finer, especially for mapping of surficial Description of Geophysical Survey Status
deposits and their attendant hazard susceptibility, and for
identification of young fault traces. Aeromagnetic and gravity data can be used to map
Light detection and ranging (lidar) data provide high- physical properties related to geologic structure and
resolution topographic data that aids fine-scale geologic stratigraphy, allowing mapping of geologic relations
mapping. In the southern Pacific and Sierra-Cascade across areas covered by young surficial deposits or into the
Mountains provinces, these data exist for much of the San subsurface. Airborne magnetic surveys can be an efficient
Francisco Bay area, Sacramento River delta region, and in and effective way to map magnetic properties of crustal rocks
parts of the Sierra Nevada and Transverse Ranges (fig. 5). over large areas. A recent compilation of airborne magnetic
Lidar data are absent in several key areas, including (1) the surveys (Drenth and Grauch, 2019; Johnson and others, 2019;
north ends of the San Andreas and Bartlett Springs Faults fig. 6) indicates that much of coastal California north of the
and the Mendocino triple junction region, (2) the Transverse Transverse Ranges has suitable resolution to contribute to
Ranges, (3) much of the Sacramento and San Joaquin Valleys, 1:100,000-scale (or finer) studies. Substantial gaps (blue and
and (4) much of the Klamath Mountains, Cascade Range, and gray in fig. 6) exist in northwestern California, San Joaquin
Modoc Plateau in northernmost California. Much of the areas Valley, and parts of the Sierra Nevada. Likewise, gravity data
listed in areas 1 and 4 have been identified as areas of 3D are non-uniformly distributed throughout the province.Status of Geologic and Topographic Mapping 5
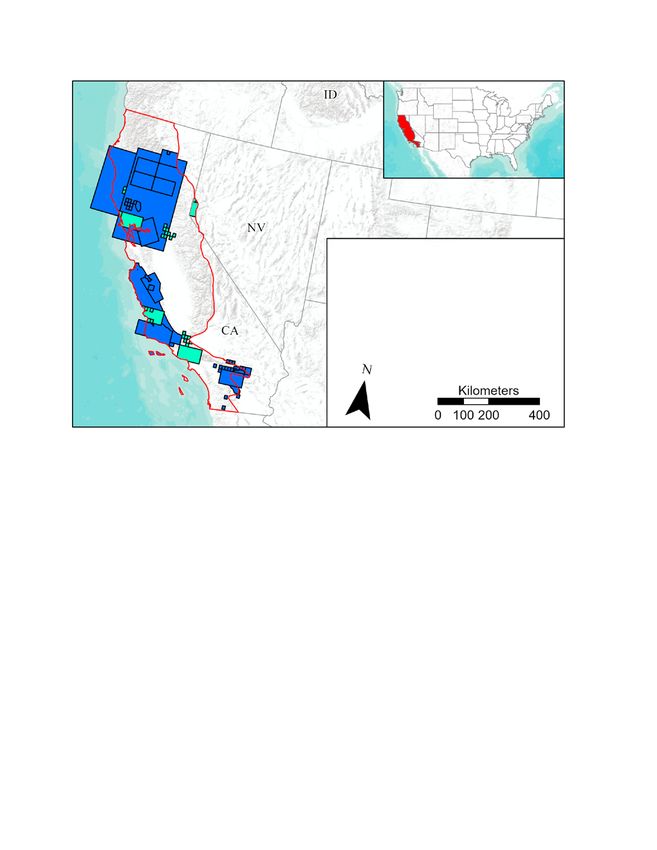
Figure 5. Map of existing or
funded light detection and ranging
(lidar) data coverage within the
southern Pacific Border and Sierra-
Cascade Mountains provinces.
Although not critical for small-scale
geologic mapping, high-resolution WY
UT
topographic data are critical for
mapping at scales of 1:100,000 or
finer, especially for mapping of
surficial deposits, their attendant EXPLANATION
hazard susceptibility, and for LiDAR coverage
identification of young fault traces.
Earth MRI Funded - Completed
Red outline shows the southern
Pacific Border and Sierra-Cascade 3DEP Funded - Planned
Mountains provinces in California 3DEP Funded - In Progress
and Nevada. 3DEP, 3D Elevation AZ
3DEP Funded - Completed
Program; Earth MRI, Earth Mapping
N
Resources Initiative; AZ, Arizona; CA,
0 100 200 300 400 MILES
California; ID, Idaho; NE, Nebraska;
NV, Nevada; OR, Oregon; UT, Utah; 0 100 200 300 400 KILOMETERS
WY, Wyoming.
Figure 6. Map showing the status OR
of aeromagnetic survey availability
and quality in the southern Pacific
Border and Sierra-Cascade Mountains
provinces. Areas shown in orange
and light green (rank 1 and 2) are of
sufficient resolution for mapping at
detailed scales, whereas areas in EXPLANATION
UT
blue and gray (rank 4 and 5) have Status of aeromagnetic survey
poor or low resolution and would be availability and quality
considered high priority under the Rank 1
Earth Mapping Resources Initiative.
Rank 2
Areas shown in green (rank 3) are
of suitable resolution for mapping at Rank 3
regional scales. Not shown are very Rank 4
detailed, ground-based gravity and
Rank 5
magnetic measurements. Modified
from Drenth and Grauch (2019). Red No Data
outline shows the southern Pacific N
0 100 200 300 400 MILES
Border and Sierra-Cascade Mountains
provinces in California and Nevada. AZ, 0 100 200 300 400 KILOMETERS
Arizona; CA, California; ID, Idaho; NV,
Nevada; UT, Utah.6 Implementation Plan for the Southern Pacific Border and Sierra-Cascade Mountains Provinces
Scientific and Societal Relevance may be present, not only at the surface, but in the subsurface. The
discovery of gold in the foothills of the Sierra Nevada led, in large
Scientific and societal relevance in the southern Pacific part, to California becoming the 31st State of the Union. Although
Border and Sierra-Cascade Mountains provinces are inextricably gold mining is now largely absent from the southern Pacific
intertwined. For example, the large region that includes the urban Border and Sierra-Cascade Mountains provinces, the arc setting
San Francisco Bay and Los Angeles areas lies along the transform and accompanying rocks affected by hydrothermal and epithermal
plate boundary where societal impacts of geologic processes processes may host critical minerals, such as tungsten, chromium,
are extremely high; however, the 3D and four-dimensional (4D) and rare earth elements.
geology, which is the geology as it changed over time, underlying
this region remains poorly known. Fundamental questions about Surface and Groundwater Resources
the tectonic framework and geologic development of this area
remain unanswered, such as the relation between thrust and strike- Within the province, surface water and groundwater serve
slip faults, the relative age of numerous faults, and the partitioning as water supplies for urban populations, agriculture, and native
of slip amongst them. habitats. The combination of rapid population growth, high water
The West Coast of the United States contains valleys that are use, and an increasingly arid climate has led to an increased
the focus for human effects, such as urbanization and agriculture. dependence on groundwater resources, resulting in locally severe
The basins that underlie these valleys are increasingly affected groundwater depletion, declining groundwater levels, and local
by the availability and sustainability of water resources owing to subsidence of the land surface. Management of surface-water
ongoing urbanization outside the main coastal metropolitan areas. and groundwater resources in the provinces requires knowledge
Many of the valley areas contain substantial aquifers that are of the groundwater system, which requires an understanding of
important sources of local groundwater for domestic, agricultural, the configuration and properties of aquifers. Such understanding
and municipal use. These aquifers are increasingly stressed, includes the delineation of water-bearing units based on lithology
resulting in falling groundwater levels, water-quality issues, such and hydraulic properties, and the construction of two-dimensional
as salt-water intrusion where some of these valleys are in close (2D) and 3D hydrogeologic frameworks.
proximity to the ocean, and subsidence. The subsurface geology
in these basins results from the interplay of the depositional and
deformational processes through time, yet the geologic history
and basin evolution remain poorly understood and a priority for
Regional Mapping Strategy
scientific study.
In order to understand the temporal and spatial evolution
Specific topics that have combined scientific and societal
of California landscapes, three coevolving groups of landform
relevance are discussed below.
features must be integrated: (1) mountain ranges, carved principally
from uplifted crustal blocks of igneous and metamorphic crystalline
Seismotectonics basement rocks and (or) unmetamorphosed Mesozoic and early
Cenozoic strata; (2) lowland valleys, filled with late Cenozoic
Important questions of how fast faults slip through time, how sedimentary materials; and (3) mountain fronts that form dynamic
they are connected at depth and at the surface, how to interpret interfaces between the highland blocks and lowland basins. These
geodetic data relating to the style of deformation, and how rocks of three physiographic elements record distinct but complementary
different density and seismic velocity are distributed pertain directly records of landscape evolution. The geologic story of most of
to societally relevant questions of how to forecast shaking damage, California over the last 30 million years or so has been driven by
the size of potential earthquakes, and where faults may rupture. evolving plate-margin interactions between the Pacific and North
America Plates; understanding that story depends on documenting
the origin and interactive evolution of fault-bounded crustal blocks
Basin Stratigraphy, Structure, and Resources at various scales.
This implementation plan outlines a multi-pronged approach
Basins preserve the record of the tectonic evolution, unroofing
that builds on, updates, and merges recent 2D and 3D mapping
(exhumation), and sedimentation of California. Their structural
funded by FEDMAP (figs. 3 and 4) while filling in gaps of
and stratigraphic underpinnings are essential components for
knowledge in key areas with new detailed mapping supplemented
understanding availability and quality of natural resources,
by a compilation of mapping from other sources. These efforts
particularly water, oil, and gas, as well as understanding seismic
will set the stage for a unified geologic map that will contribute to
path and basin effects that concentrate shaking in certain areas.
hazard and resource studies within this geologically complex and
active province.
Mineral Resources The regional mapping strategy will use surface and
subsurface geologic mapping and potential field geophysical
Basic geologic, geophysical, and geochemical map studies—accompanied by stratigraphic, paleontological,
information is critical to understanding where mineral resources geochronological, and geochemical studies—both (1) toScientific Objectives 7
construct a 4D crustal framework for understanding the What follows are descriptions of the scientific objectives for each
occurrence and risk of hazards (earthquake, volcanic, of the three 4-year phases. The objectives are tied to the themes
landslide, flood, and fire) in space and time and (2) to evaluate listed above and directly to activities in each phase.
the distribution of and temporal changes in resources (water,
soil, mineral, oil and gas, geothermal, aggregate, and biota and
habitat). We will also use these mapping studies to document Phase 1 Scientific Objectives
evidence for the earth processes involved in generating
hazards and affecting the availability of resources. 1. Where and how does slip that is not on the mapped San
Regional mapping of the southern Pacific Border and Andreas Fault occur? How does deformation in the Walker
Sierra-Cascade Mountains provinces will proceed on several Lane connect with the propagation of the Mendocino triple
fronts: (1) 1:24,000- to 1:100,000-scale mapping activities junction? Where and how does strain transfer off of the
conducted by FEDMAP and STATEMAP projects where southern San Andreas Fault into the Eastern California
geologic detail is required for scientific understanding or Shear Zone?—A substantial amount of slip transfers off the
hazard or resource purposes; (2) regional geologic map southern San Andreas Fault southward onto the San Jacinto
compilation at 1:250,000 scale supporting the development of Fault and northward into the Eastern California Shear Zone-
a nationwide seamless geologic map database; (3) basin-scale Walker Lane of the Mojave Desert and along the eastern
3D geologic maps that are primarily focused on water-bearing margin of the Sierra Nevada. Continued assessment of the
strata in the upper 1–2 kilometers of the crust; and (4) crustal- geometry, recency, and amount of slip on various faults
in the broad transform margin remains a high societal and
scale 3D geologic maps primarily focused on faults at depths
scientific priority.
that can produce earthquakes and 3D crustal properties.
2. Improving assignment of seismic velocity to subsurface
volumes to enable more accurate estimation of ground
shaking from hypothetical earthquake scenarios.—As part
Scientific Objectives of our ongoing development of 3D geologic maps of the
region, new 3D geologic mapping of the eastern Sacramento
Objectives are broken up into three 4-year phases, yet the
Valley and Sierra Nevada foothills, which will extend from
complexity of the geology and prior experience dictate that there
the completed but not yet published Delta 3D map, will
will be geographic overlap between these phases. For example,
encompass a volume with an upper basement surface that
the passage of the Sustainable Groundwater Management Act
is well defined by basement penetrating wells. A closely
(for more information, visit https://www.water.ca.gov/Programs/
defined basement surface, combined with the somewhat
Groundwater-Management/SGMA-Groundwater-Management)
unreliable identification of basement rocks in wells, will
has elevated the demand for geologic framework models of
eliminate uncertainties involved in using gravity and
groundwater basins and the ability to update pertinent geologic
aeromagnetic data to assign density and seismic velocity
maps with higher resolution surface and subsurface data for specific
to basement volumes. Having a geology-based 3D model
basins. The high probability of a major earthquake in the next 12
with well-defined basement properties will enable direct
years may also modify mapping priorities. There are overarching
comparison to tomographic models of the same volume,
scientific questions and themes that span all the phases.
an important step toward developing techniques to produce
1. What are the geometry, slip rate, and connectivity of superior 3D seismic velocity models that take advantage of
faults throughout the transform margin? How do these both geologic and tomographic data.
faults affect resource location, distribution, quantity, and
quality? How do these factors contribute to the behavior 3. What are the geologic controls on large-volume springs
of faults as earthquake sources? and groundwater flow within the volcanic section, which
is the recharge area and headwaters of the Sacramento
2. How have basins and landscapes evolved through time? River? What is the 3D subsurface configuration of aquifers
How has this evolution affected resource quantity and and confining units in major groundwater basins, such
quality? Can we use this knowledge to better understand as the Sacramento and Salinas valleys?—The northward
processes related to hazards and resources? propagation of the zone of right-lateral shear in eastern
California extends into the southernmost Cascade Arc in
3. How are rocks and sediments of different properties northeastern California. This region hosts large-discharge
distributed at the Earth’s surface and in the upper crust? springs that feed the most important tributary that provides
How does this distribution affect resource quantity and the largest discharge to the Sacramento River headwaters.
quality? How does this distribution affect propagation Given evidence of young faulting that displaces Quaternary
of seismic energy and ground shaking? How does this volcanic rocks, this region, where the Walker Lane,
distribution affect landslide hazard and post-fire erosion? Cascade Arc, and Basin and Range province intersect, has
How do we best assign physical and hydrological a surprisingly substantial gap of geologic mapping, even
properties to rock and sediment volumes? at a scale of 1:250,000. Although geologists in the Volcano8 Implementation Plan for the Southern Pacific Border and Sierra-Cascade Mountains Provinces
Hazards Program (of the California Volcano Observatory) understanding of the geologic, stratigraphic, structural, and
are mapping the region between Lassen Peak and Mount tectonic evolution of the region.
Shasta, their efforts are not focused on the geohydrologic
framework of the area and could be augmented by
geophysical constraints.
Geologic Mapping Objectives
The following sections describe the geologic mapping
Phase 2 Scientific Objectives objectives for each of the three phases. Objectives are tied to
As mentioned above, there are overarching scientific themes and scientific objectives described above and directly
objectives for the region that will continue throughout the phases to activities in each phase.
of study planned here. Experience has shown that prioritizing
specific scientific questions within those overarching objectives Phase 1 Geologic Mapping Objectives
is a fluid exercise. New scientific questions are developed during
the answering of existing questions or are generated by events The first phase will consist of several main mapping
like large earthquakes. Specific scientific questions may also be objectives.
prioritized based on needs of partners and collaborators, as well as
changing societal drivers, such as drought, land development, or
resource requirements. Therefore, prioritizing scientific questions Mapping Objective 1. Merge and Update 3D
beyond phase 1 should be interpreted as our current view, and not a Maps of Different Resolution and Content
definitive statement of what priorities will be 4 or 8 years from now.
Scientific questions that would logically follow those A major effort is to create a new 3D geologic map of eastern
listed for phase 1 include: Sacramento Valley and the Sierra Nevada foothills. This effort
extends the existing Delta 3D and San Francisco Bay 3D maps
1. How is slip accommodated as a result of the Transverse and supports the scientific objective listed above. It will also help
Ranges rotation? improve the 3D seismic velocity model and associated earthquake
2. When and how did the big bend in the San Andreas Fault hazard studies in this region.
form? As part of our ongoing effort to update and combine 3D
geologic maps, in collaboration with USGS Earthquake Science
3. How do faults east of the San Andreas Fault interact with the Center, we will develop strategies to integrate revised 3D map
subduction zone north of Cape Mendocino? volumes and seismic velocity models into existing maps and
Rotation of the Transverse Ranges and development of the models devoid of map boundary discontinuities that will impair
“big bend” in the San Andreas Fault have a profound influence their use for modeling seismic wave propagation and earthquake
on the geology of southern California. However, slip evolution shaking. We intend to use the volume around the recent magnitude
through time north of the Transverse Ranges in the central 6.0 Napa earthquake as a test case, developing a more detailed
California Coast Ranges is only known in a few places and is a model of the 3D geology in a way that can be smoothly integrated
subject of debate. Several models propose when the “big bend” into the existing model. This work will also benefit from ongoing
in the San Andreas Fault formed, but data to test these models efforts to develop new techniques to analyze potential-field data.
are inadequate. New constraints from targeted mapping and As part of our effort to extend and improve 3D geologic
development of 3D models through time can provide a different maps, we will compare a new, relatively detailed, geology-based
approach to addressing these questions. 3D seismic velocity model with a detailed seismic refraction
The San Andreas Fault ends at the Mendocino triple junction, experiment completed as part of the central Coast Ranges
yet strike-slip faults to the east appear to continue north. How much Pacific Gas and Electric (PG&E) Cooperative Research and
slip is carried north of the triple junction, how these faults interact Development Agreement (CRADA) work over the last decade.
with the subduction zone, or how deformation is associated with Like the work described above for the eastern Sacramento Valley
and Sierra Nevada foothills, this comparison would contribute to
the clockwise rotation of the Oregon block are not well known.
development of techniques to combine geology-based 3D seismic
Research based on these questions will address aspects of the
velocity models with models derived from other datasets.
subduction zone that could leverage efforts of the North Pacific
Abundant geophysical and subsurface geologic data will be
province projects and the Earthquake and Coastal and Marine
used to construct a digital basin-scale 3D geologic framework in
programs, especially if the subduction zone initiative expands.
the structurally complex central California Coast Ranges. With
CRADA funding, the 3D mapping could be expanded to crustal
Phase 3 Scientific Objectives scale and include deep structure and crustal block boundaries. This
effort ties together existing San Francisco Bay, San Andreas Fault,
Develop province-wide 2D and 3D subsurface maps of and Santa Maria 3D maps and supports the scientific objective
structural features (faults and folds), stratigraphic unit extent, listed above. It also leverages external funding and supports
elevation, and thickness that will lead to province-wide scientific cooperative research goals.Geologic Mapping Objectives 9
Mapping Objective 2. Geologic and Geophysical slip as the easternmost major fault of the San Andreas Fault
System. Mapping in this region will provide the basis for future
Mapping in Areas of Poor Coverage along the
3D geologic mapping (see mapping objective 5 below).
Transform Margin A third part of this objective is to create 1:12,000-scale
This effort will consist of two areas of mapping. The first, Quaternary surficial geologic maps of Channel Islands National
building on NCGMP efforts currently underway as we move into Park, which will be generated in collaboration with National Park
phase 1, consists of detailed mapping in southern California to Service (NPS) research and resource interests. These detailed
determine how slip transfers off of the mapped San Andreas Fault process- and age-based maps rely heavily on lidar-derived
north into the Eastern California Shear Zone and south onto the topography and derivative metrics associated with above-ground
San Jacinto Fault. The second area, in northeastern California, vegetation characteristics. Map information will be used to
will augment mapping efforts by geologists (mostly emeriti) in evaluate recency of faulting, landslide density and type, activity of
the Volcano Hazards Science Center to provide a geohydrologic eolian processes, and constraints on surface water availability in
context. In northeastern California, regional geologic mapping this water-limited landscape.
will occur in exposed volcanic rocks that are perhaps California’s
most amenable place to use combined geologic and geophysical
mapping techniques owing to the strong magnetic properties of
Mapping Objective 5. New Mapping in Support
extensive areas of young volcanic rocks. of 3D Mapping and (or) Regional Compilations
Another effort is to create a new geologic map of the
Mapping Objective 3. Regional Compilation Sierra Nevada foothills in the Auburn-Placerville region. This
effort builds on unpublished mapping (R.W. Graymer’s regional
of a 1:250,000-Scale Seamless Geologic Map geologic mapping project of the San Francisco Bay region [Ph.D.
Database dissertation]) in a rapidly developing and geologically complex area.
This mapping is collaborative with and complementary to current
A broad goal of this program is to create a seamless
California Geological Survey (CGS) mapping projects and partly
1:250,000-scale regional geologic map compilation of the Sierra
lies within an area identified by CGS as high priority but not on their
Nevada. This effort will produce a multilayer, multipurpose
list of planned mapping. This effort will also support both the Sierra
geologic map compiling the best available geologic and
Nevada compilation map and eastern Sacramento Valley and Sierra
geophysical data for the region. This task will also include an
Nevada foothills 3D map (see mapping objectives 1 and 2 above).
outreach component, providing a nontechnical geologic guide of
the region. This task will leverage the knowledge and enthusiasm
of emeriti to augment project work by active personnel. Phase 2 Geologic Mapping Objectives
Phase 2 objectives would expand existing 3D geologic maps
Mapping Objective 4. New Detailed Geologic outward by incorporating and updating 3D geologic information
Mapping in Support of Fellow Department of in the San Joaquin Valley, expanding the central Sacramento
Interior Agencies Valley model northward, and fully developing a 3D geologic map
of the central California Coast Ranges. In the Central California
One part of this objective is to create a 1:24,000-scale map Coast Ranges, 3D geologic mapping techniques would be used to
of Pinnacles National Park and vicinity. We will complete mostly (1) understand the nature of groundwater aquifers (in the Salinas
finished geologic mapping from previous projects and provide valley and Paso Robles) and hydrocarbon reservoirs (in San Ardo,
more detailed and updated depiction and interpretation of geologic Santa Maria, and Cuyama districts) in this region, focusing on
resources for the eastern half of the national park. This effort also fault architecture, folding, uplift, and basin stratigraphy, and (2)
supports the central Coast Ranges 3D geologic map effort listed use the 3D geometry to further understand the evolution of the
above and provides constraints on timing and amount of Neogene plate boundary and the partitioning of slip within the San Andreas
slip on the San Andreas Fault. Fault System. Compilation of the Sierra Nevada geologic map will
A second part of this objective is to create a 1:24,000- set the stage for projecting this information into the subsurface.
scale map of Berryessa Snow Mountain National Monument Mapping will continue at appropriate scales for determining
and its vicinity. This effort involves detailed geologic mapping slip history in the area of the “big bend” in the San Andreas Fault
in a poorly mapped and understood region. We will complete and western Transverse Ranges and how it pertains to basin and
mapping that started with the Delta 3D project to study the uplift landscape development.
rate along the Coast Ranges-Central Valley boundary, which has
been modeled as resulting from slip on active blind reverse faults
that pose a poorly understood hazard to valley communities and Phase 3 Geologic Mapping Objectives
infrastructure. This work will also provide constraints on the
geometry of the Berryessa-Bartlett Springs fault connection, which Mapping objectives at phase 3 have not yet been determined
accommodates as much as 9 millimeters per year of right-lateral to allow flexibility in the project.10 Implementation Plan for the Southern Pacific Border and Sierra-Cascade Mountains Provinces
Needed Capabilities • National Geospatial Program.—Lidar acquisition will aid
in detailed mapping of faults and geomorphic features that
NCGMP and science center workforce planning efforts will tie to earthquake, volcano, landslide, and flood hazards.
specify long-term staffing needs by addressing critical geologic
specialty skill sets required for integrated geologic mapping and
research tied to the described societal and scientific priorities. Other Federal Agencies
For developing 3D maps, bedrock and surficial geologists with
NCGMP field investigations provide a regional framework
mapping expertise, potential-field geophysicists, and support
and detailed mapping for land-use and natural-resources
staff who can work with 3D datasets, software, and enterprise
management for multiple agencies, including the following.
geographic information systems (GIS) are necessary, but
opportunities exist for coordinating efforts with USGS Core • National Park Service
Science Systems, Natural Hazards, Water Resources, Energy and
• Bureau of Land Management
Minerals, and Ecosystems Mission Areas.
• U.S. Forest Service
• Bureau of Reclamation
Partners
• Department of Defense facilities (for example, Vanden-
One rationale for having NCGMP in the Core Science berg Air Force Base)
Systems Mission Area is that geologic and geophysical mapping
and related studies result in knowledge that may contribute
to efforts underway in several other mission areas. Therefore, State and Local Agencies
NCGMP projects that focus on the southern Pacific Border and
Sierra-Cascade Mountains provinces currently—and will continue • California Geological Survey.—NCGMP field
to—work cooperatively and collaboratively with other programs investigations contribute to State 1:100,000-scale mapping
in the USGS, with other Federal, State, and local agencies, efforts and provide input to California Geological Survey
and with academic partners. Most of these collaborative and in its Alquist-Priolo (re)evaluation of fault zones and
supportive efforts are especially relevant societally. It is important evaluation of alluvial-fan flood hazards.
that NCGMP receive acknowledgment from stakeholders
regarding the value and significance of input received from our • California Department of Water Resources.—This agency
geologic, geophysical, and stratigraphic studies in facilitating and has cooperated with ongoing efforts in characterizing
accomplishing their missions. Ongoing collaborations and societal the geohydrologic framework by providing water well
relevance are listed below. lithologic data. Closer collaboration and cooperation should
be pursued for planning our 2D and 3D mapping efforts.
Other USGS Programs • County and local governments.—NCGMP investigations
have been funded and utilized by county and local
• California Water Science Center.—NCGMP field governments to provide scientific expertise to groundwater
investigations serve as the foundation for hydrogeologic investigations and seismic hazard assessments.
modeling by the Water Resources Mission Area.
• Earthquake, landslide, and volcano hazards.—In support Private Industry
of work conducted in the Natural Hazards Mission Area,
NCGMP field investigations provide (1) a regional Private industry, particularly the Pacific Gas and Electric
interpretive framework for evaluating earthquake (fault- Company, represents a substantial user base, and at times a
rupture and ground shaking) and landslide hazards, (2) funding source, for 2D and 3D mapping science in support of
detailed mapping that can support local and regional hazard assessment of its infrastructure.
hazard assessments. Both contributions are particularly
relevant in densely populated regions of hazard-prone
California. Academic Entities
• Energy and mineral resources programs.—NCGMP • Southern California Earthquake Center
framework studies have contributed to assessment
of resources as well as impacts of extraction of those • Various university geoscience departments in support
resources. of FEDMAP proposalsReferences Cited 11
Anticipated Outcomes References Cited
1. Improved earthquake hazard modeling through improved Brock, J., Berry, K., Faulds, J., Berg, R., House, K., Marketti,
3D seismic velocity models and improved parameterization M., McPhee, D., Schmidt, K., Schmitt, J., Soller, D.,
of earthquake sources.—Through development of new Spears, D., Thompson, R., Thorleifson, H., and Walsh, G.,
3D geologic maps and improvements in methods used to in press, Renewing the National Cooperative Geologic
assign seismic velocities to them, along with work to better Mapping Program as the Nation’s Authoritative Source
integrate geology-based models with tomographic models, for Modern Geologic Knowledge: U.S. Geological Survey
we will improve a basic dataset needed for calculation of Open-File Report 2021–1013, https://doi.org/10.3133/
transmission of earthquake energy through the upper crust ofr20211013.
and resultant ground shaking. Through analysis of surface
and subsurface fault geometry and connectivity we will Drenth, B.J., and Grauch, V.J.S., 2019, Finding the gaps in
improve understanding of potential earthquake size and America’s magnetic maps: Eos, v. 100, accessed January 24,
type, as well as better define ground rupture hazards related 2020, at https://doi.org/10.1029/2019EO120449.
to complex fault zones and systems.
Fenneman, N.M., 1917, Physiographic subdivisions of
2. Improved geohydrologic frameworks for groundwater the United States: Proceedings of the National Academy of
modeling.—Through 3D geologic and physical property Sciences, v. 3, p. 17–22.
modeling of basin aquifers, we will improve geohydrologic
frameworks for the northern Sacramento Valley, Salinas Fenneman, N.M., 1928, Physiographic divisions of the United
valley, Russian River watershed, and San Antonio Basin. States (3rd revision with map): Annals of the Association of
American Geographers, v. 18, no. 4. p. 261–353.
3. Improved understanding and interpretation of geologic
resources of Pinnacles National Park.—New geologic Fenneman, N.M., 1946, Physical divisions of the United
mapping and paleontology will better define the geology and States: U.S. Geological Survey Report, scale 1:7,000,000.
geologic history of the eastern half of the park.
Johnson, M.R., Anderson, E.D., Ball, L.B., Drenth,
4. Updated and consolidated geologic map of the Sierra B.J., Grauch, V.J.S., McCafferty, A.E., Scheirer, D.S.,
Nevada.—The combination of geologic, geophysical, Schweitzer, P.N., Shah, A.K., and Smith, B.D., 2019,
radiometric age, and paleontological datasets will provide Airborne geophysical survey inventory of the conterminous
the foundation for improved land-management decisions United States, Alaska, Hawaii, and Puerto Rico: U.S.
in a rapidly developing region and new general-audience Geological Survey data release, accessed January 25, 2020,
outreach products for a popular tourist area. at https://doi.org/10.5066/P9K8YTW1.
Moffett Field Publishing Service Center, California
Manuscript approved February 12, 2021
Edited by Aditya Navale
Layout by Cory HurdLangenheim and others—Implementation Plan for the Southern Pacific Border and Sierra-Cascade Mountains Provinces—Open-File Report 2021–1012
https://doi.org/10.3133/ofr20211012
ISSN 2331-1258 (online)You can also read