Implementation of a solar model and shadow plotting in the context of a 2D GIS - Archive ouverte HAL
←
→
Page content transcription
If your browser does not render page correctly, please read the page content below
Implementation of a solar model and shadow plotting in
                              the context of a 2D GIS
  Challenges and applications for the cooling eect of tree-covered based
                greening solutions in urban public spaces

     Thomas Leduc, Xenia Stavropulos-Laaille, Ignacio Requena-Ruiz
                     {thomas.leduc, xenia.laaille, ignacio.requena}@crenau.archi.fr

                                          May 7, 2021
Leduc et al. (AAU / CRENAU)        Solar model and shadow plotting                     May 7, 2021   1 / 15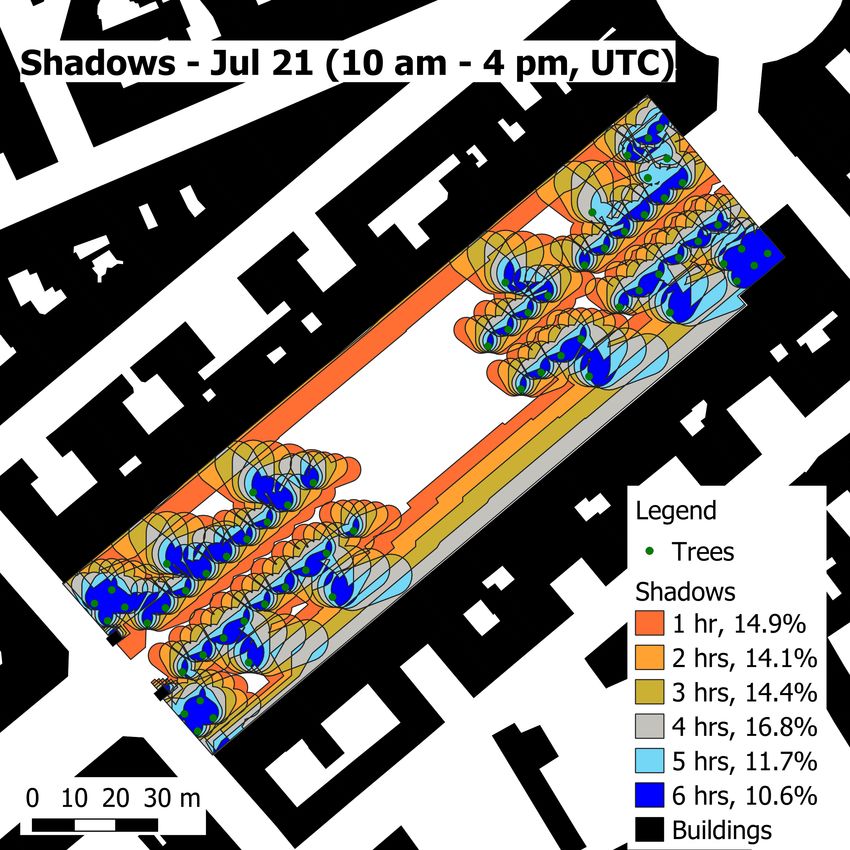
Introduction
Urban cooling strategies
Urban bioclimatic speci
c response (Sobstyl et al., 2018)
I Overheating ampli
cation
I Mitigation and adaptation strategies (Aram et al., 2019)
• Vegetative cover
• Stack night ventilation
• Water bodies
• Modi
cation of surface albedos
I Shading is a key measure to improve OTC
1 and mitigate UHI2
(Ruefenacht and Acero, 2017), (Aleksandrowicz et al., 2020)
• incoming solar radiation interception, evapotranspiration, etc.
The Coolscapes research program (ANR-18-CE22-0003)
I An interdisciplinary approach to understand the manifold phenomena
in
uencing citizens' thermal perception
1 OTC: outdoor thermal comfort
2 UHI: urban heat island
Leduc et al. (AAU / CRENAU) Solar model and shadow plotting May 7, 2021 2 / 15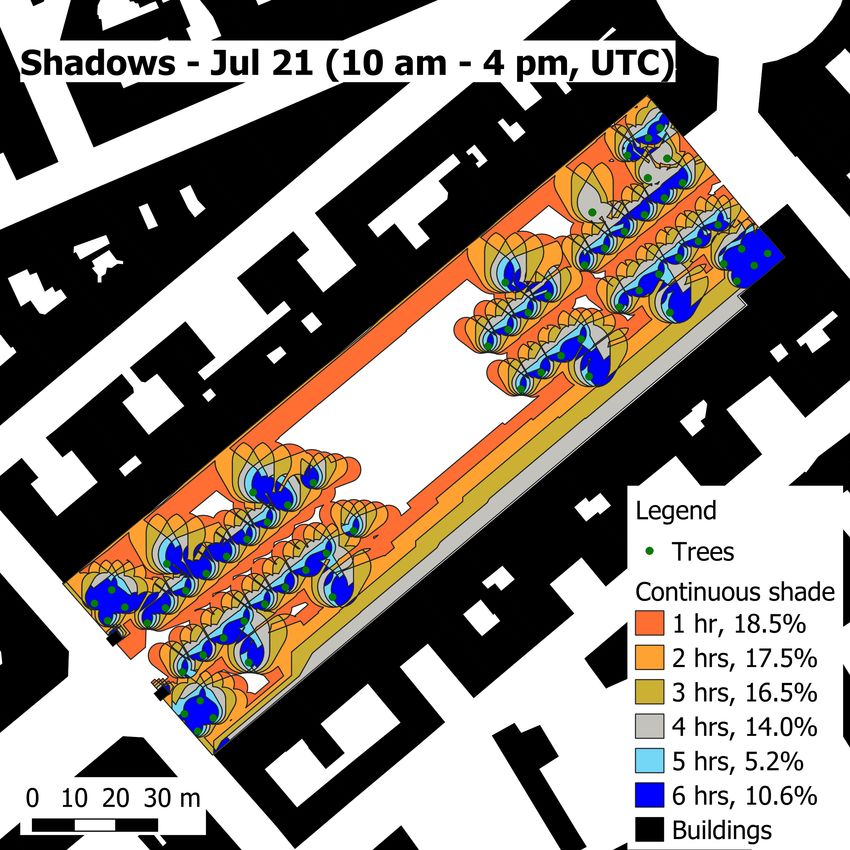
Introduction
Sunlight exposure in streets is directly linked to design
decisions
The strictly geometric aspects of shading is essential in answering
simple questions like:
I Where are located the shadow fences generated by the urban
environment at a given date and time?
I How much space of a prede
ned study area is in shade for a given date
and time?
I What is the tree canopy contribution to the total shade cover?
I What is the evolution of this contribution over the summer period, the
crown remaining unchanged?
I What areas are shaded for at least 3 hours on a hot summer day?
I What areas are shaded for at least 3 consecutive hours on a hot
summer day?
I Do these areas guarantee spatial continuity in order to allow
comfortable pedestrian mobility?
Leduc et al. (AAU / CRENAU) Solar model and shadow plotting May 7, 2021 3 / 15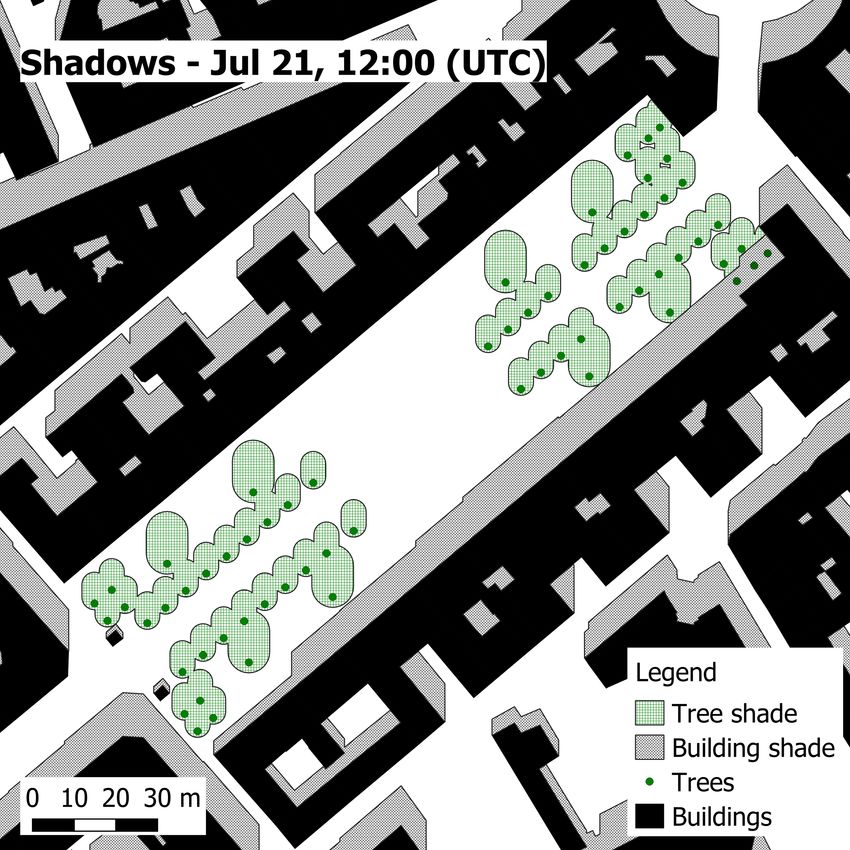
Introduction

Reference tools

     Numerical modeling of the urban climate: several softwares are
     designed to calculate radiation and thermal comfort conditions
        I   CAAD-based
               •   Townscope
               •   Heliodon 2
               •   Solene
               •   etc.
        I   Grid-based
               •   RayMan
               •   Solweig → UMEP (QGIS plugin)
               •   CityComfort+ (Rhino, Radiance, raster layer in ArcMap 10)
               •   Ladybug/Honeybee (Rhino, Dynamo, Radiance, EnergyPlus, etc.)
               •   ENVI-met
               •   TUF-3D (3-D raster structure)
               •   etc.

Leduc et al. (AAU / CRENAU)     Solar model and shadow plotting      May 7, 2021   4 / 15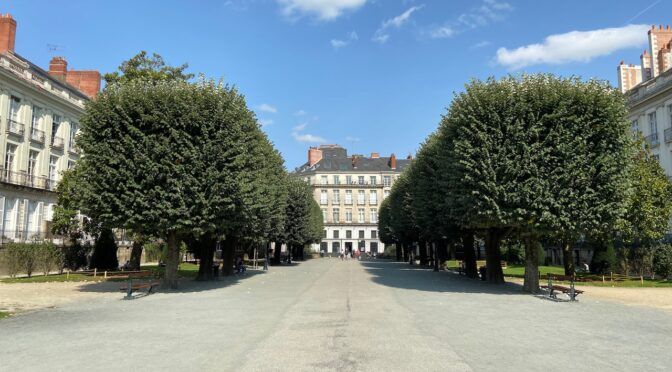
Method

Technical solution implemented

     Geopandas (pandas + shapely), Pysolar, etc.

     3D Management: buildings as right prisms, spherical/ cylindrical/
     conical trees
                      Shadows time lapse, unit cube, spring equinox
                      From 08:07 to 16:21 (UTC), 10 min. time step

                 1m

     Shadow overlaps through contour network polygonization

Leduc et al. (AAU / CRENAU)                  Solar model and shadow plotting   May 7, 2021   5 / 15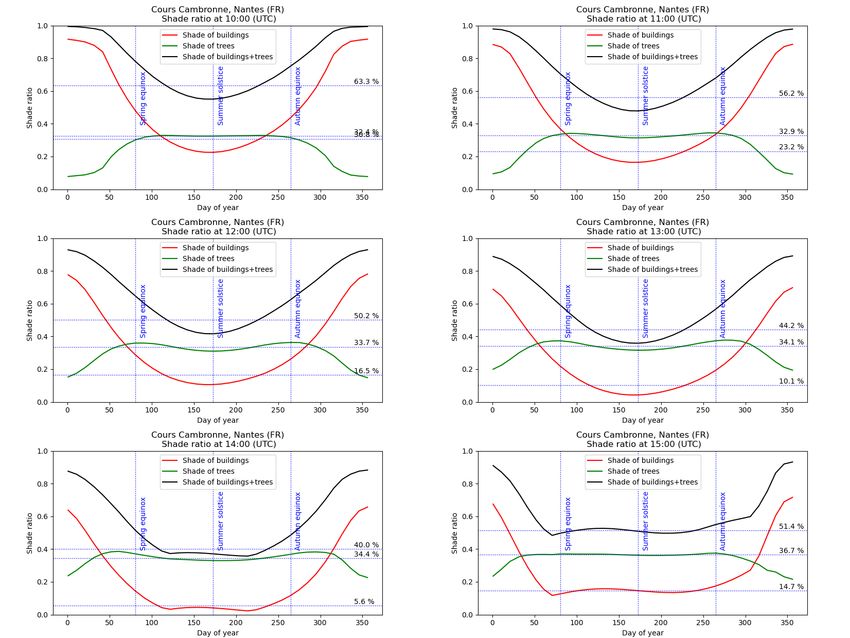
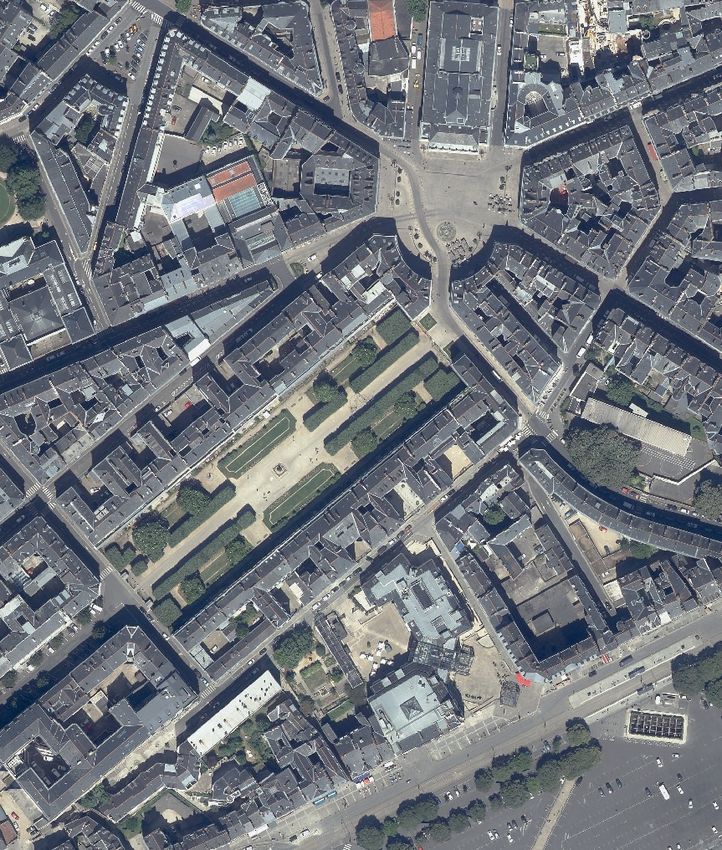
Case study
Case study: Cours Cambronne (Nantes, France)
Graslin district: 13.6 ha,
293 buildings (
oor area:
6.4 ha), 98 trees
Cours Cambronne: a public
walkway lined with buildings and
64 trees, 180m × 50m
Leduc et al. (AAU / CRENAU) Solar model and shadow plotting May 7, 2021 6 / 15
Case study

Case study: Shade contribution of the tree canopy

                                                           On 21st July at 12 am
                                                           (UTC), the 293 buildings
                                                           and 98 trees produce a
                                                           ground shade of approx.
                                                           2.8 ha, i.e. approx. 20% of
                                                           the district total area

                                                           The shade produced by the
                                                           tree canopy represents about
                                                           16% of the total shade on
                                                           the ground

Leduc et al. (AAU / CRENAU)   Solar model and shadow plotting            May 7, 2021   7 / 15
Case study
Case study: Shade ratio evolution over the summer period
The tree-shades
cover on average
one third of the
courtyard
This contribution
is almost
systematically
higher than that
of the
surrounding
buildings (×6 at
2 pm UTC)
Leduc et al. (AAU / CRENAU) Solar model and shadow plotting May 7, 2021 8 / 15Case study
Case study: Delineation of shaded areas over several hours
Try to delineate potential
cool spots during a heat
wave event
Although the central
strip situated halfway
between the two rows of
trees is
nally fairly
exposed, the tree roots
are very well protected
Leduc et al. (AAU / CRENAU) Solar model and shadow plotting May 7, 2021 9 / 15Case study
Delineation of shaded areas over several consecutive hours
Handling temporal
continuity beyond spatial
continuity
Delineate areas that are
permanently in the shade
(to design and deploy
appropriate street
furniture)
The overall
fragmentation decreases,
patterns that guarantee
a certain spatial
continuity emerge
Leduc et al. (AAU / CRENAU) Solar model and shadow plotting May 7, 2021 10 / 15Discussion
Discussion: pros
Pros: beyond descriptive analysis, shadow as a design object
I While it is possible to vectorise the raster shadows obtained via UMEP,
the underlying pixelisation is nevertheless problematic when seeking to
use shadows for the design of urban spaces as given, for example, in
the solar envelope concept (Knowles, 2003)
I Vector shadows enable to delineate potential cool-paths and urban
oases or cools spots in the urban fabric
I Simple and automatique method based on standard urban data. On
the shelf, easy and fast to apply to a big study area
Leduc et al. (AAU / CRENAU) Solar model and shadow plotting May 7, 2021 11 / 15Discussion
Discussion: contras
Contras: need for an energy-based approach
I The current method is not based on DEMs → the interactions between
the topography and the sun path model are not considered
I The simpli
ed and strictly geometric approach is not su
cient to
properly inform the complex notion of pedestrian thermal comfort in
heterogeneous urban spaces
• Particular building geometries (e.g., walkways, porches, steep rooftops)
are not considered
• Thermal comfort simulation tools such as ENVI-met allow studying the
spatial distribution of thermal comfort indexes by integrating an
energy-based approach
I Using a more representative geometric approach, based on 3D city
models (ex. CityGML (Biljecki et al., 2018)) and a thermo-radiative (or
even aeraulic) model would make it possible to transform this
prototype into a more relevant tool for city designers
Leduc et al. (AAU / CRENAU) Solar model and shadow plotting May 7, 2021 12 / 15Conclusion
Conclusion
An overlay to Geopandas which bene
ts from the combined power of
the pandas and shapely libraries in particular, but also from a highly
developed ecosystem (notebooks in particular)
To assist urban designers with GIS&T solutions that make it possible
to distinguish the respective shadow contributions, their annual
evolution and potential spatial or temporal continuities
To go beyond the calculation and descriptive analysis of the shadows
cast in the urban space and to use them as standard polygonal shapes
Leduc et al. (AAU / CRENAU) Solar model and shadow plotting May 7, 2021 13 / 15Conclusion
Perspectives for extension
Development of thermal comfort indicators for outdoor spaces
Implementation of computationally-e
cient radiation exchanges in an
Urban Canopy Model with trees
GIS&T Body of Knowledge - domain applications by UCGIS
I Architecture
I Climate Studies & Atmospheric Science
I Environmental Science & Management
GdR MAGIS 2022-2026: Action de Recherche Géomatique, Ville,
Climat et Pollution, A. Ruas (Univ. Eiel) and T. Leduc
I To better identify, structure and develop geomatics for urban climate
and pollution studies
Leduc et al. (AAU / CRENAU) Solar model and shadow plotting May 7, 2021 14 / 15Conclusion
t4gpd
https://github.com/crenau/t4gpd
https://t4gpd-docs.readthedocs.io
Leduc et al. (AAU / CRENAU) Solar model and shadow plotting May 7, 2021 15 / 15You can also read