Impacts of climate change, potential adaptations and assessment of the role of small ruminants on mitigating climate change - iSAGE
←
→
Page content transcription
If your browser does not render page correctly, please read the page content below
Impacts of climate change, potential
 adaptations and assessment of the role of
small ruminants on mitigating climate change
                 Agustin del Prado agustin.delprado@bc3research.org
                 http://www.bc3research.org/en/agustin_del_prado.html

                 Guillermo Pardo (BC3)
                 Inmaculada Batalla (BC3)
                 Asma Jebari (BC3)
Collaborators:   Martha Dellar (SRUC)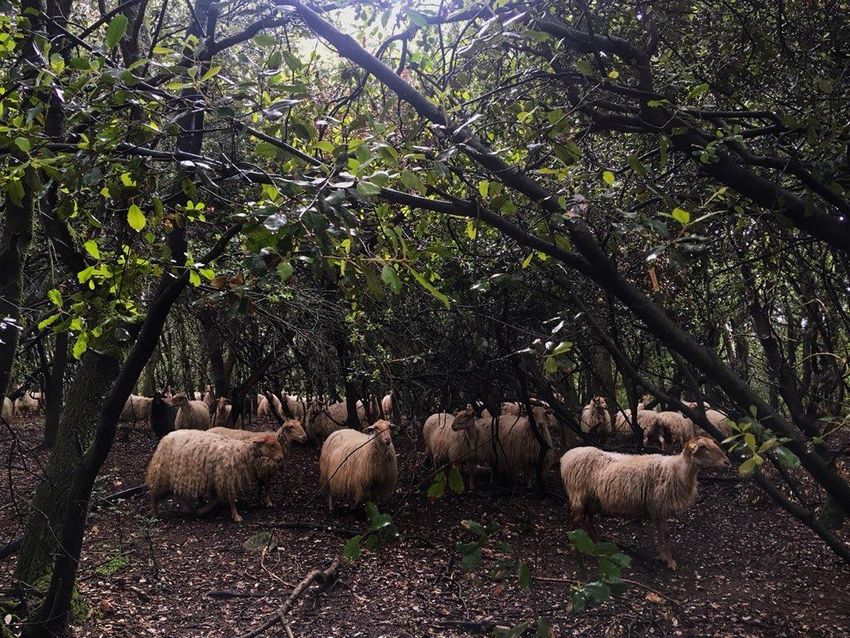
Climate Change: the dimensions
          GHG EMISSIONS/WARMING

              CLIMATE CHANGE

                  IMPACTS

                  RESPONSES

 CLIMATE CHANGE               CLIMATE CHANGE
    MITIGATION                  ADAPTATION

                                               2
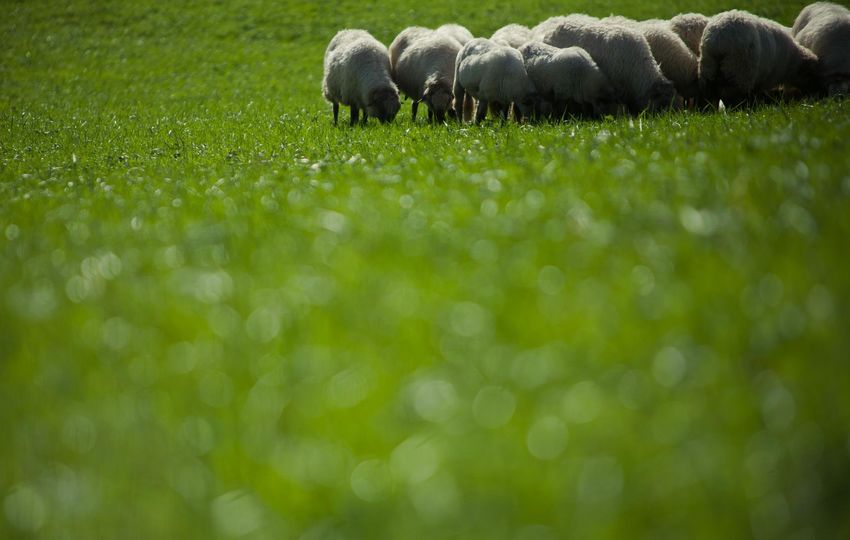
Impacts
Indirect effects on sheep and goat systems (pastures)

Pastures are affected by:
• Rising temperatures
• Changes in rainfall patterns and water availability
• Increasing atmospheric CO2 concentrations

                                           Images: Jacob et al (2014), IPCC (2013)
Indirect effects on sheep and goat systems (pastures)

                                                           Temporary grasslands
                                                14

• Our models showed                             12
  reduced yields in Atlantic                    10
  and southern Europe

                                 Yield (t/ha)
                                                8
• Yield increased in northern
  Europe                                        6                                       Atlantic
                                                                                        Continental
• Little change in continental                  4
                                                                                        Northern
  Europe                                        2
                                                                                        Southern
                                                0
                                                       1971
                                                     1971    -
                                                          - 2000  2021- -2050 2071
                                                                 2021           2071  -
                                                                                   - 2100
                                                        2000       2050          2100
Indirect effects on sheep and goat systems (pastures)

                                                        permanent grasslands
                                               9
                                               8
• Our models showed                            7
  increased yields in most                     6
  regions (no data for
                                               5
  Mediterranean)

                                Yield (t/ha)
                                               4
• Permanent grasslands do                      3                                  Alpine
  better under climate                                                            Atlantic
                                               2
  change – favours extensive                                                      Continental
  grazing systems                              1
                                                                                  Northern
                                               0
                                                   1971 - 2000 2021 - 2050 2071 - 2100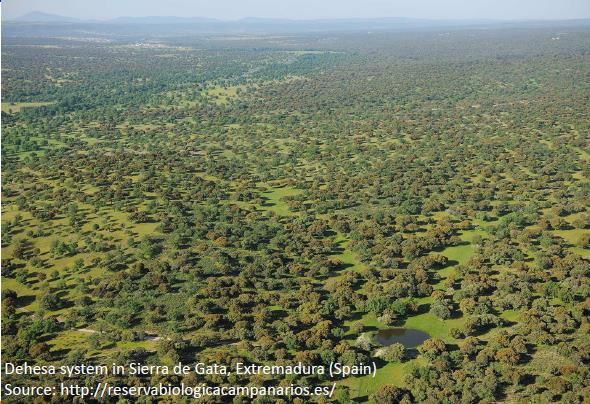
Mediterranean is warming up faster than the rest of the planet

Impacts in the Mediterranean region

•   Reduction in forage yields and quality due to less rainfall and risk of
    drought projection
•   Grazing season is expected to be shortened. Grazing activity will
    suffer from irregular patterns due to extreme events.
•   Encroachment (increase of shrubs)
•   Soil erosion and degradation
•   Heat stress in animals: more frequency and length of heat waves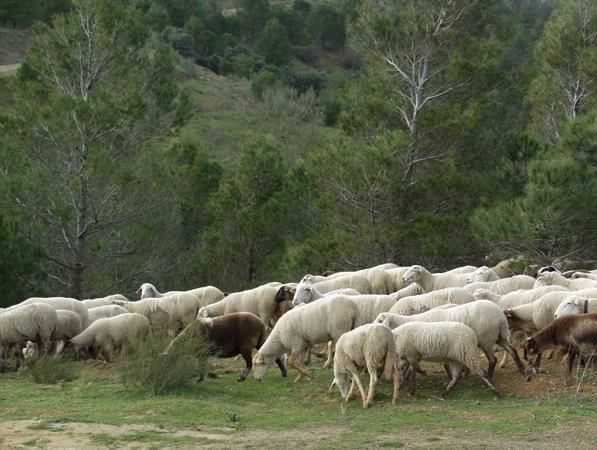
Examples at farm level (Spain and Greece)
Examples at farm level (Spain and Greece)

• From 2021 we need to buy more     • >20% more feed /L after year 2050
  feed
Adaptations
Adaptations: forage

•   Increase pasture diversity:
    •   to enhance resilience under variable climatic conditions to adapt to potential
        shortages of protein sources (mixed legume-grass)

•   Improved plant breeding (long-term):
    •   developing varieties that can survive long drought periods and recover rapidly
        following autumn rains (e.g. tall fescue, cocksfoot and Lucerne varieties)
Adaptations: forage
• Crop residues: Post-harvest cereals, olive leaves
• Underutilized feedstuffs from agro-industry by-products
• Olive cake
• Citrus pulp
• Tomato by-products
• Other vegetables and fruits (e.g. cucumbers, pomegranate)Adaptations: forage (integrated approaches)
• soil and water protection (cover crops)
• different feeds aligned to different seasonal constraints
(agro-forestry)
• fire-risk protection (grazing management)Adaptations: animal
• Prevention of heat stress conditions
-Indoors: stock density, barn orientation/dimensions, ventilation, spraying
-Outdoors: provide protection with trees or artificial shelters
• Feeding/Nutritional management:
-shifting meals to late afternoon or evening, increasing number of meals
-low fibre diets (decrease forage:concentrate), increase energy density,
supplements (fat-rich feeds, whole flaxseed)
• Animal breedingAdaptations at the farm level: animal breeding Chios (dairy) (Greece)
Adaptations at the farm level

                                    Effect of heat on milk productivity on Summer Housed
                                    (alfalfa+corn fed)

                                                    4 scenarios
                                                    • No HS
                                                    • HS (non-adapted)
                                                    • HS (adapted-diet)
                 Manchega (Spain)
                                                    • HS (Adapted-spraying)
Modelled with SIMSSR
Adaptations at the farm level
HS (non-adapted)
10%
>10% reduction in milk
% change in milk (L/ewe day)
5%
0.12 kg DM extra/L milk (less efficient)
0%
01/07/2015
02/07/2015
03/07/2015
04/07/2015
05/07/2015
06/07/2015
07/07/2015
-5%
HS (adapt-diet)
-10% soybean meal
-15% 2% reduction in milk
-20%
-25%
date
HS (adapt-spraying)
HS (non-adapted) HS Adapt (diet) HS Adapt (Spray)
Small positive effect
34,5
32
30,6 30,5 31
29,5
temperature (ºC)
25
01/07/20
02/07/20
03/07/20
04/07/20
05/07/20
06/07/20
07/07/20
15
15
15
15
15
15
15Adaptations vs. mitigation at the farm level
Enteric-CH4
55
54
CH4/Lmilk
53 with HS with HS+DietAdapt
52
CH4 intensity (CH4/L milk)
g CH4/L milk
51 non-adapted
50 increases with heat stress
49
48 except if adapted with diet
47 Adapted-diet
46
45
01/07/20
02/07/20
03/07/20
04/07/20
05/07/20
06/07/20
07/07/20
15
15
15
15
15
15
15
So, supplementation of more dense diet is a win-win for
both adaptation to climate change and mitigation?Adaptations vs. mitigation at the farm level
+32% total C-footprint
3,0
using soybean meal
enteric-CH4 Diet
0.62 vs. 1.27 kg CO2-e/kg DM feed after
2,5
kg CO2-e/L milk
inclusion of soybean meal
2,0
1,5
1,0
+5% -3% +6%
0,5
0,0
no HS +HS +HS+DietA +HS+SprayA
C footprint accounting enteric CH4+ feed footprintHow much European small ruminants (in Europe) are to blame for climate change? https://www.youtube.com/watch?v=NbO4EEaH7YM&t=29s (English) https://www.youtube.com/watch?v=QVH5142rhkg (Español)
GHG emissions from small ruminant systems in Europe
Direct emissions
20%
CH4-enteric CH4-manure NH3 stor+house NH3 spreading
NH3 grazing N2O storage N2O application N2O grazing 10%
120000
% GHG change relative to year 2017
100000 0%
1961 1990 2010
80000
-10%
kt CO2-e
60000
-20%
40000
-30%
20000
-40%
0
1979
2013
1961
1963
1965
1967
1969
1971
1973
1975
1977
1981
1983
1985
1987
1989
1991
1993
1995
1997
1999
2001
2003
2005
2007
2009
2011
2015
2017
-50%
-60%GHG emissions from small ruminant systems in Europe
Direct emissions
20%
CH4-enteric CH4-manure NH3 stor+house NH3 spreading
NH3 grazing N2O storage N2O application N2O grazing 10%
10000
9000
% GHG change relative to year 2017
0%
8000 1961 1990 2010
7000
-10%
6000
kt CO2-e
5000
-20%
4000
3000
-30%
2000
1000
-40%
0
1985
1961
1963
1965
1967
1969
1971
1973
1975
1977
1979
1981
1983
1987
1989
1991
1993
1995
1997
1999
2001
2003
2005
2007
2009
2011
2013
2015
2017
-50%
-60%Update of methodologies for GHG emissions
Direct emissions
-14% -28%
GHG based on IPCC (2006) were overestimated by 18% (sheep) and 28% (goats)How much CH4 and N2O have contributed to warming?
Direct emissions
The large decrease in methane
Contributes to a relative cooling
effect
Based on Cain et al. (2019)Scenarios to mitigate CH4 & N2O from European sheep and goats
Direct emissions
6,00E-04
change -2% change -1% change -0.5%
4,00E-04
change -0.3% change 0.3% change 0.5% 2%
2,00E-04 WARMING
change 1% change 2%
0,00E+00
1% COOLING
warming (K)
-2,00E-04 0.5%
-4,00E-04 0.3%
-0.3%
-6,00E-04
-0.5%
-8,00E-04 -1%
-1,00E-03 -2%
-1,20E-03
Based on GWP* 26Looking at European GHG emissions as an LCA regional approach
Sheep meat in Europe (LCA-based)
0.9%
0.4%
0.4%
0.9%
Chicken meat in Europe (LCA-based)
0.9% 0.9%
FAO data
as inputsLooking at European GHG emissions as an LCA regional approach
protein GHG emissions warming
Year 2010 Reducing 0.9%
Until 2100Efforts to reduce GHG intensity and support C sequestration
Dairy sheep
5 4.1
2.6 1.5
4
0.7
2.6 1.3 SOC ( grasslands)
2.4 0.2
3 2.2
2.6 Other inputs (
1.9 pesticides
1.7 Energy (oil +
kg CO2eq/kg FPCM
2 electricity)
Mineral fertilizers
1 Feed purchased
Indirect emissions
soil (N2O)
0
Direct emissions
sequestration
soil (N2O)
Manure
-1 management
Fully-housed Enteric
fermentation CH4
Carbon
-2
farms
Grazing systems
-3
FSI.1 FSI.2 FSI.3 LSI.4 LSI.5 LSI.6 LSE.7 LSE.8 LSE.9 LSE.10 LSE.11 LSE.12
Batalla et al. (2015)Accounting for soil C sequestration (CO2 emissions can be off-set)
Sheep meat in Europe (LCA-based)
0.4% reduction of CH4 and N2O emissions per yearTake homes
• La intensificación mediante mejora en la eficiencia del
• Impacts
animal noon smallnecesariamente
conlleva ruminant systems
una menorcanhuella
be de
C ,ni unainmejora
severe someenareas
la rentabilidad
in Europede la explotación.
•• Climate policies
Esta mejora should include
en la productividad tailored
puede estar CC
motivando
adaptation strategies una mayor incidencia negativa
(directa o indirectamente)
• European
en la longevidad
sheep y fertilidad
and goatsde loshave
animales.
not caused
additional warming to the atmosphere in
• Es importante que se valore el potencial de la producción
the
last decades
ganadera from direct
en rumiantes GHG
respecto a su emissions.
capacidad de
producir proteina animal a partir de biomasa que no
compite en la cadena alimentaria humana.
31Take homes
• La intensificación mediante mejora en la eficiencia del
• Any strategy
animal towards
no conlleva climate una
necesariamente neutrality should
menor huella de
C ,ni una mejora
consider en la rentabilidad
separating methanedefrom
la explotación.
long-lived
• GHG emissions
Esta mejora and account
en la productividad forestar
puede SOCmotivando
sequestrations in pastures
(directa o indirectamente) una mayor incidencia negativa
• GHG
en la longevidad
reductions y fertilidad
at farmdelevel
los animales.
can provide great
•
climate benefits in comparison with meat from
Es importante que se valore el potencial de la producción
other species
ganadera en rumiantes respecto a su capacidad de
producir proteina animal a partir de biomasa que no
compite en la cadena alimentaria humana.
32Thanks
How much European small
ruminants (in Europe) are to
 blame for climate change?

   https://www.youtube.com/watch?v=NbO4EEaH7YM&t=29s (English)
   https://www.youtube.com/watch?v=QVH5142rhkg (Español)
You can also read