Impact of People's Movement on Wi-Fi Link Throughput in Indoor Propagation Environments: An Empirical Study
←
→
Page content transcription
If your browser does not render page correctly, please read the page content below

electronics
Article
Impact of People’s Movement on Wi-Fi Link Throughput in
Indoor Propagation Environments: An Empirical Study
Nurul I Sarkar * , Osman Mussa and Sonia Gul

                                          Department of Computer Science and Software Engineering, Auckland University of Technology,
                                          Auckland 1142, New Zealand; osmanmussa@gmail.com (O.M.); sonia.gul@aut.ac.nz (S.G.)
                                          * Correspondence: nurul.sarkar@aut.ac.nz

                                          Abstract: There has been tremendous growth in the deployment of Wi-Fi 802.11-based networks in
                                          recent years. Many researchers have been investigating the performance of the Wi-Fi 802.11-based
                                          networks by exploring factors such as signal interference, radio propagation environments, and
                                          wireless protocols. However, exploring the effect of people’s movement on the Wi-Fi link throughout
                                          the performance is still a potential area yet to be explored. This paper investigates the impact of
                                          people’s movement on Wi-Fi link throughput. This is achieved by setting up experimental scenarios
                                          by using a pair of wireless laptops to file share where there is human movement between the two
                                          nodes. Wi-Fi link throughput is measured in an obstructed office block, laboratory, library, and
                                          suburban residential home environments. The collected data from the experimental study show that
                                          the performance difference between fixed and random human movement had an overall average
                                          of 2.21 ± 0.07 Mbps. Empirical results show that the impact of people’s movement (fixed and
                                          random people movements) on Wi-Fi link throughput is insignificant. The findings reported in this
                                paper provide some insights into the effect of human movement on Wi-Fi throughputs that can help

                                          network planners for the deployment of next generation Wi-Fi systems.
Citation: Sarkar, N.I; Mussa, O.; Gul,
S. Impact of People’s Movement on
                                          Keywords: people movement; Wi-Fi throughput; experimental setups
Wi-Fi Link Throughput in Indoor
Propagation Environments: An
Empirical Study. Electronics 2021, 10,
856. https://doi.org/10.3390/
                                          1. Introduction
electronics10070856
                                                Recently, there has been a high demand for information over the Internet which has
Academic Editor: Javid Taheri             escalated the growth of Wi-Fi technology. Various research projects have been conducted
                                          to identify the performance of Wi-Fi networks in different environments, but the impact of
Received: 12 February 2021                people’s (human) movement on Wi-Fi link throughput has not been explored thoroughly.
Accepted: 31 March 2021                         The growth of IEEE 802.11 (“802.11”) wireless local area networks (WLANs), com-
Published: 3 April 2021                   monly known as Wi-Fi, was mainly due to the simplicity of setup, cost, and flexibility that
                                          is accessible by this technology. Wi-Fi technology can be quickly set up in places where
Publisher’s Note: MDPI stays neutral      physical wires are not feasible [1]. These areas include, but are not limited to, schools,
with regard to jurisdictional claims in   hospitals, airports, hotel lounges, carparks, cafes, libraries, etc. Wi-Fi technologies may be
published maps and institutional affil-   used to provide quick access to database information, to share files over a wireless medium,
iations.                                  and in ad hoc office environments, etc. Schools can also benefit from this technology as it
                                          facilitates e-learning and increases revenue and scalability for multiple users in different
                                          locations, thus increasing the area size of the wireless network for more users to access
                                          data [2]. There is no requirement where you need to use school computers to do homework
Copyright: © 2021 by the authors.         as users can roam around in various locations, using mobile devices to access information
Licensee MDPI, Basel, Switzerland.        through a wireless network.
This article is an open access article          As Wi-Fi is one of the most popular technologies for information gathering through
distributed under the terms and           the World Wide Web (WWW), the number of technological resources has become more
conditions of the Creative Commons        demanding due to high-end applications (i.e., video streaming), where the capacity of Wi-Fi
Attribution (CC BY) license (https://
                                          has become an issue. The Institute of Electrical and Electronics Engineers (IEEE) committee
creativecommons.org/licenses/by/
                                          has standardized 802.11-based Wi-Fi for users requiring various network performances.
4.0/).

Electronics 2021, 10, 856. https://doi.org/10.3390/electronics10070856                                 https://www.mdpi.com/journal/electronics
Electronics 2021, 10, 856                                                                                            2 of 26

                            Standards provided by IEEE are 802.11 a (released in 1999), 802.11 b (released in 1999),
                            802.11 g (released in 2003), 802.11 n (released in 2009), 802.11 ac (released in 2013), and the
                            new 802.11 ax (released in 2019). These standardized 802.11 network protocols are used
                            depending on the environment in which the Wi-Fi networks are being deployed. A basic
                            example can be justified as if you are in a large organization with heavy users accessing the
                            Wi-Fi network and the area of the building is very large, then using 802.11 n may be feasible
                            because of high data stream rates and because it has large signal coverage. Currently,
                            802.11 n is the common protocol deployed in many residential homes and small offices.
                                 Wireless networks have provided us with great advantages, i.e., quick wire-free setups;
                            however, they lack in performance when data are being transmitted through an obstructed
                            environment. Signal strength can substantially decrease as radio waves can refract various
                            objects in a propagated environment. Performance issues can be encountered with the
                            interference of radio waves occurring in a dense environment; this may cause packet
                            dropping and delays.
                                 To overcome wireless network performance issues and ensure the network is ob-
                            taining its best throughput, researchers have developed various techniques to overcome
                            potential hurdles before deploying the technology. These techniques which are currently
                            being used are: (1) computer simulation (e.g., Ns−3, OMNET + +), (2) radio propagation
                            measurements, and (3) analytical modeling. Computer simulation is an easy and eco-
                            nomical way of designing mock-up versions of a network without the need for expensive
                            hardware. However, it still lacks some important factors from the real-life scenarios, e.g.,
                            human interferences, and the simulators are unable to record the accurate throughput
                            due to the randomness of people’s movement and propagation interferences. Using prop-
                            agation measurements provides a great way of finding the relationship between signal
                            strength and Wi-Fi link throughput due to many factors that influence performance in
                            various environments.
                                 The deployment of a wireless network can be a bit tricky. If Wi-Fi routers are not
                            cautiously placed, it may result in slowed down throughput rates and decreased signal
                            strength. Therefore, careful consideration of access points must be addressed to optimize
                            network performance. Testing the 802.11 technologies in different areas in a heavily
                            obstructed environment can provide a better understanding of where access points (APs)
                            are best placed for better performance. The wireless network deployment may turn out to
                            be very expensive (in terms of time and cost) if proper testing has not been conducted.
                                 In this paper, we study the effect of people’s (human) movement on Wi-Fi link through-
                            put using propagation measurements in real environments, such as a suburban residential
                            house, laboratory, library, lunchroom, and office room. Using different scenarios (no
                            human, fixed human, and random human movement) in a real environment provides a
                            comparative analysis to identify if there is any significant difference in Wi-Fi throughput
                            performance. The advantage of this measurement approach is that the influence of radio
                            propagation is included implicitly, and therefore it provides an unbiased representation of
                            the environment and facilitates trustworthy performance estimation.
                                 The contributions of this study are summarized as follows.
                            •    The main contribution and strength of this paper is the emphasis that practical field
                                 trial measurements using real hardware and software are crucial in developing a good
                                 understanding of Wi-Fi performance as they provide an unbiased representation of the
                                 environment in which the system operates. The most innovative aspect of this paper
                                 is the development of three practical scenarios and some measurement case studies
                                 of multistory buildings and a residential home environment that provide practical
                                 implications for system design and deployment.
                            •    We perform an extensive propagation measurement campaign for in-building Wi-Fi
                                 performance study covering the ground floor and floors 2 to 5 in a multistory building
                                 at Auckland University of Technology (AUT). In a suburban residential home, the
                                 recordings of the experiments were performed in three different rooms (bedroom,
                                 lounge, and garage).
Electronics 2021, 10, 856                                                                                             3 of 26

                            •     We analyze and validate the system performance by conducting about 33 experiments
                                  and 99 field trials in various environments, including an obstructed office block,
                                  lunchroom, laboratory, library, and suburban residential home.
                                 This paper is organized as follows. Section 2 reviews related work on Wi-Fi perfor-
                            mance. In Section 3, we describe our proposed research design and methodology used in
                            the study. Experiment details are discussed in Section 4, and a discussion of the results is
                            presented in Section 5. Section 6 concludes the paper.

                            2. A Review of the Literature
                                 There has been a rapid growth in wireless computing without the requirements of
                            wired networks. A group was formed in 1884 “when electricity was becoming a major
                            force in society” called the Institute of Electrical and Electronics Engineers (known as IEEE).
                            Over the decades, the committee has been a major source for current researchers in the area
                            of engineering and information technology, providing a “global institute” for innovation
                            from practitioners to represent factorial information to users around the world [3].
                                 The IEEE 802.11 Wi-Fi standard was first published in 1997, where it consisted of low
                            data rates of 1 Mbps and 2 Mbps using the frequency band of 2.4 GHz. From this point
                            onwards, the 802.11 standard keeps evolving and many variations are introduced. Table 1
                            gives an overview of the 802.11 standard evolution.

                            Table 1. Common 802.11 standards [4].

                                                                          Maximum         Approximate         Ad Hoc
                                   802.11 Protocol       Frequency
                                                                          Data Rate         Range             Ability
                                   802.11 a (OFDM)         5 GHz           54 Mbps            120 m             Yes
                                    802.11 b (DSSS)       2.4 GHz          11 Mbps            140 m             Yes
                                802.11 g (CCK, OFDM)      2.4 GHz           54 Mbps           140 m             Yes
                                   802.11 n (OFDM)       2.4/5 GHz         600 Mbps           250 m             Yes
                                  802.11 ac (OFDM)         5 GHz           6.9 Gbps       200 m−300 m           Yes
                                 802.11 ax (OFDMA)       2.4/5 GHz         9.6 Gbps          200+ m             Yes

                                  Multiple factors take part in radio propagation, including distance, transmission
                            power, geographical location, and radiofrequency. Therefore, it becomes difficult to simu-
                            late a real-time situation and accurately analyze radio propagation network performance.
                            Radio propagation and signal strengths are affected by numerous factors such as multipath
                            propagation, path loss, interference, and attenuation [5,6].
                                  While many network researchers quantify the key factors influencing the performance
                            of Wi-Fi, the effect of people’s movement on system performance has not been fully
                            explored yet. In this section, we present a comprehensive review of the literature on Wi-Fi
                            link performance by focusing on three key areas: Wi-Fi performance analysis, interference
                            analysis, and adaptive positioning systems.

                            2.1. Wi-Fi Performance Analysis
                                 Various studies have been conducted to explore the performance of IEEE 802.11-based
                            Wi-Fi. In [7], Jiménez, A. et al. have analyzed end-to-end packet delays and throughputs
                            for 802.11 for a Software Defined Network (SDN). The authors have focused on analyzing
                            the Quality of Service (QoS) performance issues for an SDN emulated environment using
                            an NS−2 simulator.
                                 Another very interesting aspect of 802.11 performance has been researched by
                            Nguyen et al. [8]. They analyzed the impact of sources, both saturated and unsaturated,
                            with different QoS parameters. A trackable and comprehensive fixed-point model is
                            presented with closed-form approximation for queue- and bust sizes.
                                 Performance analysis of media access control (MAC) protocols for a cognitive ad hoc
                            network is presented in [9]. In this study, Dappuri and Venkatesh presented a design for a
                            multichannel MAC protocol over the cognitive network, with coupled Markov chain mod-
Electronics 2021, 10, 856                                                                                         4 of 26

                            els using Cognitive Radios (CR)s and licensed users. Investigations were conducted using
                            varied numbers of CRs, spectrum availability, and the number of channels. As discussed
                            earlier, this research area is still open, with many studies exploring the performance of
                            802.11 Wi-Fi. Bedi et al. [10] have also presented a detailed literature survey covering the
                            various aspects of 802.11 wireless local area network (WLAN) performance.
                                  Various research studies are also being conducted for evaluating 802.11-based Wi-Fi
                            performance. Lo E. [11] investigated the impact of signal strength on Wi-Fi link through-
                            put through propagation measurements using experimental methods in an office block,
                            whereas [12] conducted a study on radio interference for Wi-Fi throughput using experi-
                            mental measurements. Sarkar and Sowerby [13] measured Wi-Fi performance in a crowded
                            office. These key researchers have used experimental techniques to produce accurate Wi-Fi
                            throughput performances and data collection.
                                  Our preliminary results on the effect of people’s movement on Wi-Fi performance are
                            published in peer-review conference proceedings [14]. In this paper, we have taken that
                            work to the next level by investigating Wi-Fi link throughput performance using empirical
                            study. We analyze as well as validate the system performance by conducting an extensive
                            field trial measurement in various indoor propagation environments.

                            2.2. Interference Analysis
                                 Various analytical models for WLAN performance are being proposed by many
                            network researchers. In [15], the authors have proposed an analytical expression for
                            measuring WLAN performance while considering inter-network interference. This model
                            is proposed with the concept of airtime and the system performance has been validated by
                            simulations.
                                 Another interesting study is conducted by Gal et al. [16], where a mechanism for
                            continuously measuring QoS parameters for WLAN is proposed. The radio channel
                            interference is analyzed to measure various QoS parameters.
                                 Navarro and Alonso [17] explored the effect of interference when multiple WLANs
                            are used alongside Bluetooth transmitters on a 2.4 GHz band. Results and discussions
                            lead to the fact that the channel interference is acceptable if the distance between the
                            interfering devices is greater or equal to 7 meters. A similar study analyzing the effect of
                            Bluetooth interference on the IEEE 802.11 n network performance is conducted in [18]. The
                            authors suggest taking precautions while installing the WLAN routers to avoid interference.
                            However, with the advancement of technology, many researchers have proposed adaptive
                            positioning techniques for 802.11 routers for minimum or no interference. Some related
                            works based on adaptive positioning systems are described next.

                            2.3. Adaptive Positioning Systems
                                 Batalla et al. [19] have proposed an adaptive localization system which adapts to
                            the changes in the environment for industrial applications. The positioning of industrial
                            components is proposed using received signal strength (RSS). This positioning is adaptive
                            to the changing industrial environment. A similar study is presented in [20], where the
                            analysis of human behavior is conducted to enhance Wi-Fi performance by localizing the
                            network components according to the human movements.
                                 Zhang el al. [21] have proposed another interesting solution for the optimization of
                            Access Point (AP) position for indoor environments. A multi-objective based optimization
                            is conducted considering both connection quality and the strength of the signal.
                                 The summary of related work is presented in Table 2.
Electronics 2021, 10, 856                                                                                              5 of 26

                            Table 2. Summary of related work.

                                 Researcher          Main Contribution       Year        Key Concepts/Description
                                                                                           Positioning of industrial
                                                                                        components is proposed using
                                                    Adaptive positioning
                              Batalla et al. [19]                            2020     received signal strength(RSS). This
                                                          system
                                                                                         positioning is adaptive to the
                                                                                       changing industrial environment.
                                                                                       Multi-objective based adaptive
                                                    Adaptive positioning
                              Zhang et al. [21]                              2020            Access Point (AP)
                                                          system
                                                                                            positioning system
                             A. F. Rochim et al.    System performance                 Comparing the performance of
                                                                             2020
                                    [22]                  study                      802.11 ac and 802.11 ax over 5 GHz
                                                                                          Multiple techniques were
                               H. S. Bedi et al.    Performance analysis
                                                                             2020        investigated to improve the
                                     [10]                of 802.11 e
                                                                                           performance of 802.11 e
                                                                                       Investigating 802.11 ad wireless
                                                     Device analysis to
                              N Kien et al. [23]                             2019      devices performance to support
                                                    switch to multi-Gbps
                                                                                            multi-Gbps capability
                                                    Performance analysis
                               A.Z. Yonis [24]                               2019     Improving 802.11 ac performance
                                                         of 802.11 ac
                                                                                       Investigating the effect of mutual
                              N. Golmie et al.      Mutual interference
                                                                             2003     Interference on the performance of
                                   [25]                 analysis
                                                                                         Bluetooth and 2.11 b Systems
                              M. Heusse et al.      Analysis using DCF               Investigating performance anomaly
                                                                             2003
                                   [26]                  method                          using 802.11 b DCF Method
                                                    Interference analysis            Measuring the impact of interference
                              K. Jain et al. [27]                            2005
                                                     of Wi-Fi networks                 on multi-hop Wi-Fi Networks
                                                    Comparative analysis
                              A. Doefexi et al.                                      Evaluating 802.11 a and 802.11 g in a
                                                    between 802.11 a and     2003
                                   [28]                                                 corporate office environment
                                                     802.11 performance
                                                     Discussed 802.11 n
                               E. Perahia [29]                               2008     Technology evolution of 802.11 n
                                                        technology
                                                    Analysis of increasing              Achieving higher throughput
                                 Y. Xiao [30]                                2005
                                                    802.11 n performance                        in 802.11 n
                                                    Analyzed throughput
                                                                                      Investigating the impact of signal
                                  E. Lo [11]        and signal strength in   2007
                                                                                       strength on Wi-Fi performance
                                                       an office block
                               N. Sarkar et al.       Wi-Fi throughput               Wi-Fi performance measurements in
                                                                             2006
                                    [13]               measurement                    an obstructed office environment
                                                          Analyzed
                                                                                     Indoor Wi-Fi performance in a dense
                               Jhon Stein [31]           propagation         1997
                                                                                             office environment
                                                    interferences in Wi-Fi

                            3. Methods
                                 In this research, we investigated the effect of people’s movement on Wi-Fi link through-
                            put. To conduct this research, radio propagation is measured using both software and
                            hardware tools. Moreover, this research is solely based on experimental trials; therefore, no
                            software simulators are being used. Network simulation packages such as OMNET + +,
                            Riverbed modeler, and ns−3 have limiting factors that do not pose the ability to place
                            real-world characteristics in each scenario [32]. Software simulated methods lack deep
                            study of various Wi-Fi aspects, hence, they are ineffective for this study.
                                 A series of experimental trials was conducted using omnidirectional antennas (wireless
                            cards) and a pair of laptops with identical configuration. We have carried out about
Electronics 2021, 10, 856                                                                                         6 of 26

                            33 experiments, with three trials per experiment (total of 99 field trials). A data file was
                            shared between the two laptops for measuring file transmission time. We used a stopwatch
                            to record file transmission time and the link throughput was then calculated (dividing the
                            file size by transmission time). More details about the field trial measurements’ hardware
                            and software are discussed in Section 4 (Experimental Design).
                                  One of the key strengths of Wi-Fi technology is its cost. The deployment of a Wi-Fi
                            network is very cost-effective, and this enables researchers to investigate various techno-
                            logical aspects using real scenarios and equipment, which yield accurate results. Due to the
                            ability to use real hardware and viewing past case studies, we have adopted experimental
                            methods and propagation measurements rather than simulation study or analytical model-
                            ing to gather precise information. Many key network researchers have used propagation
                            measurement techniques to produce accurate Wi-Fi throughput performances and data
                            collection [11,13,21,33].
                                  Therefore, propagation measurements are used to identify if there is any significant
                            difference throughout the performance of Wi-Fi in various propagation environments
                            (library, office block, laboratory, lunchroom, and a suburban residential home).
                                  Figure 1 illustrates the adopted research methodology. The design is based on a
                            science-based model where the start process is defining propagation measurements for
                            each scenario. This is based on recordings and ensuring during experiments that all objects
                            except for humans stay constant. When the preliminary trials are completed, we then
                            begin the step of experimentation for different scenarios such as random, fixed, and no
                            human movement. Each scenario consists of three trials to measure the accuracy of Wi-Fi
                            throughput between a pair of nodes, which is followed by data collection and validation.
                            Finally, comparative analysis and conclusions are drawn.

                            Figure 1. Research methodology adopted.
Electronics 2021, 10, 856                                                                                              7 of 26

                            4. Experimental Design
                                 For experimenting with this research, we have selected a pair of laptops to form an ad
                            hoc network, which has been placed majorly in four different propagation environments to
                            generate different experiment scenarios, namely, obstructed office block, laboratory, library,
                            and suburban residential home environments.
                                 To identify if the two laptops are receiving good coverage, signal strength is mea-
                            sured in decibel-milliwatt (dBm) by using a software called inSSIDer, and it is referenced
                            to electrical power unit in decibel (dB)—the typical range of wireless signal power in
                            802.11 generally operates between −70 dBm and −90 dBm. Table 3 lists the hardware
                            specifications and software used for setting up the experiments.

                            Table 3. Hardware and software specification.

                                           Hardware                   Specifications
                                                                      Brand: Hewlett Packard
                                            Laptop 1
                                                                      Model: HP Mini 311
                                                                      Brand: Dell
                                            Laptop 2
                                                                      Model: Dell XPS 15
                                                                      Brand: NETGEAR
                               IEEE 802.11 a/b/g/n USB Wireless       Model: WNDA3100 IEEE 802.11 n
                                         Adapter (×2)                 Dual Band (operates at 2.4 and 5 GHz)
                                                                      Backward compatible to 802.11 a/b/g
                                            Software                  Used for
                                                                      Windows OS is required to have the ability to install
                                   Windows OS 7 Professional
                                                                      various software and share data files over a network.
                                                                      inSSIDer is used to measure the signal strength and
                                                                      detect access points in the surroundings. The software
                                            inSSIDer                  can identify hardware vendors of APs, the channel
                                                                      used, name of the network, security protocol used,
                                                                      and frequency that APs are using.
                                                                      The smart wizard is used to create an ad hoc
                                                                      environment between a pair of laptops to share files.
                             NETGEAR WINDA3100 smart wizard
                                                                      This software can show performance changes when
                                                                      data are being transferred over a network.

                                  To measure the throughput, a file is transferred and a stopwatch is used to measure
                            the file transmission time when data are sent across from sender (TX) to receiver (TX). Wi-Fi
                            throughput is calculated using the following formula.

                                                                                Data Size ( MB)
                                                  Throughput ( Mbps) =                                                    (1)
                                                                            Transmission Time (sec)

                                  Propagation measurements were conducted on the ground floor, second floor, third
                            floor, fourth floor, and fifth floor in the WT building at Auckland University of Technology
                            (AUT). In a suburban residential home, the recordings of the experiments were performed
                            in three different rooms, which are a bedroom, lounge, and garage room. The floor plans
                            and images for each room with a description of the propagation environment are shown in
                            Figures 2 and 3, respectively.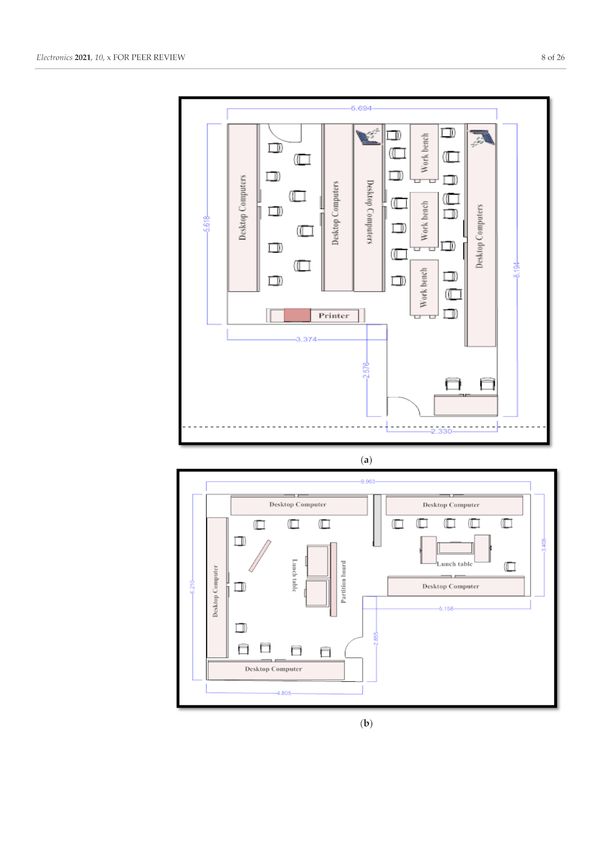
Electronics 2021, 10, 856                     8 of 26

                            Figure 2. Cont.
Electronics 2021, 10, 856                     9 of 26

                            Figure 2. Cont.
Electronics 2021, 10, 856 10 of 26
Figure 2. Cont.Electronics 2021, 10, 856 11 of 26
Figure 2. Auckland University of Technology (AUT) WT Building floor plans for laboratory, lunchroom, and office space.
(a) WT402 Laboratory; (b) WT406 Laboratory; (c) WT306 Laboratory; (d) WT014 Lunchroom; (e) WT523 Lunchroom;
(f) WT401 Lunchroom; (g) WT211 Office room; (h) WT210 Office room.Electronics 2021, 10, 856 12 of 26
Figure 3. Cont.Electronics 2021, 10, 856 13 of 26
Figure 3. Floor plan for a suburban residential home showing lounge, bedroom, and garage. (a) Lounge; (b) Bedroom;
(c) Garage.
Room WT402 laboratory (Figure 2a) was the simplest room, consisting of a laser
printer, several desktop computers, chairs and wooden tables to study on. Inside the lab
room there were two exit doors, each located on both ends of the room. The two laptops
were placed near the back end of the room, which showed higher signal coverage.
WT406 laboratory (Figure 2b) consisted of partition walls in order to separate and
privatize some sections of the room. There was a large quantity of Windows based desktop
computers, which were placed along each side of the room. In the middle there was a
wooden bookshelf, and by the entrance door there were two rubbish bins. In the envi-
ronment of WT406 laboratory room, we placed the laptops near the entrance door as this
measured the highest average point for signal strength.
Room WT306 (Figure 2c) consisted of numerous Apple Mac computers running down
the middle of the room. A document scanner and a laser printer were sitting on a table near
the entrance door. The room is made up of concrete and the ceiling is made of perforated
particle boards for ventilation; however, the window is made of translucent glass. The area
size of the room was at an average of 12.64 × 6.09, where objects also placed in the room
were two fixed white boards and a mobile white board. On the ceiling of WT306 there was
a projector for group discussions and presentation. The placement of the pair of laptops
was near the back end of the lab where the signal strength was strong.
WT014 lunchroom (Figure 2d) was located on the ground floor of the WT building.
The room consisted of kitchen utensils, a microwave, and wooden tables and chairs to
sit and eat lunch on. The laptop placement was located near the entrance door, which
showed overall good signal strength. WT523 lunchroom (Figure 2e) was the largest of the
three environments the experiments were conducted in; however, the room consisted of a
large number of seating chairs and tables for students to have lunch on, vending machinesElectronics 2021, 10, 856 14 of 26
located next to the entrance door for students to have quick snacks, and one water fountain
located opposite the kitchen sink. Additionally, in the room was a microwave, a kitchen
bench, a storage unit for kitchen utilities and a kettle. The pair of laptops was located near
the kitchen sink located at the back end near the room window—this section had showed
good signal strength and no loss in connectivity. Room WT401 (Figure 2f) was the smallest
lunchroom out of the three rooms the experiment was conducted in. The area size of the
room is 3.35 m × 4.42 m, where the room consisted of a microwave, two fridges, an electric
kettle and a wooden table for having lunch on.
Office room WT211 (Figure 2g) had a slightly large open area space during experimen-
tation. A couple of desktop computers, wooden bookshelves, and wooden storage units
were placed in the room for the lecture needs, and a large number of books and lecture
notes were also in the room during experimental study. The room was made up of plaster
boards, a concrete exterior, particle boards and translucent glass for the window. Laptop
placement was located near the back end of the second computer, where this produced
good signal strength. WT210 (Figure 2h) office room was full of paperwork, textbooks and
electronic equipment—the room was full of clutter, which only enabled us to perform the
experiment in the center of the room. However, when placing the pair of laptops in the
center of the room, this still showed good signal strength for data to be sent and received.
In the lounge environment, propagation measurement is made to see all obstruction
objects that can impact the radio signal when data are being transferred between a pair
of nodes. The lounge is not a pure rectangular room, where the distance in meters is
provided by the above image. There are no objects obstructing between the two laptops,
as seen in Figure 3a. In the bedroom environment (Figure 3b), the room is a rectangular
shape, where the area size is 3.804 m × 2.484 m (smallest room conducted in the suburban
residential home). In the room, there are several objects where radio signals can bounce
when transmitting data over the network, and the objects consist of a fabricated single bed,
a wooden desk made of timber and a wooden storage unit. There were many objects in the
garage environment (Figure 3c) which can cause a slight degradation in signal strength
due to the large clutter of objects. The area size of the room is 5.215 m × 5.815 m, where
there was a car placed on one side of the garage.
4.1. Measurement Scenarios
The field trial measurements are conducted for four controlled stages. The stages
consist of (1) preliminary measurement; (2) trial 1; (3) trial 2; and (4) trial 3, where each
trial consists of no human, fixed human, and random human movement between a pair
of nodes.
4.1.1. Preliminary Propagation Measurement
Preliminary trials are conducted in the first stage. The primary purpose of the pre-
liminary measurement is to make sure that there is successful communication between
the sender (TX) and receiver (RX), and in this stage, we also ensure that there are no
packet drops. The ping command “ping –t < ip address > ” (Windows Command Prompt
Graphical User Interface (GUI) using Windows 7 OS) is used on both nodes to address any
packet transmission errors. This preliminary test was conducted for two minutes to ensure
packets were not dropping during transmission before conducting any further experiments.
Additionally, the measurement for best signal strength was used in the experiments by
software insider, which confirmed the placement of the pair of laptops in an area with good
signal strength.
Once preliminary tests were successfully completed, we moved to stage 2 to measure
Wi-Fi performance throughput—in stage 2 there is no human movement between a pair
of laptops.Electronics 2021, 10, 856 15 of 26
Scenario 1—No Human Obstruction
Scenario 1 (stage 2) consists of no human movement between the pair of nodes. The
experiments are conducted in a controlled environment where there is no interference from
any objects between the sender and receiver when data are being transmitted. The data
collated provide a solid base for analysis and comparison with other scenarios that will be
used in the case study.
Scenario 2—Fixed Human Obstruction
Scenario 2 (stage 3) is based on fixed human movement between the pair of nodes.
In this experiment, two humans are used in the test trials; both humans are positioned
to face towards one another as the start point. As the transmission begins, both humans
will be walking towards each other, ending up on the opposite side, and once they reach
the opposite side the humans will walk back to their original position from the start
of transmission, completing one cycle. The cycle continues until the data transmission
is completed.
Scenario 3—Random Human Obstruction
Scenario 3 (stage 4) is very similar to scenario 2, where instead of having fixed human
movement there will be random human movement between the pair of nodes. Random
human movement is where objects (human) move in various directions in the area of the
experimental environment. The random movement will be in between the pair of laptops
when data are being transmitted from sender to receiver. Figure 4 shows a logical view of
all three scenarios.
Figure 4. Link throughput measurements—experiment scenarios. (a) Scenario 1 (no-human); (b) Scenario 2 (fixed human);
(c) Scenario 3 (random human).
4.2. Measurement Validation and Accuracy
The correct result interpretation depends on the knowledge of the measurement meth-
ods. The accuracy of the propagation measurement results was improved by addressing
the following issues.
Co-channel interference: As the experiments were being conducted in the Auckland
City (with a dense population), many Wi-Fi routers were being detected during the propa-
gation measurements. To avoid co-channel interference on system performance, the access
point (AP) was set to a different channel before experiments were conducted and remained
the same to ensure result accuracy.
Validation: The propagation measurements were conducted three times per scenario
to ensure the correctness of measurements and results [5,34]. The throughput was measured
using a stopwatch, which was adopted by past research papers and used to calculate data
transfer time between the pair of laptops.
People’s movement: The measurements were conducted after hours/weekends to
ensure the consistency of human movement during the experiment. A constant of two
humans was used to identify any significant impact on Wi-Fi throughput. Additionally,
the distance between the two experimental laptops (Sender and Receiver) was kept at 1 mElectronics 2021, 10, 856 16 of 26
throughout the experimental trials to avoid the impact of distance of separation between
Tx and Rx on system performance.
System configuration: To ensure there was no effect of system configuration on Wi-Fi
performance, identical wireless adapters were used between the pair of laptops. Firewall
and anti-virus were also disabled to ensure no packets were impacted by security settings.
5. Results and Discussions
In the investigation, we only focused on the impact of human movement on Wi-Fi link
throughput performance by keeping all other variables/parameters constant, including
the distance of separation between Sender (Tx) and Receiver (Rx), system configuration,
Tx power, channel access protocols, the number of people in the experimental room, and
co-channel interference. In fact, we kept a Tx–Rx separation of 1 meter for strong signal
strengths throughout the field trial measurements. For instance, if we keep changing the
distance (Tx–Rx separation), then it is hard to obtain unbiased Wi-Fi link throughput results
(i.e., the distance will influence Wi-Fi performance on the top of people’s movement).
In the investigation, we consider a simple ad hoc network setting consisting of two
nodes (Tx and Rx) with a distance separation of about 1 meter. This setting/configuration
is appropriate for our experimental trials, ensuring that other factors are not influencing the
results. A couple of people stand/move around in front of Tx to block the transmitted signal
during the trials. We then observe the impact of human blockage on system performance.
The question may arise about the impact of the number of people moving in the room. We
performed field trial experiments with varying numbers of people, ranging from one to
four, and found that the impact of the number of people moving on system performance
is insignificant.
Another observation is that we consider two scenarios of people’s movement in front
of Tx. One is fixed movement (just standing to block the Tx signal) and the other one is
just random movement (no specific pattern and paths). This random movement is a more
practical situation where people may be walking/passing by in the office block.
All the preliminary trials ran successfully except for the library environment, where
experiments could not be conducted properly and where the ad hoc network faced a lot
of interference due to many surrounding networks. This results in long delays in packet
transmission, high packet losses and poor network connectivity.
5.1. Suburban Residential House
Lounge: Laptops are placed approximately two meters away from the door in the
lounge. These are the points where the signal strength is high, as identified by the software.
During the trials, there were no packet drops and network losses, which identified a good
connection between the laptops.
Results collected from the experiments in the lounge environment showed that there
is little impact on throughput when human movement is made between the pair of laptops.
The average throughput rate where there was no human obstruction was 2.8 Mbps, and
the received signal strength was at an average of −37 dBm (thus identifying strongly
for a wireless network). Trial 3 showed throughput drops where there was no human
obstruction, which could be due to the radio signal refracting of objects, causing a slight
delay in transmission.
The average throughput for the fixed human movement was calculated at 2.22 Mbps
compared to that of random human movement at an average of 2.15 Mbps. From the collected
data, we identified that random human movement does cause slower throughput, which
could be caused by the refraction or diffracting of radio waves against the human body, but
this does not pose a great deal in network performance loss in a real-world scenario.
Overall, the data collected from the experiments in the lounge environment did show a
drop in performance when there was human movement between a pair of nodes compared
to no human movement, and this would be caused by radio waves being affected byElectronics 2021, 10, 856 17 of 26
diffraction, reflection, or absorption through the human body, but it did not cause a great
impact on Wi-Fi throughput.
Bedroom: The impact of Wi-Fi throughput performance shows very little change in
the performances in all three scenarios. The pair of laptops was placed between the bed
and the entrance door due to the recorded signal strength.
By examining the collected data in Figure 5b, it shows that the overall average through-
put was in the range of 2.5 Mbps. The signal strength recorded from the software inSSIDer
had a range between −36 dBm and −38 dBm, which identifies strong signal strength
coverage, and due to the signal strength being very strong, there were no packet drops in
transmission or network loss during all three scenarios.
Figure 5. Performance results for suburban residential home. (a) Lounge performance result; (b) Bedroom performance
result; (c) Garage performance result.
Overall, considering that the performance showed very little significant impact when
there was human obstruction, we see that random human movement still tends to cause
slightly longer data transmission between a pair of nodes.Electronics 2021, 10, 856 18 of 26
Garage: Wi-Fi link throughput showed near-identical throughput performances where
data transfer rates between a pair of nodes averaged 2.3 Mbps. Figure 5c shows the collected
data output for all three trials.
Overall, by experimenting in the garage environment, there was no great change in
Wi-Fi throughput, and we noticed that the throughput is slightly slower compared to the
bedroom and lounge environments.
In each trial, we set up two experimental laptops with a separation of about 1 meter
so that we could obtain a strong signal strength during experimental trials. By keeping a
Tx–Rx distance of 1 meter, we avoided the impact of distance on system performance.
For the case of a fixed human scenario (Scenario 2), a couple of people stand at the
middle position of the two laptops (about 0.5 m away from Tx). For the case of random
human movement (Scenario 3), two people walk back and forth at the middle position
of the two laptops. We observe that the impact of people’s movement on Wi-Fi link
throughput performance is minimal.
In summary, we conducted three trials, which resulted in similar Wi-Fi throughput
and had an overall average throughput rate of 2.09 Mbps. There was no significant impact
on performance when comparing no human, fixed and random human movement, but
what was noticeable is that when there was random human movement standing next to
the omni-directional wireless adapter, the data being transmitted had a slight degradation
in performance, which dropped to approximately 0.5 Mbps, and when the human moved
out from the blockage of the antenna, the transmission speed went back to normal speeds.
From this occurrence, we can identify that the radio waves have slightly absorbed or
refracted off the human body, thus slowing speed at a small rate.
5.2. Laboratory Environment
WT402 Laboratory: Room WT402 consisted of Wi-Fi throughput results which are
very close and had very little impact on the overall performance. Figure 6a illustrates the
result of WT402 collected data.
Running experiments in the WT402 laboratory showed a close throughput result in all
trials conducted. The placement of the pair of laptops where located near the back wall as
the software inSSIDer showed the highest average point in signal strength. When roaming
around with the laptops to identify the best position to place the pair of laptops showed an
average of −64 dBm to −76 dBm signal. Figure 6a shows all three trials that have been
conducted consist of similar Wi-Fi throughput and had an overall average throughput rate
of 2.09 Mbps. There was no significant impact in performance when comparing no human,
fixed and random human movement, but what was noticeable is when there is random
human movement standing next to the omnidirectional wireless adapter, the data being
transmitted had a slight degradation in performance which dropped to an approximately
5 Mbps, and when the human moved out from the blockage of the antenna the transmission
speed went back to normal speeds. From this occurrence, we can identify that the radio
waves have slightly absorbed or refracted from the human body, this slowing speed at a
small rate.
WT406 Laboratory: Experiments conducted in room WT406 laboratory showed a
small variation in throughput performance, which produced little difference in Wi-Fi
throughput. An interesting finding that one can observe in Figure 6b is that random human
movement had the highest throughput performance.
Overall, the results show a large variation in performance as there might be a possibil-
ity that experiments conducted in a laboratory may vastly differ in throughput.
WT306 Laboratory: The data collected when experimenting in the laboratory showed
results that consisted of a slight significant impact. Figure 6c illustrates the variation in
performance, where fixed human movement showed the lowest rate of throughput. The
recorded signal strength was at an average of −65 dBm to −74 dBm, which produced a
good connection. Even though the results conducted showed variation in performance forElectronics 2021, 10, 856 19 of 26
one scenario, the signal strength remained strong, with no network loss during transmission
and packet losses.
Overall, one can observe the performance of Wi-Fi throughput as averagely good,
where only one scenario showed a very bad data transfer rate, which could be due to
external radio interference.
Figure 6. Performance results for the laboratory environment. (a) Lab WT402; (b) Lab WT406; (c) Lab WT306.
5.3. Lunchroom
WT014 Lunchroom: The experiment conducted in room WT014 is located on the
bottom floor near the faculty of Design and Creative Technology, where we saw little
impact on Wi-Fi throughput in all three scenarios.
The signal strength was slightly different compared to the laboratory environment,
even though all the rooms are located in the same building. The RSSI averaged between
−60 dBm and −65 dBm and we did not see any drop in packets or network connectivity.
From the data collected, the highest average throughput recorded was where there
was no human obstruction and random human movement at an average of 2.38 Mbps.
The performance was very much the same, where human movement did not cause a
great deal of significant impact. Comparing results with no human and random human
movement, we see that fixed human movement had an average of 2.37 Mbps, which
showed little change but not enough to make a differential conclusion. Even though thereElectronics 2021, 10, 856 20 of 26
was human interference, it seems to pose no significant contribution to the outcome, where
the difference in both scenarios is 0.01 Mbps. Overall, we observe that there is no significant
outcome using Wi-Fi link throughput.
WT523 Lunchroom was the largest room compared to all three rooms where the
experiments have been conducted. Before running the experiments during the preliminary
trials, we noticed that in some areas there was bad connectivity when trying to set up the ad
hoc network—this resulted in black spots, packet loss, and long delays, causing time-outs
to occur. When placing the pair of laptops near the kitchen bench, we noticed a strong
connection with no packet loss and high throughput time. Figure 7 illustrates no human
interference where this is the benchmark for throughput performance to see if there is a
great deal of significant impact. The scenario with no human obstruction had an average
throughput result of 2.37 Mbps. The signal strength was strong where there were no packet
delay and packet loss during the transmission of data. The average RSSI recorded was
constant at −76 dBm when conducting experiments in the WT523 lunchroom.
Figure 7. Performance results for the lunchroom environment. (a) Lunchroom WT014; (b) Lunchroom WT523; (c) Lunch-
room WT401.
By investigating both fixed and random human movement scenarios, we have iden-
tified that the average performance showed higher throughput with random human
movement at 2.22 Mbps compared to fixed human obstruction at 2.12 Mbps. As the perfor-
mance difference between the two scenarios is 0.10 Mbps, it did not pose a great deal of
significant impact on the overall data transfer rate. Considering the room was the largestElectronics 2021, 10, 856 21 of 26
out of all the lunchrooms, the experiments produced a good throughput rate, which was
interesting as we thought it would take a considerable amount of time for radio waves to
receive a signal from the sender node due to the large area coverage.
Another interesting factor is the internal radiofrequency such as microwave, where it
did not cause a great deal of impact on the data transfer rate between the pair of nodes.
Overall, from the data collected there was no great deal of significant impact on Wi-Fi
throughput performance, where random and fixed human movement showed a very close
result in a larger room.
WT401 Lunchroom was the smallest room for experiments conducted in all exper-
imental environments where the results are shown in Figure 7, illustrating that Wi-Fi
throughput performance is very close. The benchmark (no human movement) throughput
consisted of an average of 2.55 Mbps.
When experimenting in WT401 lunchroom, the signal strength was strong and we
noticed that during data transmission between the pair of nodes there was no time out
when packets were being sent. The average signal strength recorded was between −64 and
−76 dBm. Comparing the performance between fixed and random human movement, there
was very little difference. Fixed human obstruction showed a throughput rate of 2.38 Mbps
compared to random human movement at 2.35 Mbps. Considering this, showing a higher
throughput rate compared to the other room could be since this room is the smallest and is
very dense, causing radio waves to reflect off walls slightly faster than in a larger room.
Overall, the results show very little impact when there is fixed and random human
movement, which shows that in a real-world environment the impact of people’s movement
021, 10, x FOR PEER REVIEW does not pose a great change in network performance. 22 of 26
5.4. Office Environment
WT211 Office room was the smaller room out of the office block environment, and
Overall, the results
this show an interesting
room consisted resultwith
of a lot of clutter as we seenumber
a vast for the of
first time when
textbooks, there
shelves for book
is a human obstruction thattechnological
storage, and the throughput is slightly
equipment. Fromhigher thancollected
the data no human movement,
during the experiment,
but it does not we produced
pose an illustration
a great deal of impacttoinidentify if there
a real-life Wi-Fiis network
a significant impact on performance.
environment.
Figure 8a shows the throughput performance difference in both scenarios.
(a)
(b)
Figure 8. Performance
Figure results
8. Performance resultsfor
forthe
theoffice
office environment. (a)Office
environment. (a) Office WT211;
WT211; (b) (b) Office
Office WT210.
WT210.
WT210 Office room showed an outcome where random human movement consisted
of higher throughput compared to no human and fixed human movement (where they
both had near the same throughput). Figure 8b shows a graphical representation of the
data collected when the experiments were conducted.Electronics 2021, 10, 856 22 of 26
There is very little impact on human interference when there is fixed and random
human movement. The average data transfer rate for no human obstruction is 2.31 Mbps,
where when there are fixed human obstructions for the first time out of all scenarios the
throughput is higher at 2.36 Mbps. Even though the performance difference is very small,
there could be some attributes that could have affected the transfer rate to be slightly faster.
Factors that could have contributed to a slight increase in throughput could be due to
the omnidirectional antenna, where the radio waves bouncing off some objects traveled
slightly faster for the receiver to receive the data.
The random human movement showed an overall throughput of 2.16 Mbps, which
is slower than both scenarios (fixed and random human movement), which was to be
expected. The last trial had a slight drop in performance as a human object remained near
the omnidirectional antenna, which reduced the speed of data transmission.
Overall, the results show an interesting result as we see for the first time when there is
a human obstruction that the throughput is slightly higher than no human movement, but
it does not pose a great deal of impact in a real-life Wi-Fi network environment.
WT210 Office room showed an outcome where random human movement consisted
of higher throughput compared to no human and fixed human movement (where they
both had near the same throughput). Figure 8b shows a graphical representation of the
data collected when the experiments were conducted.
When the experiments were conducted, the received signal strength was good at an
average of −70 dBm to −78 dBm. There were no losses in packet transmission when data
were sent from one node to another, which provided strong network coverage.
The average throughput result for no human obstruction was 2.01 Mbps, and fixed
human interference consisted of a throughput of 2.04 Mbps, which is slightly slower but did
not create a large difference in performance. When there was random human movement
there was an increase in throughput rate, which resulted in an average of 2.39 Mbps. This
increase in performance could be due to radio waves refracting from a random human
movement, which could have possibly resulted in a faster data transfer rate.
Overall, the performance showed an interesting result where random human move-
ment showed higher throughput performance compared to fixed and no human movement,
but again, this provided no significant impact in a real-life environment.
5.5. Cross Comparison and Discussion
To evaluate the overall impact of human movement on Wi-Fi link throughput perfor-
mance, cross-comparison is used to analyze any significant performance issues in such
network scenarios. Table 4 shows summary results for 11 selected scenarios under four
radio propagation environments (Residential Home, Office Block, Lunchrooms, and Labo-
ratories). The offices, lunchrooms, and laboratories are located in a multi-story building of
Auckland University of Technology (AUT)’s WT tower building. Column 1 lists 11 selected
scenarios (Lounge, Bedroom, and Garage in Residential Home; WT211 and WT210 are
Offices; WT014, WT523 and WT401 are Lunchrooms; and WT306, WT402, and WT406 are
Laboratories). Column 2 shows Wi-Fi throughput (measured in Mbps) without human
obstruction, which is used as a reference point to compare results for fixed and random hu-
man movement. The link throughputs for fixed human obstruction and the corresponding
throughput degradation are shown in Columns 3 and 4, respectively. Likewise, the link
throughputs for random human obstruction and the corresponding throughput degrada-
tions are shown in Columns 5 and 6, respectively. The right most column (Column 7) shows
the difference in the throughput degradation of fixed and random human obstruction.Electronics 2021, 10, 856 23 of 26
Table 4. Comparison of Wi-Fi link throughput degradation.
With Human Obstruction Difference in
Throughput Throughput
without Human Fixed Human Random Human
Scenario Degradation
Obstruction Throughput Degradation Throughput Degradation of Fixed and Random
(Mbps) (Mbps) (%) (Mbps) (%) Obstruction (%)
Residential Home
Lounge 2.8 2.22 20.7 2.23 20.4 0.3
Bedroom 2.65 2.38 10.2 2.32 12.5 2.3
Garage 2.32 2.12 8.6 2.09 9.9 1.3
Average 2.6 2.2 13.2 2.2 14.2 1.3
Offices
WT211 2.5 2.36 5.60 2.30 8.00 2.40
WT210 2.3 2.14 6.96 2.10 8.70 1.74
Average 2.4 2.2 6.3 2.2 8.3 2.1
Lunchrooms
WT014 2.38 2.37 0.42 2.38 0.00 0.42
WT523 2.27 2.12 10.55 2.22 6.33 4.22
WT401 2.55 2.38 6.67 2.35 7.84 1.18
Average 2.4 2.3 5.9 2.3 4.7 1.9
Laboratories
WT306 2.15 2.05 4.65 2.07 3.7 0.93
WT402 2.22 2.14 3.6 2.10 5.4 1.80
WT406 2.11 2.08 1.4 1.99 5.7 4.27
Average 2.2 2.1 3.2 2.1 4.9 2.3
The “throughput degradation” (measured in %) is defined as the ratio of the dif-
ference between the individual link throughput and the reference throughput to the
reference throughput. It indicates the variation in link throughput with respect to the
reference throughput.
By looking at the throughputs in the case of no human obstruction, we observe that
the maximum throughput achieved is 2.8 Mbps in the lounge followed by the bedroom
(2.65 Mbps). The throughputs for the remaining nine scenarios/environments (Garage,
Offices WT211 and WT210, Lunchrooms WT014, WT523, and WT401, and Laboratories
WT306, WT402, and WT406) are slightly lower than the throughputs obtained both in the
lounge and bedroom. This is mainly due to the nature of the propagation environments
where measurements were carried out. For example, in the garage there was a car and
other metal objects including the garage door when measurements were taken, resulting in
lower throughput than the lounge and bedroom. Similarly, freezers and microwaves in
the lunchrooms, PCs and desks in the laboratories, and bookshelves containing books and
other objects in the offices contributed to lower throughputs.
Let us focus on the effect of fixed human obstruction on system performance. Compar-
ing the results in a residential home environment, the throughput degradation is 13.2% on
average. In the case of the office environment, we found that the throughput degradation
is 6.3%, which is slightly lower, but it resulted in no great deal of significant impact on
system performance. However, the average throughput degradation for lunchroom and
laboratory environments was found to be 5.9% and 3.2%, respectively. Although Wi-Fi link
throughput slightly varies in different environments (offices, lunchrooms, and labs), overall,
the impact of fixed human obstructions on system performance is not very significant.
We now consider the effect of random human obstruction on system performance. We
observe that in a residential home environment, the throughput is slightly lower than no
human obstruction in all rooms where the field trial measurements have been conducted.
The throughput degradation (on average) for the residential home, offices, lunchrooms,Electronics 2021, 10, 856 24 of 26
and laboratories is 14.2%, 8.3%, 4.7%, and 4.9%, respectively. Even though the throughput
degradation is small, we still see Wi-Fi throughput being affected due to human obstruction.
By looking at Column 7, one can observe that the difference in the throughput degra-
dation of fixed and random human obstruction ranges from 1.3% to 2.3%, which is in-
significant. Overall, several interesting points have been analyzed from the findings made
through this research. This paper provides discussion and analyses from the data collected
through extensive empirical study. The conclusion and future research directions are
discussed next.
6. Concluding Remarks
The impact of people’s movement on Wi-Fi link throughput performance using radio
propagation measurements was investigated. Field trial measurements, data collection,
and analysis were carried out to make a meaningful conclusion. All empirical results
were validated and tested for three different scenarios (no human, fixed, and random
human movement). Preliminary measurements were conducted to find out whether data
transmission between two nodes in a wireless environment is successful. Preliminary
results show that in an ad hoc network, signal coverage in all measurements was good
except for the AUT library, where transmission failed due to high interference within the
coverage area.
Once the preliminary trials and measurements were completed, Wi-Fi link throughput
performance was conducted in obstructed office block, laboratory, library, and suburban
residential home environments. Our main findings are summarized below. (1) Random
and fixed human movement do not pose a greatly significant difference in Wi-Fi through-
put compared to no human movement in the environments where the experiments were
conducted. In fact, the performance difference between fixed and random human move-
ment is about ±0.07 Mbps on average, which is insignificant, and (2) in the AUT library
environment, it can be difficult to obtain good Wi-Fi throughputs due to external radio
interferences. These interferences are mainly caused by wireless devices sharing the same
frequency and the surrounding materials the library is made of, which reduced signal
strength and loss in network connectivity. The results reported in this paper provide some
insights into the effect of people’s movement on Wi-Fi link throughput performance, which
can help network engineers and planners to deploy wireless networks at residential homes,
apartments and commercial buildings.
As we have investigated human movement’s effect on Wi-Fi link throughput using
propagation measurements, the exploration of a similar study is still required as there are
a considerable number of factors that can affect Wi-Fi throughput. An investigation of
human movement’s effect on Wi-Fi link throughput at the 2.4 GHz and 5 GHz spectrum is
suggested as future work.
Author Contributions: We are writing to confirm with you that the work presented in this paper
is an original contribution. N.IS. conceived of the presented idea. O.M. did the work and N.IS.
supervised the findings of this work. S.G. drafted the manuscript with support from N.IS. Both
O.M. and N.IS. designed the methodology and validated results. O.M. worked out the technical
details, conduct experiments with support from N.IS. N.IS. carried out the analysis of findings. O.M.
collected the data and N.IS. contributed to sample preparation. N.IS. and O.M. analysed the data. S.G.
worked on literature review with support from N.IS. N.IS. edited the draft, prepared and submitted
the final manuscript. N.IS. was correspondence author; dealt with all the reviewer comments and
prepared the response document for editors. The paper went through three round review process and
N.IS. responded to these reviews. N.IS. processed the management and coordination responsibility
for the research activity planning and execution. All authors have read and agreed to the published
version of the manuscript.
Funding: This research received no external funding
Conflicts of Interest: The authors declare no conflict of interestYou can also read