IBM Data Modeling Guide - IBM Cognos Analytics Version 11.1
←
→
Page content transcription
If your browser does not render page correctly, please read the page content below

IBM Cognos Analytics
Version 11.1

Data Modeling Guide

IBM
©

Product Information
This document applies to IBM Cognos Analytics version 11.1.0 and may also apply to subsequent releases.
Copyright
Licensed Materials - Property of IBM
© Copyright IBM Corp. 2015, 2020.

US Government Users Restricted Rights – Use, duplication or disclosure restricted by GSA ADP Schedule Contract with
IBM Corp.
IBM, the IBM logo and ibm.com are trademarks or registered trademarks of International Business Machines Corp.,
registered in many jurisdictions worldwide. Other product and service names might be trademarks of IBM or other
companies. A current list of IBM trademarks is available on the Web at " Copyright and trademark information " at
www.ibm.com/legal/copytrade.shtml.
© Copyright International Business Machines Corporation 2015, 2020.
US Government Users Restricted Rights – Use, duplication or disclosure restricted by GSA ADP Schedule Contract with
IBM Corp.
Contents

  Chapter 1. Data modeling in Cognos Analytics........................................................ 1
     Modeling user interface .............................................................................................................................. 2
       Customizing the user interface.............................................................................................................. 4

  Chapter 2. Data modules and their sources............................................................ 5
     Data module sources................................................................................................................................... 5
        Data servers............................................................................................................................................ 5
        Packages................................................................................................................................................. 5
        Uploaded files.........................................................................................................................................5
        Data sets................................................................................................................................................. 6
        Data modules..........................................................................................................................................6
     Creating a data module................................................................................................................................6
     Discovering related tables........................................................................................................................... 8
     Adding sources or tables to a data module.................................................................................................9
     Updating columns in a data module..........................................................................................................10
     Reloading the schema metadata...............................................................................................................11
     Relinking sources.......................................................................................................................................11
     Enriching packages.................................................................................................................................... 12
     Setting up data caching............................................................................................................................. 15
     Securing data............................................................................................................................................. 16

  Chapter 3. Modeling metadata ............................................................................ 19
     Relationships............................................................................................................................................. 19
         Creating a relationship from scratch................................................................................................... 19
         Join operators.......................................................................................................................................20
         Join optimization.................................................................................................................................. 21
     Custom tables............................................................................................................................................ 21
         Creating custom tables........................................................................................................................ 23
     Creating tables using SQL ......................................................................................................................... 25
     Column dependencies............................................................................................................................... 26
         Defining column dependencies........................................................................................................... 29
         Configuring column dependencies...................................................................................................... 31
     Calculations................................................................................................................................................33
         Creating basic calculations.................................................................................................................. 34
         Creating custom calculations...............................................................................................................35
     Filters......................................................................................................................................................... 36
         Creating embedded filters................................................................................................................... 36
         Creating selectable filters.................................................................................................................... 37
     Hiding items .............................................................................................................................................. 38
     Creating data groups..................................................................................................................................38
     Cleaning data............................................................................................................................................. 40
     Creating navigation paths.......................................................................................................................... 41
     Formatting data..........................................................................................................................................42
     SQL in Cognos Analytics............................................................................................................................ 43
         Supported SQL types ...........................................................................................................................43
         Showing the query information............................................................................................................44
         Generating the query SQL ................................................................................................................... 44
     Validating data modules............................................................................................................................ 45
     Object properties....................................................................................................................................... 45

                                                                                                                                                                    iii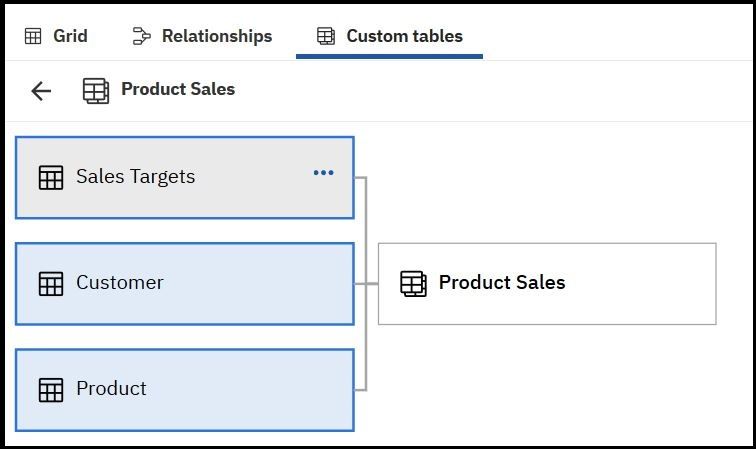
Chapter 4. Members in the data tree.................................................................... 49
        Searching for members............................................................................................................................. 51
        Setting the members display limits...........................................................................................................51
        Displaying relational members..................................................................................................................52

     Chapter 5. Relative date analysis......................................................................... 55
        Sample calendars ..................................................................................................................................... 55
           Creating a custom retail calendar ....................................................................................................... 57
        Creating a data module for relative date analysis.................................................................................... 59
        Creating relative date filters ..................................................................................................................... 61
           Creating filter expressions................................................................................................................... 62
           Expression variables ............................................................................................................................64
           Example filter: Last 12 months............................................................................................................ 65
           Example filter: Next 4 months............................................................................................................. 66
           Other examples of relative date filters ............................................................................................... 68
        Customizing the reference date ............................................................................................................... 70
           Setting the _as_of_date global parameter..........................................................................................70

     Appendix A. Supported SQL data types................................................................ 73

     Appendix B. Features not supported by data modules...........................................75

     Index.................................................................................................................. 79

iv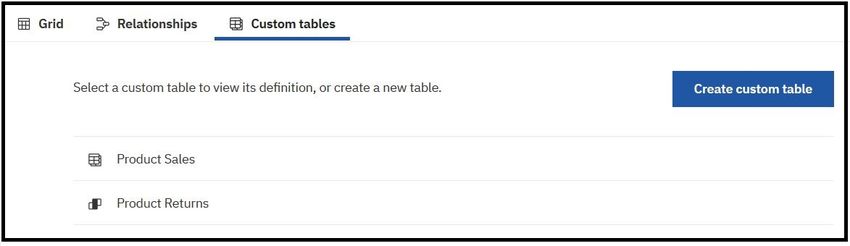
Chapter 1. Data modeling in Cognos Analytics
      IBM® Cognos® Analytics provides web-based, self-service data modeling capabilities.
      You can use data modeling in Cognos Analytics to fuse together many sources of data, including relational
      databases, Hadoop-based technologies, Microsoft Excel spreadsheets, text files, and so on. Using these
      sources, a data module      is created that can then be used in reports, dashboards, or explorations.
      Star schemas are the ideal database structure for data modules, but transactional schemas are equally
      supported.
      You can enhance a data module by creating calculations, defining filters and navigation paths, and more.
      After you save a data module, other users can access it. Save the data module in a folder that users,
      groups, and roles have appropriate permissions to access. This process is the same as saving a report or
      dashboard.
      Tip: Data modeling in Cognos Analytics does not replace IBM Cognos Framework Manager, IBM Cognos
      Cube Designer, or IBM Cognos Transformer, which remain available for maintaining upgraded projects.

      Intent modeling
      You can use intent modeling to create a data module. Intent modeling proposes tables to include in the
      module, based on matches between the terms that you supply and metadata in the underlying sources.
      Intent modeling recognizes the difference between fact tables and dimension tables by the number of
      rows, data types, and distribution of values within columns. When possible, the intent modeling proposal
      is a star or snowflake of tables. If an appropriate star or snowflake cannot be determined, a single table or
      a collection of tables is proposed.
      For more information, see “Discovering related tables” on page 8.

      Automatic joins
      Cognos Analytics automatically creates joins between tables in a data module. The autojoin (automatic
      join) algorithm adopts a diagnostic scoring approach when deciding which columns to use to join two
      tables. The algorithm uses a set of rules that are applied when choosing the column combinations
      between the two tables. Each rule produces a score. The score could be negative. The total score of all
      rules decides if a column combination qualifies to be a join column.
      The autojoin algorithm uses the following rules:
      • The similarity of two column names must exceed a minimum threshold.
       For example, the names SalesCountryCode and CountryCode are highly similar, and can be
       considered a match.
      • Both columns belong to the same semantic category.
       For example, the Employee or Product category.
      • Both columns have the same semantic attribute.
       For example, both are IDs.
      • None of the columns is a common row identifier.
       The row ID column could be in every table.
      • The data in two numeric columns overlaps.
      • The relationship between two columns can't be many-to-many.
      A join relationship is created if any column combinations between two tables satisfy a minimum
      qualification score. The collected statistics is used to ensure that cardinality is properly set when building

© Copyright IBM Corp. 2015, 2020                                                                                   1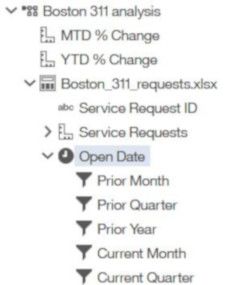
the relationship. The joins created by the autojoin algorithm are saved as the inferred relationships in the
      data module.
      For more information, see “Relationships” on page 19.

Modeling user interface
      Use the web modeling user interface to view, create, enhance, and edit data modules.
      Access to this interface is controlled by the Web-based modeling capability that is managed by
      administrators. For more information, see the Managing IBM Cognos Analytics guide.
      If some of the user interface elements that are discussed in this topic are not available to you, the user
      interface could be customized for your role. For more information, see “Customizing the user interface”
      on page 4.
      You can enter the web modeling user interface from the IBM Cognos Analytics portal in one of the
      following ways:
      • In Team content, My content, or Recent, locate an existing data module, which is an object with this
        icon    , and click it to open.

      • Click New     , and select Data module. Then, create a new data module.
      • Use the Quick launch facility in the Cognos Analytics welcome page to upload a file. Drop the file in the
        Data module box, and start creating your data module.

      When working with data modules, you can use the undo           and redo       actions in the application bar
      to revert or restore changes to the data module in the current editing session. You can undo or redo up to
      20 times.

      Sources panel

      The Sources panel        shows the sources of data that the data module contains. The sources can be data
      servers, uploaded files, data sets, packages, and other data modules.
      Except for packages, you can expand the specific source to view its tables and columns. Drag tables onto
      the data module panel or onto the diagram to add them to the data module.

      From the source context menu        , you can initiate actions such as relinking sources or enabling data
      caching.

      Data module panel
      The data module tree shows the tables and columns of data that are included in the data module. This is
      the main space for editing the data module.

      Click the context menu icon    for the module, table, or column to view its modeling and editing con
      text menu options. Here you can start joining tables, creating filters and calculations, or renaming and
      deleting items.

      Click the Add sources and tables icon       in the panel toolbar to add sources and tables to your data
      module. Clicking the Identify navigation path members icon         underlines columns that are members
      of navigation paths. If none of the columns are underlined, the data module does not contain navigation
      paths.

2 IBM Cognos Analytics Version 11.1 : Data Modeling Guide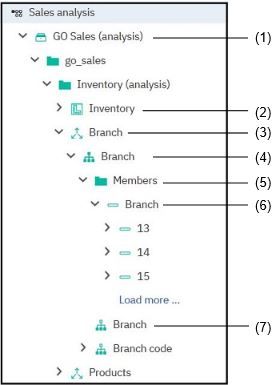
Relationships tab

This tab shows the data module relationships diagram       . The diagram is a graphical representation of
table relationships in a data module. You can use the diagram view to examine the relationships, edit the
data module, and view the cardinality information for the relationships.
Right-click a table in the diagram to view the table context menu that can be your starting point for
creating joins or filters, renaming the table, viewing the table properties, or removing it from the module.
Click any table join to see the join summary information that includes the matching keys. When you right-
click the join line, the context menu appears with options for editing or deleting the join.
Right-click one or more tables in the diagram, and click Auto-arrange. The diagram is redrawn around the
first selected table allowing you to focus on the selected tables and their relationships.
In the Diagram settings box, select the Cardinality check box to show the cardinality of relationships
between different tables in your data module. Move the Degrees of separation slider. Depending on the
slider position, the diagram shows different degrees of relationships between tables. Select one or more
tables in the diagram, and use the Focus mode to work with the selected tables.

Grid tab
You can use the grid view to examine the actual data in table columns and rows.

Select a table or column in the data module tree or in the diagram, and click the grid icon     to open the
data view.

Custom tables tab

The Custom tables tab        is the main space for creating, viewing, and managing custom tables in a data
module. This tab is displayed by default, even if the module doesn't contain any custom tables. To start
creating a new table, click Create custom table. If the data module already contains custom tables, the
table names are listed when you click the tab.
For more information, see “Custom tables” on page 21.

Validation panel

To validate the data module, click the validation icon in the application bar    or in the Data module
panel, or click Validate from the data module context menu.
If errors are discovered, the number of errors is displayed on the validation icon in the application bar
   , and the failed validation icon    is displayed for tables, columns, expressions, or joins. Click the
error icons to view the validation messages. Click the copy icon     in the error messages to copy the
messages to the clipboard for easier analysis or printing.

Expression editor
The expression editor is an SQL editing tool that you can use to create or edit SQL-based tables,
calculations, filters, or data groups.
You can create expressions by typing the code or dragging items from the data module tree. The
validation and data preview capabilities help to quickly verify and troubleshoot the expressions. The code
editing capabilities include: inserting comments, function auto-complete, pretty-print, high-contrast
mode, and different font sizes. The information panel shows details and provides examples of supported
functions that are used in the expressions.

                                                            Chapter 1. Data modeling in Cognos Analytics 3
Customizing the user interface
      Users with administrative privileges can customize the modeling user interface by disabling some parts of
      the interface for some user roles.
      Users who are members of those roles can't perform certain tasks when they view or edit data modules.
      For example, users might not be able to apply data security for data server sources or edit joins when the
      related user interface features are disabled for them.

      About this task
      This functionality is available for Cognos roles only. For more information, "Customizing roles" in the IBM
      Cognos Analytics Managing Guide.

      Procedure
      1. In the Manage administration interface, click People > Accounts.
      2. Click the Cognos namespace, and locate the role for which you want to customize the user interface.
         The role Modelers is associated with data modules, but you can also apply the customizations to other
         roles in the Cognos namespace.

      3. From the role context menu        , click Properties.
      4. On the Customization tab, click the Features chevron button        .
      5. Select the Data Module category.
         Most of the data module features that you might want to customize are grouped under Application
         Bar, Navigation Bar, and Context Menus.
         For example, go to Data Modules > Context Menus > Shaping options to customize the following
         features:
         • Set data security - ability to apply data security for data servers
         • Create relationship - ability to create relationships between tables
         • Edit relationship - ability to edit relationship joins
         • Create basic calculation and Edit basic calculation - ability to create and edit calculations without
           using the expression editor.
         • Create custom calculation and Edit custom calculation - ability to create and edit calculations by
           using the expression editor.
         • Navigation path - ability to create navigation paths
      6. To disable a feature, clear its checkbox.
      7. Click Apply to save the changes.

      Results
      All access points to the disabled feature are not available for the affected roles. For example, when you
      disable the Edit relationship feature, the join editing options are not available in the table and column
      context menus, the diagram and custom table views, and the properties panel.

4 IBM Cognos Analytics Version 11.1 : Data Modeling Guide
Chapter 2. Data modules and their sources
      Data modules are containers that describe data and rules for combining and shaping data to prepare it for
      analysis and visualization in IBM Cognos Analytics.

Data module sources
      Data modules can be based on data servers, packages, uploaded files, data sets, and other data modules.
      You can combine multiple, different types of sources into one data module.
      When you create a new data module in IBM Cognos Analytics, or update an existing module, you choose
      the input source type from the Select sources dialog box.

Data servers
      Data servers represent databases for which connections exist in Cognos Analytics.

      The data server   connections must already be created in Manage > Data server connections or
      Manage > Administration console, and the metadata for one or more schemas in the data server must be
      loaded. Only schemas where metadata was loaded can be used in data modules.
           When a data server schema is updated, you can reload the schema metadata from the data
      module. On the Sources tab, from the schema context menu, select Reload metadata.
      For the legacy JDBC data source connections, ensure that the Allow web-based modeling check box is
      selected. These connections are created in the Administration console. If the Allow web-based
      modeling check box is not selected for this type of connections, the connections are not available in
      Manage > Data server connections, and cannot be used as data module sources. Go to Manage >
      Administration console . On the Configuration tab, select Data source connections, and find the
      connection. From the connection properties, click the Connection tab where the Allow web-based
      modeling check box is located.
      If your data server is Planning Analytics, you create the TM1 cube-based data modules in the
      administration interface, as soon as the data server connection is created. For more information, see
      Creating data modules from Planning Analytics cubes in the Managing IBM Cognos Analytics guide.
      For more information, see the Managing IBM Cognos Analytics.

Packages
      You can use relational, dynamic query mode packages as sources for data modules.

      Packages       are created in IBM Cognos Framework Manager and contain dimensions, query subjects,
      query items, and other data. Packages are located in Team content or My content.
      Tip: Query subjects and query items in packages are equivalents of tables and columns in data modules.
      For more information about packages, see the IBM Cognos Analytics Getting started guide.

Uploaded files
      Uploaded files are Microsoft Excel (.xlsx and .xls) spreadsheets and text (.csv) files that contain comma-
      separated, tab-separated, semi colon-separated, or pipe-separated values.

      Files    that are already uploaded to Cognos Analytics are stored in Team content or My content. You
      can also upload files after you start creating your data module by using the upload file facility in the
      Select sources dialog box.
      For more information about uploaded files, see the IBM Cognos Analytics Getting started guide.

© Copyright IBM Corp. 2015, 2020                                                                                   5
Data sets
Data sets contain data that is extracted from packages or data modules.
Data sets are stored in Team content or My content. If the data in the source package or data module
changes, the change is reflected in the data set.
For more information about data sets, see the IBM Cognos Analytics Getting started guide.
Data modules
Existing data modules can be used as sources for other data modules.
Data modules are saved in Team content or My content.
The tables remain linked to the source data module, which is indicated by the linked table icon , and
they are read-only. As long as the tables remain linked, any changes in the source module are reflected in
the new data module. If you break the link, you can edit the tables. However, the source module changes
are no longer reflected in the new module.
Creating a data module
A user can quickly create a data module that includes data from one or more sources of different types.
The data module can be shared with other users, and used as a source to create reports, dashboards,
stories, and explorations.
Before you begin
Prepare the sources that you plan to use to create the data module.
• Save the sources to Team content or My content.
The only exception are your data files that can be uploaded while the data module is created.
• For data server sources, create connections in Manage > Data server connections.
For more information, see “Data servers” on page 5.
About this task
To access the data modeling user interface, users need execute and traverse permissions for the Web-
based modeling capability. For more information about capabilities, see the Managing IBM Cognos
Analytics guide.
Procedure
1. In the Cognos Analytics welcome page, click New > Data module.
Tip: An alternative way to start creating a data module is to upload data files first by using the Quick
launch facility. When you drop the files onto the Cognos Analytics welcome page, in the Data module
box, you can immediately start creating your data module. Other sources can be added to the data
module later.
2. In the Select sources dialog box, select one or more sources of any type.
• To select a saved data module, data set, uploaded file, or package, click the Team content , My
content , or Recently viewed content folder, and locate the source that you want to add. If
needed, use search and filtering options to find the sources.
• To select a data server, click the Data servers and schemas folder. Select the data server
connection that you want. The available schemas in the data server are listed. Choose the schema
that you want to use. Only schemas for which metadata is preloaded are displayed.
6 IBM Cognos Analytics Version 11.1 : Data Modeling Guide• To upload a data file from your hard drive or LAN location, click the Upload icon , and browse for
the file. By default, the file is saved to My content.
3. If all selected sources contain one table each, the basic data module is created, and you can proceed
to step 5.
4. If any of the selected sources, such as a multi-tab spreadsheet or a data server, contain multiple
tables, you have two options to add the tables to your data module:
• Select tables
You select the tables manually, and click OK to create the data module.
• Discover related tables
A word cloud visualization is displayed that contains keywords from sources that the data module
is based on. Select one or more keywords, and click Next. A data module proposal is generated for
you. You can accept the proposal, or click Previous to try different keywords. To accept the
suggested proposal, click OK. The data module is created for you.
For more information, see “Discovering related tables” on page 8.
The data module is created based on the chosen tables.
5. Examine the data module.
• In the Data module panel, view the sources that are included in your data module.
You can expand the sources to view their tables, columns, and members.
The link icon on tables indicates that the tables are linked to the source data module. For more
information, see “Relinking sources” on page 11.
For data server connections and uploaded files, the table and column labels are cleaned up in
English and some other languages in the following way:
– For single files, the file extension, such as .xls or .csv, is removed from the table label. For
example, Customer_analysis.csv is changed to Customer Analysis.
– Characters such as underscore (_), dash (-), or slash (\) are replaced with the space character.
For example, Vehicle_class is changed to Vehicle Class.
– In column labels, all words are capitalized. For example, Vehicle class is changed to
Vehicle Class.
– Camel case strings are split into individual words. For example, OrderDate or orderDate is
changed to Order Date.
– Extra spaces are removed.
• To view data, select a table or a column in a table, and click the data grid view .
• To view relationships between tables, click the Relationships tab . Typically, the relationships
are detected by the system and joins between tables are created automatically. If the tables are
not joined, you need to join them manually. For more information, see “Creating a relationship from
scratch” on page 19.
• The data module is validated automatically. If there are any broken references, the failed validation
icon is displayed in the data module tree and in the diagram. For more information, see
“Validating data modules” on page 45.
6. To create a test report from your data module, click Try it in the application toolbar.
A new tab opens in your browser with IBM Cognos Analytics - Reporting open within it. Your data
module is shown in the Insertable objects pane.
7. To save the data module, click Save or Save as.
Chapter 2. Data modules and their sources 7Results
The data module is created in the location that you saved it to, in Team content or My content
.
What to do next
You can enhance the data module by adding calculations, filters, groups, custom tables, and more. For
more information, see Chapter 3, “Modeling metadata ,” on page 19.
Discovering related tables
You can engage the system to suggest the most appropriate tables for your data module. Using natural
language processing and AI-based functionality, the system generates a data module that best
represents your use case.
This functionality is used when creating a data module or adding new sources or tables to a data module.
The choice of tables for the data module is based on keywords that you select. An interactive word cloud
visualization shows the keywords that exist in the available sources.
The following example shows a word cloud for a data module proposal that is based on four sources:
The font colors represent the different sources. The font size indicates the keyword weight, which is the
measure of the keyword importance in the source. Selecting keywords with higher weight increases the
probability of creating the most relevant data module for your use case.
To increase or decrease the number of keywords in the word cloud, expand the Keywords section in the
right pane, and enter a number for the Keywords limit option.
You can select the keywords from the word cloud, or type them in the search bar. The selected keywords
are automatically added to the search bar. To deselect the keywords, delete them from the search bar.
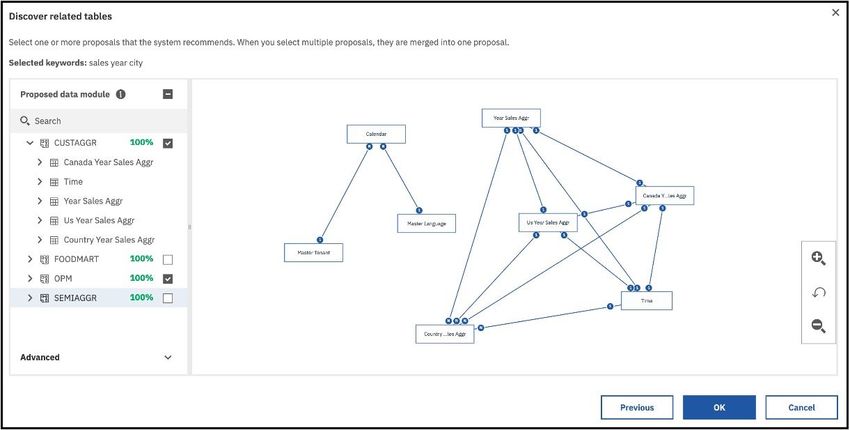
After you click Next, a data module proposal is generated, as shown in the following example:
8 IBM Cognos Analytics Version 11.1 : Data Modeling GuideThe Proposed data module pane shows the tables that the system suggests to use for the data module.
By default, one proposal is generated for each source. A percentage confidence score is assigned to each
proposal. The confidence score reflects the predicted ability of the proposal to fulfill your modeling
objective.
Select one or more of the suggested proposals. The selected proposals are merged into one proposal, and
table relationships are generated.
Note: To increase the number of proposals per source, expand the Advanced section in the Proposed
data module pane, and increase the number.
Click OK to accept the proposal, or click Previous and try to generate different proposals.
Adding sources or tables to a data module
After a data module is created, you can add new sources or different tables from the sources that are
already in the data module.
About this task
You can add a combination of source types in a data module.
Procedure
1. Open an existing data module.
2. In the Data module panel, click the Add sources and tables icon .
3. Select one of the following options:
• Add new sources
Select and add new sources to the data module.
• Add more tables
Add tables from sources that are already in the data module. Only tables that aren’t already
included in the data module can be selected.
• Discover related tables
Add tables from sources that are already in the data module. This option is available only for
sources that contain multiple tables, such as data servers and multi-sheet uploaded files. Based on
Chapter 2. Data modules and their sources 9keywords that you select, related tables are suggested to be added to the data module. For more
information, see “Discovering related tables” on page 8.
4. Save the data module.
Updating columns in a data module
After a table in a data module source is updated, you can add or remove individual columns in the data
module without updating the whole table.
This functionality can be used for the following scenarios:
• A source column was deleted from a data module table, the data module was modified and saved, and
the modeler wants to re-add the deleted column to the data module.
• A new column was added to an existing table in a database, and the modeler wants to use this column
in the data module.
• A column was removed or renamed in a database, and the modeler must update the data module to
avoid validation errors.
About this task
For data modules that are based on data servers, use the Reload metadata function to reload the latest
schema metadata from the database. For more information, see “Reloading the schema metadata” on
page 11.
Procedure
1. Open the data module that you want to update.
2. Click the Source view icon to open the Sources panel, and expand the source tree.
3. If the source is a database server schema, from the schema context menu, click Reload metadata.
The tables and columns are reloaded based on the latest state of the data server.
4. In the Sources panel toolbar, click the Source tree settings icon , and select the Show unused items
check box.
• The columns (and their tables) that are not in the data module are highlighted in the Sources panel.
• If the source contains renamed columns, or columns were removed from the source, validation error
icons appear next to the affected columns in the Data module panel.
5. In the Sources panel, identify the column that you need to add to the data module, and drag the
column to the related table in the Data module panel. Expand the table if you want to drop the column
into a specific place in the table.
You can drag multiple columns from the same table at once.
6. If the data module contains validation errors, the columns in the module might be missing or renamed
in the source. Use the following steps to resolve the errors:
a) Drag the renamed columns to the Data module panel.
b) Remove the columns that no longer exist in the source from the data module.
c) Validate the data module.
Potential validation errors might be related to the broken references in expressions, such as filters
or calculations, that might still refer to the removed columns. Using information in the error
messages, manually update these expressions.
7. Save the data module.
10 IBM Cognos Analytics Version 11.1 : Data Modeling GuideReloading the schema metadata
When a database schema is updated, the schema must be reloaded for the data module to remain
synchronized with the database.
To create a data module that is based on a data server source, the database schema metadata must be
loaded and saved to the content store. This task is performed by administrators in the administration
component after the data server connection is created. For more information, see "Loading metadata" in
the IBM Cognos Analytics Managing guide.
For existing data modules, the modeler can reload the schema metadata after the schema is updated.
This step might be needed when you encounter validation errors in the data module.
Procedure
1. Open the data module that is based on a data server source.
2. Click the Source view icon to open the Sources panel.
3. From the schema context menu, click Reload metadata.
Results
The tables and columns are reloaded based on the latest state of the data server. If the source contains
renamed items, or items were removed from the source, validation error icons appear next to the
affected columns in the Data module panel.
What to do next
To compare the data in the schema and the data module, in the Sources panel toolbar, click the Source
tree settings icon, and select the Show unused items check box. The tables and columns that are not in
the data module are highlighted in the Sources panel. You can proceed to update the columns in the data
module.
Relinking sources
You can relink a data module source to a different source. After a successful relink, global calculations
and relationships in the data module remain valid.
Here are some scenarios in which relinking a source can be useful:
• You build and test a data module against a test source. When the data module is ready, you relink the
source to the intended production source.
• The current source in your data module is invalid, and you must use a new, valid source.
• You want to relink your data module from one data server to another data server, or from one schema to
another schema.
Relink between different types of data servers is supported, as well as between schemas and catalogs
within data servers.
Tip: Data server sources can be organized into schemas, catalogs, both, or none.
About this task
The relinked (target) source must be of the same type as the original source. A data server can be relinked
only to a data server, an uploaded file to an uploaded file, and so on.
In addition to the matching source types, the following conditions must be met:
• All columns from the original source must exist in the target source, and the columns Identifier
properties (case-sensitive) and data types must match.
Chapter 2. Data modules and their sources 11For example, file A with columns ColA and ColB can be relinked to file B with columns ColA and ColB.
Relinking to file B with columns colA and colB would not work.
The data types of the matching columns must be compatible for the data module calculations and
relationships to remain valid. For example, if the column data type in the original source is date, the
column data type in the target source must also be date, and not string or timestamp.
• For data servers, packages, and data modules, all tables from the original source must exist in the
target source, and the tables Identifier properties (case-insensitive) must match. If a matching table
can't be found based on these criteria, the system also considers the table labels and matching
columns identifiers (case-sensitive) when trying to find the right match.
If a duplicate match is found in the target source, the last table in the list is used for the match.
• Extra columns and tables can exist in the target source.
When relinking to a source that contains a table with extra columns, you can add the extra columns to
the table in the data module by dragging the table from the Sources pane to the Data module pane.
• The source names, such as file and package names or data server connection names, do not need to
match.
Tip: Columns and tables matching is done by comparing their Identifier property. The column or table
Identifier value can be, but not always is, the same as the column or table name (Label). You can view
the Identifier value in the column or table Properties pane, Advanced section.
Procedure
1. From Team content or My content, open your data module.
2. In the Sources pane, find the source that you want to relink.
3. From the source context menu, select Relink.
4. Select the source type that matches the original source type. If the original source is data server,
select data server, if it's an uploaded file, select a file, and so on.
5. Click Done.
If the relink was successful, a confirmation message is displayed.
If the relink finished with errors, a message is displayed that suggests opening the validation view
where the relink issues are listed. Resolve the issues, and save the data module. You can also save the
data module with unresolved issues.
Important: The validation process does not detect incompatible data types on columns. If there are
columns with incompatible data types in your sources, and all other relink conditions are met, the
successful relink message is displayed. This type of data issues must be reconciled in the sources.
Results
After you successfully relink a source in a data module, reports and dashboards that are based on this
data module can start using the new source without any involvement from report authors.
Enriching packages
To optimize the user experience in IBM Cognos Analytics components, such as dashboards and
explorations, Framework Manager packages must be enriched.
The enrichment process associates the Cognos Analytics data characteristics, such as Time and
Geographic location, to query items in the packages. The information from the enrichment process
complements the information, such as the data type, column name, or Usage property value, that is
derived from the package metadata.
An enriched package includes the data characteristics that are required for the artificial intelligence (AI)
based functionality in the product, such as visualization recommendations or intelligently set default
values on column properties. For example, to display the relationships diagram in Explore, an enriched
package must be used. Otherwise, the relationships diagram isn’t displayed.
12 IBM Cognos Analytics Version 11.1 : Data Modeling GuideTip: You can't enrich a package that includes dimensionally modeled (DMR) relational objects. Query
subjects that include prompts can be enriched, but data isn’t retrieved.
The enrichment process can be time and memory-intensive so it should be performed only when the
original package has changed. Consider reenriching the package after the following changes to the
package:
• Names of query subjects, query items, and namespaces are changed.
• Data types on query items are changed. For example, number changed to string.
• New query items are added.
• Filters or expressions are changed that significantly alter the values that the query subject would return.
• A deployment archive is imported into a new environment that uses different data from the source used
for a previous enrichment.
When a package is republished, existing enriched metadata isn’t removed or refreshed.
Before you begin
To minimize the impact of the enrichment process on the system, consider creating smaller packages that
include only a subset of purpose-specific query subjects, and enriching only the smaller packages. For
example, a package used by advanced report authors might expose many query subjects where many of
the query subjects aren’t relevant when creating dashboards or explorations. You can create a smaller
package off the original package, and include only those query subjects that you need in your dashboards
and explorations. Enriching this smaller package requires less time and memory.
About this task
You can enrich a package metadata by using the automatic or manual process. The automatic process
evaluates all query items of all selected query subjects in the package, and automatically applies the data
characteristics to them. To minimize the impact on the system, you can deselect namespaces or
individual query subjects to exclude them from the enrichment process. In the manual process, you
explicitly apply the data characteristics to individual query items.
When enriching a package, you typically start with the automatic process. Use the manual process to
enrich only a small subset of query items, or to override values that were set incorrectly by the automatic
option.
To access the Enrich package functionality, you need write permissions for the package. You also need
the required permissions for the signons that are used to access the package underlying data sources. An
ideal signon can access the tables, views, and columns that the query subjects are based on and a
representative number of rows and values in the queried tables and views.
Procedure
1. Locate the package or its shortcut in Team content or My content.
2. From the package or shortcut context menu , select Enrich package.
Tip: If a package was used as a data module source, you can enrich the package in the modeling user
interface, in the Sources pane.
3. If you are using Cognos Analytics version 11.1.5 and later, select one of the following options. If
you are using version 11.1.4 and earlier, proceed to step 4.
• Enrich automatically
Most of the time, start with this option. The status information shows you the dates when the
package was published and last enriched.
– In the Select tables panel, deselect the query subjects that you don't want to be evaluated by
the enrichment process. By default, all visible query subjects in the package are evaluated.
Chapter 2. Data modules and their sources 13This option gives you the opportunity to exclude the query subjects that aren’t used in your
dashboards or explorations, and therefore reduce the time and memory usage by the system.
– Select the Retrieve sample data check box, and specify the number of rows to retrieve by your
data sample.
Use this option to extract the deeper data characteristics from the package, such as minimum or
maximum values in each numeric column, NULL values, or approximate number of distinct
values in each column. Extracting too many rows might impact the system performance; too few
rows might not provide enough information.
Clearing this checkbox reduces the time and memory usage by the system, but the expected
information might not be gathered.
– Click Run.
Depending on the number of query subjects involved, the enrichment process can take some
time, potentially even hours. After the process is finished, an information message shows you
the results of the process. Even if only a certain percentage of the query subjects were enriched,
you might have enough data to support the AI-functions in your dashboards and explorations.
– Click Close.
• Enrich manually
Use this option to enrich individual query items.
– Expand the package. Then, expand a query subject, and select one or more query items.
– From the Define data representation drop-down menu, select the option that you want the data
in the query to represent, either Time or Geographic Location, and their specific values. The
Default value allows to propagate settings from the source.
– Click OK.
4. If you are using Cognos Analytics version 11.1.4 and earlier, select one of the following options.
• Enrich automatically
Most of the time, start with this option. The status information shows you the dates when the
package was published and last enriched.
– On the Load options tab, define the characteristics of the data sample to retrieve from the
package.
Retrieve sample data - select this check box and specify the number of rows to retrieve by your
data sample. Too many rows might impact the system performance; too few rows might not
gather enough information. Clearing this check box reduces the time and memory usage by the
system, but doesn’t gather the expected information.
Retrieve statistics - select this check box to extract the deeper data characteristics from the
package, such as minimum or maximum values in each numeric column, NULL values, or
approximate number of distinct values in each column. Clearing this check box reduces the time
and memory usage by the system, but doesn’t gather the expected information.
– On the Tables tab, deselect the query subjects that you don't want to be evaluated by the
enrichment process. By default, all visible query subjects in the package are evaluated.
This option gives you the opportunity to exclude the query subjects that aren’t used in your
dashboards or explorations, and therefore reduce the time and memory usage by the system.
– Click Run.
Depending on the number of query subjects involved, the enrichment process can take some
time, potentially even hours. After the process is finished, an information message shows you
the results of the process. Even if only a certain percentage of the query subjects were enriched,
you might have enough data to support the AI-functions in your dashboards and explorations.
– Click Close.
• Override manually
14 IBM Cognos Analytics Version 11.1 : Data Modeling GuideUse this option to enrich individual query items.
– Expand the package. Then, expand a query subject, and select one or more query items.
– From the Select an option drop-down menu, select the option that you want the data in the
query to represent, either Time or Geographic Location, and their specific values.
– Click Save.
Setting up data caching
You can enable data caching in a data module, and specify the cache expiry options.
The cache is populated by the result sets from SQL queries to data servers. These SQL queries originate
from widgets (visualizations in dashboards, reports, stories, and explorations).
The cached result sets are reused when a subsequent request that generates exactly the same or
compatible SQL statement is made. An example of a compatible SQL statement is one that's identical to
another statement, except that it has one more filter.
To see how caching is used, open a dashboard, report, story, or exploration, and then open another
dashboard, report, and so on, where at least one of the widgets has exactly the same or compatible SQL
statement.
Results that are cached from one user’s request can be used for a different user’s request only if both
users have the same data security profiles, which means that the following information is the same for
both users:
• Sign-on information (user name and password) to the data server.
• Expanded values of data source connection command blocks.
• Data security defined in the data module.
• Expanded values of macros within the queries used to populate the cache.
About this task
Data caching can be enabled at a source level, or at a table level. Tables don't automatically inherit the
cache options from their sources.
The following data cache options can be specified for sources and tables:
• No cache
Data caching is disabled.
• Automatic
Reflects the data cache option that was specified for a source. This option is available for tables only.
• Custom
Enables data caching, and allows to specify the length of time to keep the cached data.
• Macro
Enables data caching that is based on a macro.
Data caching is not applicable to OLAP cube data, data sets, and uploaded files even if the Data cache
setting is available in the user interface.
Procedure
1. From Team content or My content, open a data module.
2. To specify data caching for a source, do the following steps:
a) Click the Source view pane to expand it, and locate the source.
b) From the source context menu, select Data cache.
Chapter 2. Data modules and their sources 15c) Specify one of the cache options, and click OK.
3. To specify data caching for a table, do the following steps:
a) In the Data module pane, select one or more tables, and from the context menu, click Properties.
b) Under Advanced properties, locate the Data cache property.
c) Specify one of the cache options, and click OK.
The Automatic cache option reflects the cache option that was specified in the source. For
example, if the source data cache was set to Custom, with the time limit of 1 day, the automatic
cache option for the table is shown as Automatic (1 day). If multiple tables are selected, the cache
option of the table that was selected first is shown as the automatic option for the selected group
of tables.
4. Save the data module.
Results
Cached results are retained for the length of time that is specified in the Data cache setting. The
timestamp of the cache entry is the time at the beginning of the request, the moment before the query
execution starts.
When fields from different tables that have different cache settings are used together, the cache is
retained as long as the cache for the table with the smallest setting. For example, if the data cache for one
table is set to 5 min, and for another table to No cache, there's no caching for a visualization that uses
fields from both tables.
What to do next
The Data cache setting in data modules can be overwritten in dashboards and stories. In these
components, you can also enable browser data caching that allows the client applications to store the
query results in the browser. Browser data caching is not available in Cognos Analytics reports.
Securing data
You can secure data at the value level by creating security filters.
A security filter defines which users, groups, or roles have access to specific data values in a table. When
the users work with dashboards, reports, or explorations that use the table, only the data that is included
in the security filter is visible to them.
There are business reasons for restricting access to data at such low level of granularity. For example, you
have confidential data that only specific users are allowed to see. Or, a table contains many records, and
your users need only a subset of those records.
Before you begin
The schema metadata for the associated data server connections must be loaded, and you must have
write permissions for the connections and their signons.
Tables that are based on typed-in SQL bypass security filters. To avoid potential security risks, specify the
ibmcognos.typeinsqldisabled property on the data server connection that your data module is
based on. If an attempt is made to create an SQL-based table after this property is specified, the table is
not created. If this property is specified after an SQL-based table was created, the query execution is
stopped. For more information about Cognos-specific connection parameters, see the IBM Cognos
Analytics Managing Guide.
About this task
This type of data security can be implemented only for data server sources.
Users who perform this task must belong to a role that has the Set data security feature enabled in the
administration interface. Otherwise, the table context menus in the data module won't show the Set data
16 IBM Cognos Analytics Version 11.1 : Data Modeling Guidesecurity option that is needed to perform this task. For more information, see “Customizing the user
interface” on page 4.
Procedure
1. From Team content or My content, open a data module.
The data module source must be a data server, or another source that includes data server tables.
2. Click the Sources pane to expand it.
3. Expand the data server schema to view its tables.
4. From a table context menu, select Set data security, and click Add security definition.
5. In the Set data security dialog box, create the filters by associating specific users, groups, or roles
with columns in the table.
a) In the Users, groups and roles pane, click the add icon . In your authentication namespace,
locate the users, groups, or roles for which you want to define access to the table data, and select
their associated check boxes. The selected names appear in the Selected users, groups and roles
pane.
b) In the Filters pane, from the Select a column drop-down list, select one column, and click Create
a filter. Specify the required filter conditions, and click OK. You can add filters for other columns in
the same way. To add filters for multiple columns at once, from the Select a column drop-down
menu, select the via expression editor option. Your security definition can include one or multiple
filters.
c) Specify a name for the security definition, and click OK.
The security definition is added to the Security filters tab in the table properties. In the Sources
panel, the padlock icon appears beside the table name.
Chapter 2. Data modules and their sources 17You can also read