HPCToolkit Graphical User Interface - Laksono Adhianto Rice University HPCToolkit Tutorial NERSC and OLCF March 29, 2021 (Virtual)
←
→
Page content transcription
If your browser does not render page correctly, please read the page content below

HPCToolkit Graphical User Interface

Laksono Adhianto
Rice University

HPCToolkit Tutorial NERSC and OLCF
March 29, 2021
(Virtual)

                                      1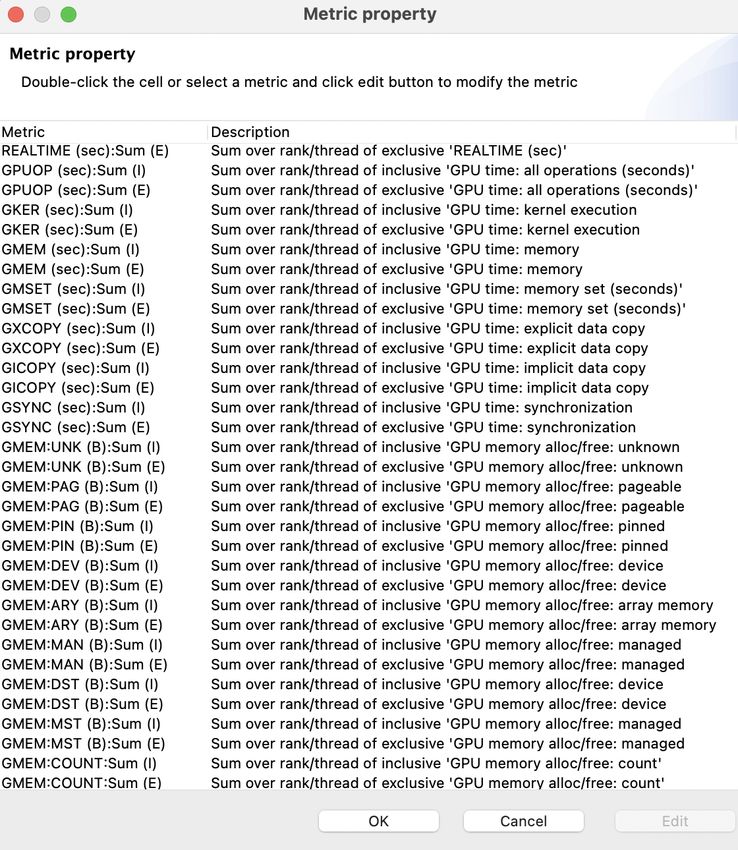
Outline
• Introduction to HPCToolkit GUI (hpcviewer)
  – Overview of the HPCToolkit GUI
  – Installing and launching hpcviewer
  – HPCToolkit database
• Working with hpcviewer
  – Introduction to the Profile view
  – Introduction to the Trace view
  – Tips using hpcviewer
• Demo
  – On remote machines (e.g cori and summit)
  – On local machine (laptop)

                                               2
call path
HPCToolkit GUI (hpcviewer)                                      profile
                                                                                     profiles
                                                               execution
                               compile & link
                                                                [hpcrun]
                                                                                     call path
                          source                                                      traces
                                             optimized
                           code               binary
                                                                 binary
                                                                                     program
• Based on Java and Eclipse RCP                                 analysis
                                                                                     structure
                                                               [hpcstruct]
  • Requires Java 11 and GTK 3.2x (Linux)
• Available on MacOS, Windows, Linux x86_64, ppc64le and aarch64
  • No support for 32 bit platforms
  • Not tested yet on MacOS M1

                                                                               interpret profile
                                presentation
                                                         database            correlate w/ source
                                   [hpcviewer]
                                                                             [hpcprof/hpcprof-mpi]

                                                                                                     3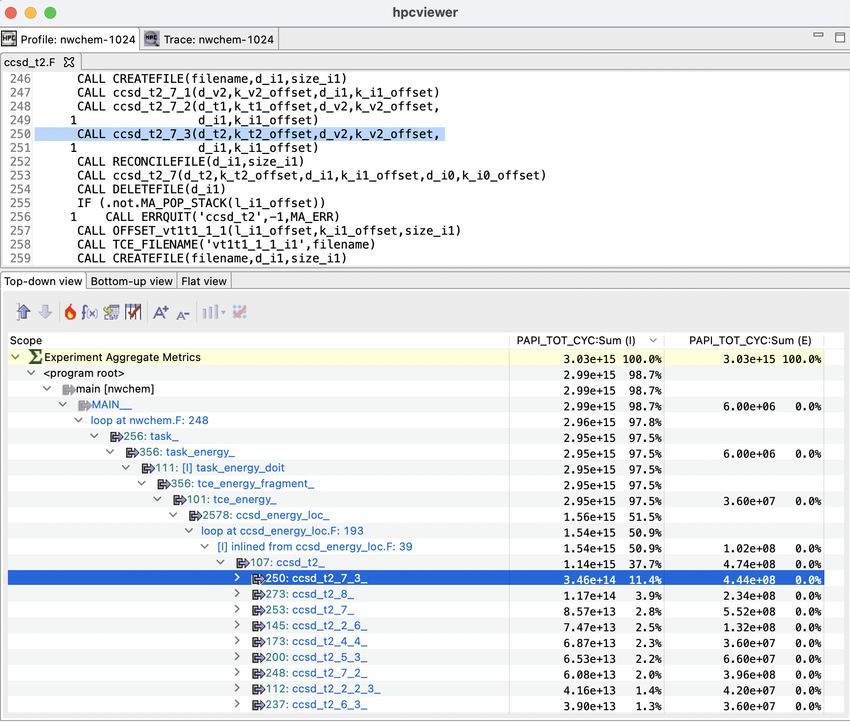
HPCToolkit Database
• HPCToolkit database contains four information:
  • Call-paths: the union of all functions/loops/statements as each measurement taken
  • Profiles: a list of threads, processes and/or GPU streams
  • Metrics: a set of hpcrun events (-e option)
     • Exclusive (E): the quantity of the metric measured for a scope alone
     • Inclusive (I): the value measured for that scope as well as costs incurred by any functions it calls.
  • Time: a sequence of time of the sample
     • Available when run hpcrun with -t option

                                   Call-paths
                                                  Time

                                                         P0           P1                         Pn   Profiles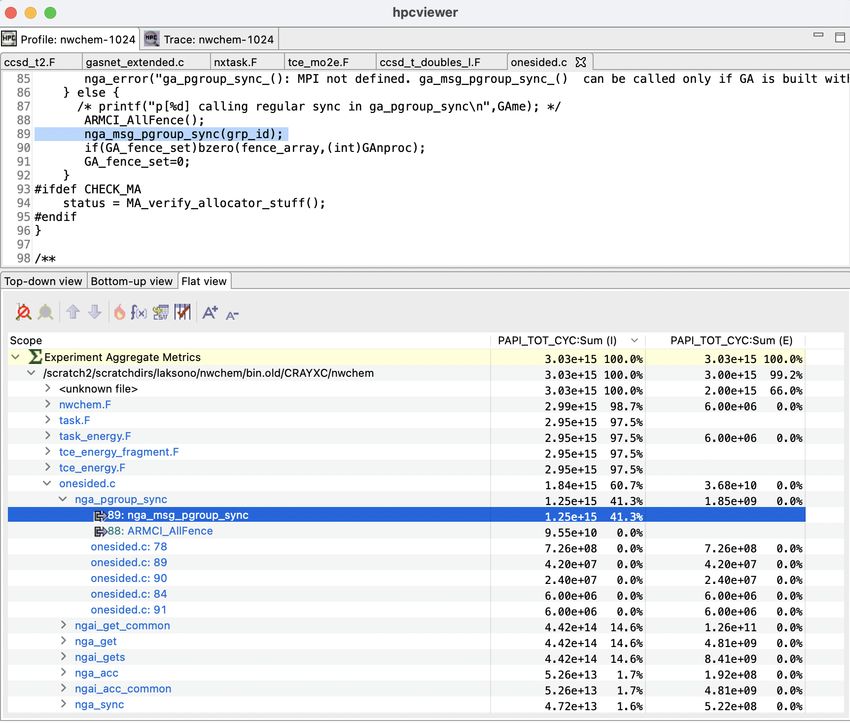
Installing hpcviewer

• Already available on Cori (NERSC) and Summit (ORNL)
   • Type: module load hpcviewer/2021.03.01
• To install locally:
   • Download prebuilt binaries http://hpctoolkit.org/download.html
         • Linux and Windows: download directly from the web browser
         • MacOS: download via curl program to bypass Apple Gatekeeper
   • Build with command line
      • Requires Java 11 and Apache Maven 3.6 or newer
      • See the instructions at http://github.com/hpctoolkit/hpcviewer.e4
   • Linux only: spack install hpcviewer
   • Caveat: need to copy the database to the machine where hpcviewer is installed

                                                                                     5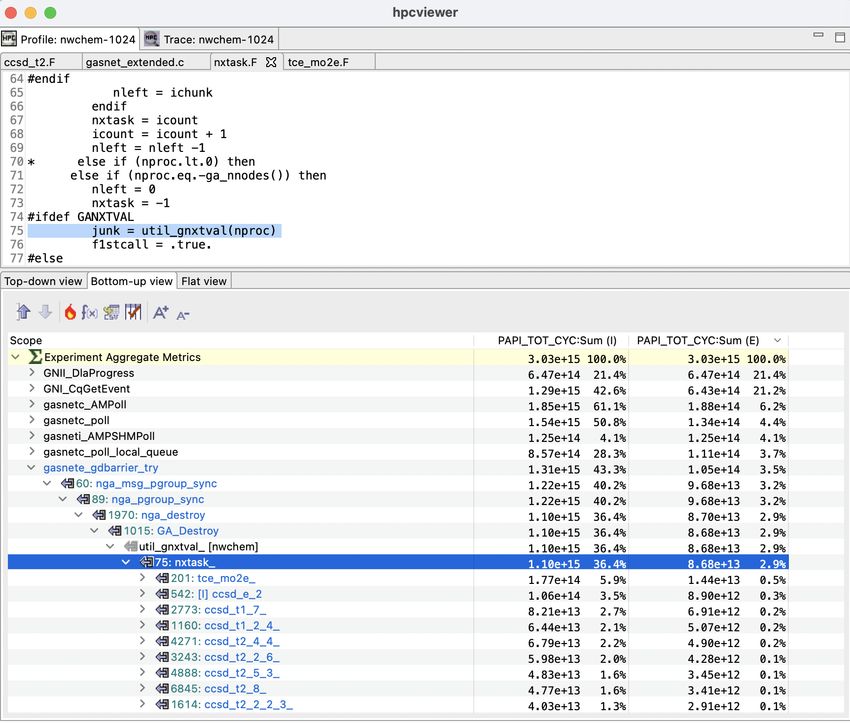
Launching hpcviewer

• On Linux:
  • Type: hpcviewer [options] [database]
• On Windows and MacOS:
  • Simply click the hpcviewer icon
  • Windows command line: hpcviewer.exe
  • MacOS command line: open hpcviewer.app

                                             6
Modes in hpcviewer
Two modes:
• Profile: presents the summary
 of application performance with
 different perspectives: top-
 down, bottom-up and flat
• Trace: presents program
 traces in a top-down fashion.
 This view is only visible if the
 trace information is available in
 the database.
 Previously the trace view was
 a separate program

                                     7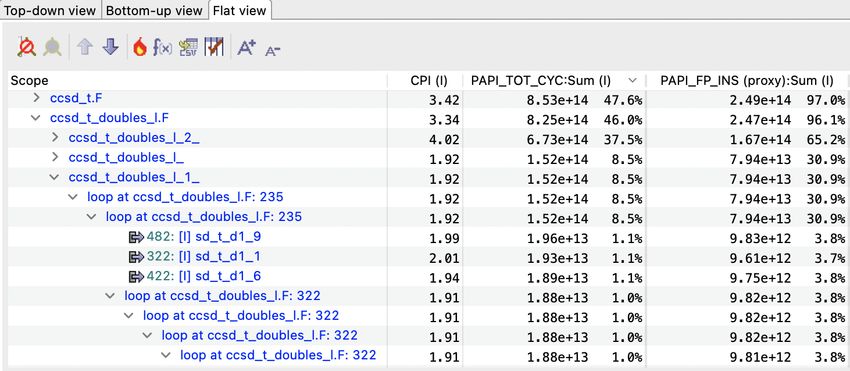
Profile View
                                                   file1.c                  file2.c
• Top-down view: presents dynamic calling          // m: main routine       g () {
 contexts (call paths) in which costs were         m () {                             if ( . . ) g ();
 incurred                                                  f ();                      if ( . . ) h ();
                                                           g ();            }
• Bottom-up view: presents costs by looking        }
 upward along call paths                           f () {                   h () {
                                                           g ();            }
• Flat view: presents costs based on the
                                                   }
 structure of an application
       Top-down                      Bottom-up                                       Flat
           m                     g            h      f    m                               a.out

      g3          f        ga   ma      fa    gc     me                     file1.c               file2.c

                                                                        f        m                g        h
                  g1       fb           mb    gd

                                                                  gx        fx       gy     gz        hy
                  g2       mc                 fc

                  h                           md
                                                                                                               8
Top-down view
Tips                                                          source pane
• Click the hot-path      button to
    automatically drill down the tree. It
    is an easy way to find performance
    bottlenecks for the selected metric
• Clicking the call-site icon     or the
    line number will highlight the call     navigation pane         metric pane
    location on the source pane

•   function calls in full context
•   inlined procedures
•   inlined macros/templates
•   sequential loops
•   outlined OpenMP loops (not
    shown)
•   Line statements (not shown)

                                                                                  9
Bottom-up view
Tips
• Click the header of a metric
  column to sort the column
• Sorting by an exclusive metric
  is very useful to find the
  costliest functions
• Click the hot-path  button to
  see the most important way or
  ways the selected function was
  reached

Caveats
• Suffix “Sum” on the column
  header means the value is the
  sum over all ranks/threads,
  including helper threads

                                   01
Flat view
Tips
• Use Flat view to identify
overheads of the libraries
(communication, I/O, OpenMP
libraries, …)
• If there are too many metrics,
you can hide some metric
columns by clicking the
button
• Click the button to create a
derived metric from existing
metrics
11Creating a User-Defined Metric
• Assume the database has 2 metrics:
• PAPI_TOT_CYC has the metric-id 2048
• PAPI_FP_INS has the metric-id 2050
• To compute the inclusive metric of “Cycle Per Instruction
(CPI)” :$2048 / $2050
• Two ways to reference a metric:
• Using the $ : a point-wise value of a metric at a node in the
tree
• Using @ : the aggregate metric value at the root of the tree
21Metric description
Tips
• Click “View - Show metrics” menu to find the
metric descriptions
• The Metric property window also allows to edit
the metric’s label and the formula of the user-
defined metric
• Hovering the mouse over a metric-column
header will display a tooltip of the metric’s
description
Caveats
• User-defined metrics are not persistent. You
need to create them again every time you open
databases
31Trace View: Understanding Temporal Behavior
• Profiling compresses out the temporal dimension
– Temporal patterns, e.g. serial sections and dynamic load imbalance are invisible in profiles
– We need to explore temporal behavior of the application
• What can we do? Trace call path samples
– N times per second, take a call path sample of each thread
– Use hpcrun trace option: hpcrun -t …
– View how the execution evolves left to right
– hpcviewer assigns each procedure a color; view a depth slice of an execution
Processes
Call
stack
Time
14Trace View
Tips Ranks
• You can zoom horizontally by
selecting a region in the Depth
view
• Click the Max-depth button
to set to the maximum call-
stack depth
• Use the Undo button to
return to the previous region
Call Path at
Depth view: the call stack across Cross Hair
Time
the current displayed time range in
a specified rank
15Trace View
Tips
• Summary view: can be used to
identify load imbalance
• You can zoom horizontally by
selecting a region in the Summary
view
• Statistics view: clicking the
column header will sort based on
the column
Summary view: the projection of
number of calls of across the current
displayed time-range and rank
Statistics view: the proportion of
number of samples across the current
displayed time-range and rank
61Trace View: Zoom
Different ways to zoom
• Click the zoom buttons on the top-
left toolbar
• Select a region in the Main view
• Select a time range in the Depth
or Summary View
• Select a region in the Mini map
(only if the view is already zoom-
in)
71Trace View: Zoom
Tips
• To save the current region, click
the Save button at the top-left
toolbar.
• To load the previous saved
region, click the Load button,
and select the file.
81Trace View: Zoom
Caveats
• Colors are generated randomly
• Procedure’s color can be different
every time the database is opened
Tips
• You can assign procedures to a
certain color by selecting “View -
Procedure-Color Map” menu
• It can be useful to assign a color
to all routines in the OpenMP
runtime, e.g. matching *kmp* to
assess how much time is spent in
the runtime
• The user-defined color mapping is
persistent across different
hpcviewer instances
91Trace View: Zoom
Tips
• You can zoom the Depth view by
clicking the “Zoom” buttons at the
bottom right toolbar
• Unusual changes or clustering of
deep call stacks can indicate
behaviors of potential interest
02Trace View: Filter
Hiding processes/threads
• Useful to view only certain
processes or threads
• Select “Filter - Filter ranks” menu
• Check the threads of interest
Example #1: to view only the main
threads:
• Click “Uncheck all” button
• Type “Thread 0” in the Filter field
• Click “Check all” button
• Click “Ok” button
12Trace View: Filter
Displaying only the main threads
• Useful to see the interaction
between MPI processes
Example #2: to view only the helper
threads:
• Click “Check all” button
• Type “Thread 0” in the Filter field
• Click “Uncheck all” button
• Click “Ok” button
22Trace View: Filter
Tips
• Rank filter is useful to hide helper
threads. OpenMPI has 2 helper-
threads for each MPI process
32Demo
24Troubleshooting
25Changing the maximum size of memory allocation pool
• On Linux: hpcviewer [options] [database]
-h --help Print a help message.
-jh, --java-heap
• On Windows:
• Change the value of -Xmx2G in hpcviewer/hpcviewer.ini file
• On MacOS:
• Change the value of -Xmx2G in hpcviewer.app/Contents/Eclipse/hpcviewer.ini file
62Coping with Temporary Idiosyncrasies in HPCToolkit
• I brought up hpcviewer and I am staring at a blank pane
• click in it! sometimes Eclipse doesn’t refresh the pane when it should
72You can also read