How is decadal variability in the tropical Pacific linked to sea ice variations in the Arctic and Antarctic?
←
→
Page content transcription
If your browser does not render page correctly, please read the page content below
How is decadal variability in the
 tropical Pacific linked to sea ice variations
 in the Arctic and Antarctic?
 Gerald Meehl1

 Julie Arblaster1,2, Christine Chung3, Marika Holland1,
 Alice DuVivier1, LuAnne Thompson4, Haiyan Teng1,
 Dongxia Yang2, and Cecilia Bitz4
 1. National Center for Atmospheric Research, Boulder, CO
 2. Monash University, Melbourne, Australia
 3. Bureau of Meteorology, Melbourne, Australia
 4. University of Washington, Seattle, WA
Meehl et al, 2016: Antarctic sea ice expansion between 2000-2014 driven by tropical Pacific decadal climate variability.
Nature Geoscience, DOI: 10.1038/NGEO2751.

Meehl et al., 2018: Tropical decadal variability and the rate of Arctic sea ice retreat, Geophys. Res. Lett.,
10.1029/2018GL079989.

Meehl et al., 2019: Recent sudden Antarctic sea ice retreat caused by connections to the tropics and sustained ocean
changes around Antarctica, Nature Comms., 10:14, https://doi.org/10.1038/s41467-018-07865-9
High latitude tidbits:
The Arctic is a polar ocean surrounded by land
Antarctica is a polar continent surrounded by ocean

In the North Pacific and North Atlantic, the warmest water is near the surface and
gets colder with depth
In the Southern Ocean around Antarctica, the coldest water is near the surface
and gets warmer with depth

Both the Antarctic continent and the Arctic Ocean are a bit larger than the
continental U.S.
Antarctic and Arctic sea ice
undergo large seasonal cycles
Antarctic: most of sea ice
forms equatorward of 70S
Arctic: most of sea ice forms
poleward of 70N

Nearly the entire Arctic still
freezes over every winter
(though the sea ice thickness
has been decreasing)

There is interest in when the
Arctic would become “ice
free” in September, thus
routinely opening up the
Northwest Passage for
commerce 2018 2018
Factors affecting distributions of Arctic and Antarctic sea
ice from year to year and decade to decade

Because Antarctic sea ice is not constrained at the
northern boundary, surface winds can push the ice either
northward or southward and affect the sea ice extent
(along with ocean and air temperatures)

Because Arctic sea ice is constrained by land on all sides,
surface winds can push the ice around within the Arctic,
but sea ice extent is affected by the strength of the wind
in opening leads to influence sea ice thickness and extent
(along with ocean and air temperatures)
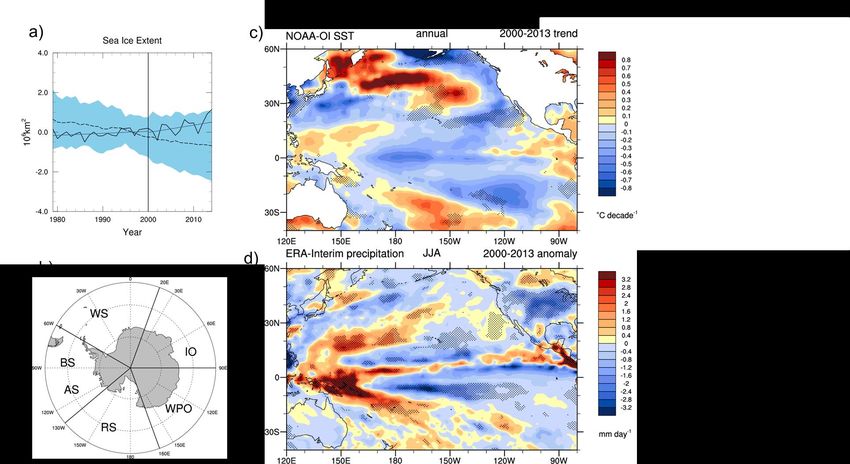
From 1979 to about 2015, Arctic sea ice extent decreased
but Antarctic sea ice extent expanded
(spoiler alert: things changed in the Antarctic in 2016)

The average of all climate models showed sea ice extent
decreasing in the Arctic and Antarctic

Arctic sea ice extent decreased Antarctic sea ice extent increased
Concepts to explain how the tropics can affect high latitudes:

Teleconnection
(processes in one location can affect atmospheric circulation
thousands of miles away)

Convective heating (diabatic heating)
(convective heating anomaly in the tropics, produced by a
precipitation anomaly usually associated with a sea surface
temperature anomaly)

Rossby wave
(large-scale standing wave in the atmosphere forced by a tropical
convective heating anomaly; the mechanism of teleconnections
from tropics to high latitudes)
Antarctic sea ice extent
increased more rapidly after
 --Increases in observed Antarctic sea-ice
2000… extent accelerated after the late 1990s
(until 2016) --The average of all climate models shows a
 CMIP5 multi-model average decline
 decreasing --Are the models wrong, or can natural
 variability associated with the Interdecadal
 Pacific Oscillation (IPO) be playing a role?

 Observations increasing,
 about 5 times as fast since 2000
 2014

 linear trend 1979-1999: +0.12 x 10⁶ km2 decade-1
 2000-2014: +0.57 x 10⁶ km2 decade-1
 1979 2000

 (Meehl, G.A., J.M.
 Arblaster, C. Bitz, C.T.Y. Observed IPO pattern (top, sign
 convention for positive IPO) and
 Chung, and H. Teng, 2016: PC time series index (bottom)
 Nature Geoscience, DOI:
 10.1038/NGEO2751.)
Weddell Sea

 Indian Ocean
Bellingshausen Sea
 Amundsen Sea

 Western Pacific
 Ross Sea
Annual
sea ice Largest trends for increasing sea ice since 1979 have been
trends
 occurring in the Ross Sea region

 These increases are connecting to a deepening of the
 Amundsen Sea Low

 (Turner et al., 2015, Clim. Dyn.)
 The Amundsen Sea Low is a major
 feature of the mean climatology of sea
 level pressure in the southern Pacific
 JJA
 MAM

 ASL
 ASL
 Correlation
 of sea ice
 extent in
 Ross Sea ASL
 SON DJF
 with SLP

 ASL
 ASL

 (Raphael et al., 2016, BAMS)
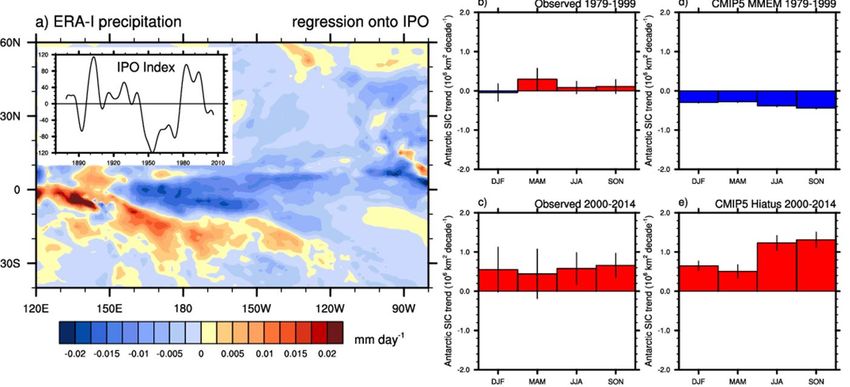
SLP in the Amundsen
Sea Low is connected
to rainfall in the
tropics
(also Ding et al., 2011, Nature
Geo.; Schneider et al., 2012,
J. Climate; Li et al., 2014, Nature;
Clem and Renwick, 2015, J.
Climate)

and the IPO

 (Meehl, Arblaster, Bitz, Chung, and Teng, 2016, Nature Geo.)
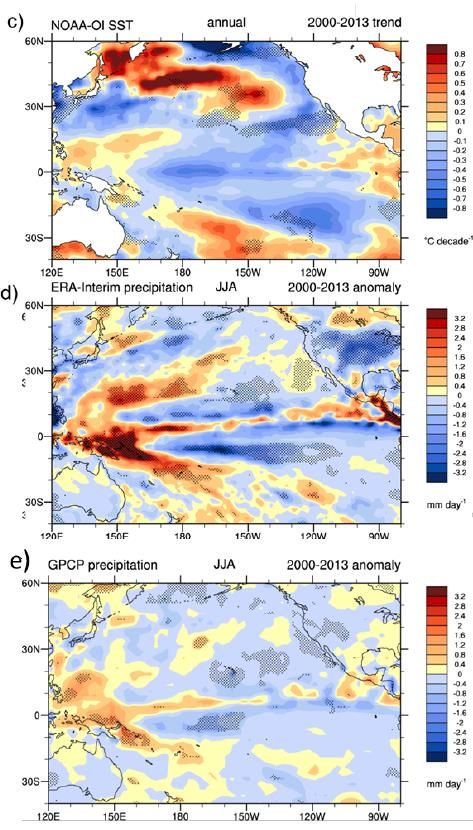
Negative IPO: tropical Pacific SSTs
 cooler, negative precipitation and
 convective heating anomalies, and
 expanding Antarctic sea ice

 CMIP5 multi-
 model average:
 shrinking sea ice
 Positive observed
 IPO: little sea ice
 trend

 Negative observed Negative IPO in
 IPO: sea ice CMIP5 models:
Observed SST trend, 2000-2013 (top) and two expansion expanding sea ice
estimates of precipitation anomaly, 2000-2013
(middle and bottom)
Slowdown as observed from 2000-2013:
 10 members out of 262 possible realizations

Some CMIP5 uninitialized models actually
simulated the “early 2000s slowdown”
(sometimes referred to as the “hiatus”)
as observed

Characterized by a negative phase of the IPO

internally generated variability in those
model simulations happened to sync with
observed internally generated variability

(Meehl et al., 2014, Nature Climate Change)
Negative IPO: tropical Pacific SSTs
cooler, negative precipitation and
convective heating anomalies, and
expanding Antarctic sea ice

 CMIP5 multi-
 model average:
 shrinking sea ice
 Positive observed
 IPO: little sea ice
 trend

 Negative observed Negative IPO in
 IPO: sea ice CMIP5 models:
 expansion expanding sea ice

 (Meehl et al., 2014, Nat.
 Clim. Chg.)
H
Negative IPO: observed deepening of
Amundsen Sea Low, and expanding Antarctic
sea ice since 2000 driven by equatorward
surface winds H

 H

Model sensitivity experiment: IPO-related
 H
negative convective heating anomalies in
eastern tropical Pacific produce deepened
Amundsen Sea Low and predominance of
equatorward surface winds that expand
 H
Antarctic sea ice

(only JJA shown here, other seasons show
H
Negative IPO: observed deepening of
Amundsen Sea Low, and expanding Antarctic
sea ice since 2000 driven by equatorward
surface winds H

Model simulations with negative IPO 2000-
2013

 H
 L

 H
H
Negative IPO: observed deepening of
Amundsen Sea Low from 2000-2014, and
expanding Antarctic sea ice since 2000 driven
by equatorward surface winds H

 H

 To pin down the connection between the IPO and Antarctic sea ice expansion,
Model sensitivity
 run an atmosphereexperiment: IPO-related
 model sensitivity H specified
 experiment with a negative
negative convective
 convective heatingheating
 anomalyanomalies in
 in the eastern equatorial Pacific (135W, Eq) to
eastern tropical
 represent the Pacific produce
 negative deepened
 precipitation anomalies associated with negative IPO
Amundsen Sea Low
 that occurred fromand predominance of
 2000-2014
equatorward surface winds that expand
Antarctic sea ice H

(only JJA shown here, other seasons show
similar results)
Negative IPO: observed deepening of
Amundsen Sea Low from 2000-2014, and H
expanding Antarctic sea ice since 2000 driven
by equatorward surface winds

 H

 H

Model sensitivity experiment: IPO-related
negative convective heating anomalies in
eastern tropical Pacific (135W, Eq) produce H
and anomalous atmosphere Rossby wave
response involving a deepened Amundsen
Sea Low and preponderance of equatorward
surface winds that expand Antarctic sea ice
 H
(only JJA shown here, other seasons show
similar results) H
Meanwhile, in the Arctic…
At the IPO transition to negative around 2000, sea ice extent trends accelerate
in both seasons (NDJF by nearly a factor of two, nearly a factor of three in JJAS)

 Trend ~3x
 larger
 Trend ~2x than pre-
 larger 2000
 than pre-
 2000

 (Meehl et al., 2018: Tropical decadal variability and the rate of Arctic
 sea ice retreat, Geophys. Res. Lett., 10.1029/2018GL079989.)
What is the nature of the connections between the
tropics and the Arctic?

Tropics drive Arctic changes (Lee et al., 2011; Ding et
al., 2014)

Arctic drives changes in lower latitudes (Cohen et al.,
2018; Screen et al., 2018)

Two stage process—Arctic drives tropical changes
which then feed back and drive Arctic changes
(Cvijanovic et al., 2017)
Negative IPO

 Second EOF of 13
 year low pass
 filtered SSTs for
 Pacific 40S-60N
 (Meehl et al 2016)

 2000
 Positive Atlantic Multidecadal
 Oscillation (AMO) Detrended 10
 year low pass
 filtered North
 Atlantic SSTs 0-
 2010
 60N, 1870-2015
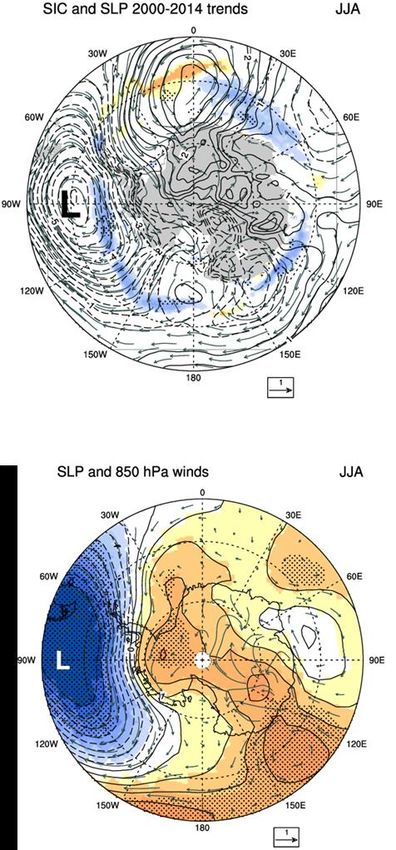
Observed SLP H
and sea ice
concentration
trends 1979- L
1999
 L L
 H

 Marked difference in observed SLP trend patterns from
 1979-99 (above) to 2000-2014 (below) in both seasons

Observed SLP
and sea ice H L
concentration
trends 2000- H
2014
 H
 L
Observed SLP
 and sea ice
 H L
 concentration
 trends 2000-
 2014 H

 H
 L L

 2000-2014: qualitative agreement in pattern of observed SLP trends in NDJF for obs
 and negative IPO convective heating anomaly (left side); little agreement (actually
 opposite sign) of pattern from obs to model experiment in JJAS (right side); forcing
 from Pacific seems to be affecting the Arctic region in NDJF, not JJAS
Negative convective heating
anomaly Pacific H H
(negative IPO)
SLP L
Negative Pacific
convective heating H
anomaly experiment L H
Observed surface
 temperature trend
 2000-2014
 cooling warming

Surface cooling
temperature trends

2000-2014: qualitative agreement in pattern of observed surface T trends in NDJF for
obs and negative IPO convective heating anomaly (left side); little agreement in
pattern from obs to model experiment in JJAS (right side). Consistent with SLP, forcing
from Pacific seems to be affecting the Arctic region in NDJF, not JJAS
Negative convective
heating anomaly, Pacific
(negative IPO)
Surface temperature
anomalies
 cooling warming

 cooling
Observed SLP
 and sea ice H L
 concentration
 trends 2000- H
 2014
 H
 L

2000-2014: little agreement in pattern of observed SLP trends in NDJF for obs and
positive Atlantic convective heating anomaly (left side); qualitative agreement in JJAS
(right side); forcing from Atlantic affecting the Arctic region JJAS, not NDJF

 Positive convective
 heating anomaly, H L
 Atlantic
 SLP H
Positive Atlantic
convective heating
 L H
anomaly experiment
Observed surface
 temperature trend
 2000-2014
 warming
 warming

2000-2014: Consistent with SLP, forcing from Atlantic affecting the Arctic region JJAS

 Tropical Atlantic
 Positive convective
 heating anomaly warming
 cooling

 Surface temp
Larger amplitude SLP
teleconnection patterns and
thus stronger surface winds in
the 2000-2014 period
compared to 1979-99 are
associated with increases in
ice drift velocities (~factor of 3
in NDJF, ~factor of 10 in JJAS)

Stronger surface wind
anomalies and ice drifts
(Spreen et al., 2011) typically
associated with reduced
multiyear ice (Kwok et al.,
2013) as seen in 2000-2014
compared to 1979-99 Ice drift trends (cm sec-1 decade-1)
 (data source: Tschudi et al., 2016)
Back to the Antarctic:
Back to the Antarctic:

There was a sudden and dramatic decrease of
Antarctic sea ice extent in late 2016 sustained
through 2018 and into 2019

(Meehl et al., 2019: Recent sudden Antarctic sea ice retreat caused by connections to the tropics and
sustained ocean changes around Antarctica, Nature Comms., 10:14, https://doi.org/10.1038/s41467-
018-07865-9)
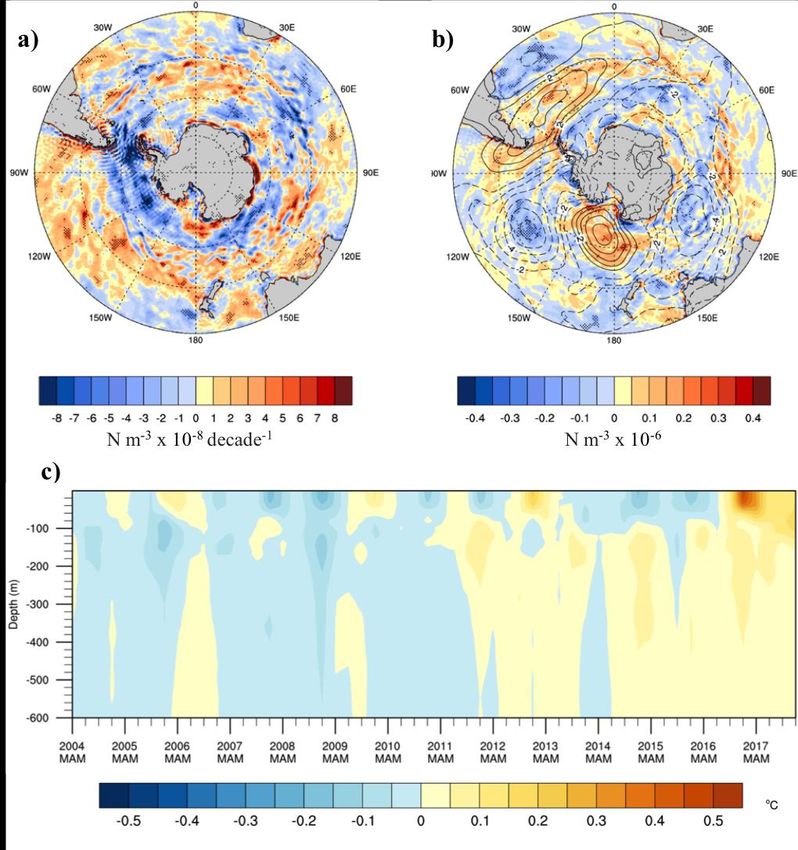
Expansion of Antarctic
 sea ice accelerated after
 2000 Sudden and
 rapid
 retreat of
 sea ice in
 late 2016
 sustained 2018 stayed well
 through below normal, and
 2019 so far last two months of
 2018 were lowest on
 record so far
 First two weeks of January, and
 SON 2016
 SON 2018 April - July 2019 were lowest on record
(ftp://sidads.colorado.edu/DATASETS/NOAA/G02135/)

 Cold upper Southern Ocean Warm upper Southern Ocean in 2016 https://seaice.uni-bremen.de/sea-ice-
 during sea ice expansion sustained through 2017 with sea ice retreat concentration/time-series/

200m 200m 200m

 600m 600m 600m

 (EN4 ocean reanalysis data)
In late 2016, there were a lot of record anomalies that could have
contributed
 Record high precipitation
 in eastern Indian/western
 Pacific

 SAM index went from positive
 to negative (weaker westerlies)
 Records in the (Schlosser et al 2017)
 http://www.nerc-
 bas.ac.uk/icd/gjma/sam.html
 2000s for SON: SAM negative Jan-Mar 2017; then positive
 April 2017-Feb 2018 with only Oct. 2017 and
 --OLR in E. Indian Mar 2018 negative
 --precip in E. Indian
 --negative DMI (Wang et al., 2019,
 --positive OLR-DMI Nat. Comms.)
 --negative SAM

 Record weak
 westerlies (easterly
 anomaly surface
 winds at 60-65S)
Fridtjof Nansen: Famous for reaching a record
 northern latitude of 86°14′ during his the Fram
 expedition of 1893–1896

 Noticed that ice bergs and sea ice moved in a
 direction to the right of the prevailing winds

Ekman transport, part of Ekman motion theory first investigated
in 1902 by Vagn Walfrid Ekman
As the wind blows it casts a friction force on the ocean surface that
drags the upper 10-100m of the water column with it. Due to the
influence of the Coriolis effect, the ocean water moves at a 90° angle
from the direction of the surface wind (to the right in the NH, to the left
in the SH)

Strong westerly winds over the southern Ocean push surface water to
the left, pulling up warmer subsurface water (“Ekman suction”)
2000-2014 trend of negative SON 2016 positive
wind stress curl anomalies and wind stress curl
northward Ekman transport anomalies and
from strong westerlies southward Ekman
(blue colors around transport from
 Antarctica) weak westerlies
 (orange colors near
 Antarctica)

Episodic movement
of warm subsurface SON 2016
 In SON 2016,
water upward in the entire zonal
water column 200m mean water
(zonal mean column in
temperature upper 600m
50-65S) had positive
 600m temperature
 anomalies
 Data through
 JJA 2019
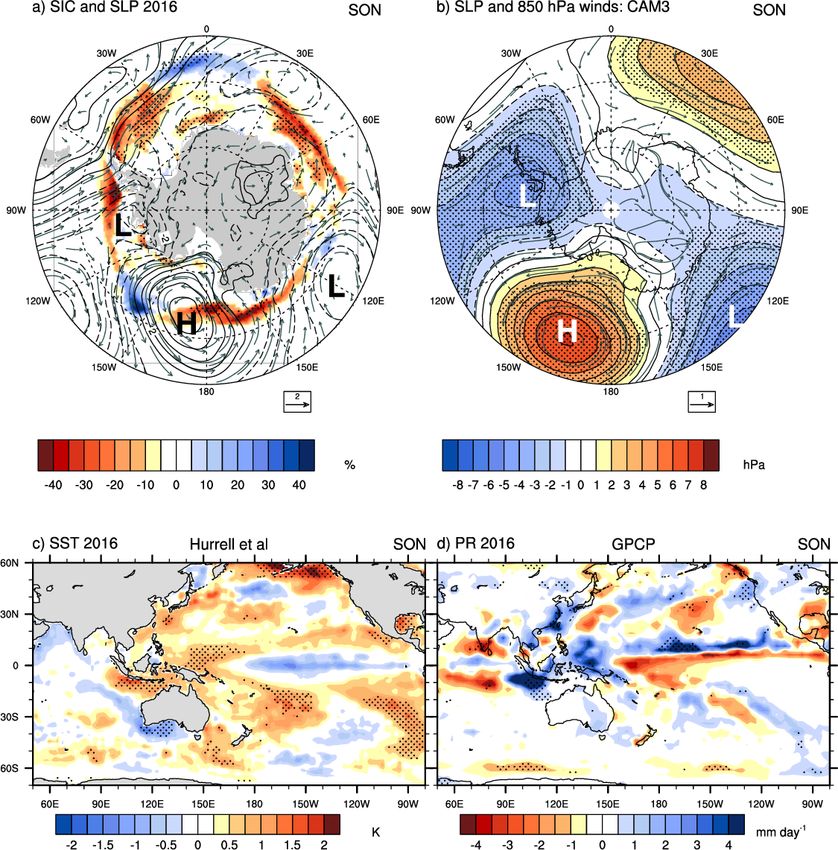
Evidence that mid- and high latitude teleconnections with southward surface
winds, which reduced sea ice extent, were driven from the tropics

 Eastern Indian/western
 Pacific 120E,Eq positive
 convective heating
 Observed SON
 anomaly experiment,
 2016 sea ice, SLP
 SON SLP and surface
 and surface wind
 wind anomalies
 anomalies

 Observed SON SST anomalies Observed SON precip anomalies
What could produce anomalously strong westerlies on the
decadal timescale?

Negative IPO (shown here regressed onto sea level pressure)
and positive SAM

Ekman transport to the left from strong westerlies slowly brings
warm subsurface water nearer the surface

 Anomalously strong westerlies on decadal timescale,
 northward Ekman transport of surface water; warm
 subsurface water move upward in column
What changed in 2015-2016?
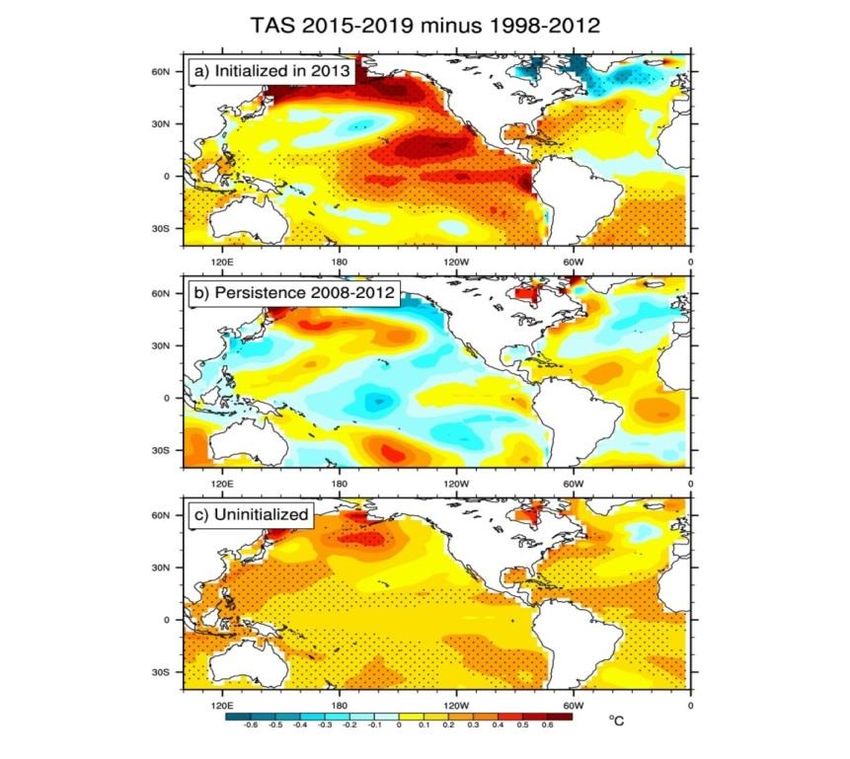
The IPO was Initialized prediction for
predicted to 2015-2019 average
transition
around 2016 (Meehl, G.A., A. Hu, and
 H. Teng, 2016, Nature
 Comms.)

 Observed for
 ~2015-2019 average
IPO transitioned to positive around
2015-2016 (Su et al., 2017, Sci. Rep.; Hu and
 Federov, 2017, GRL)
--Transition to positive IPO in 2015-2016 produced weak
westerlies around Antarctica

--Ekman transport to the right brings warm surface water south
to melt the ice; sustained due to decadal timescale of IPO

 Anomalously weak westerlies with positive IPO and positive
 SAM, warm southward Ekman transport connects to warm
 subsurface water that had been moving upward for a
 decade, entire upper ocean now warm
Summary (part 1)

1. Negative convective heating anomalies in the tropical Pacific
 from the negative phase of the IPO drove teleconnections and
 surface wind anomalies that contributed to the increasing
 Antarctic sea-ice extent from 2000-2014

2. Decadal timescale convective heating anomalies from the
tropics contributed to accelerated Arctic sea ice retreat in the
2000-2014 period (superimposed on long-term forcing from
increasing greenhouse gases); negative IPO in the Pacific in the
cold season, positive AMO in the Atlantic in the warm season
Summary (part 2)

3. What caused the sudden (and subsequently sustained) retreat of
Antarctic sea ice starting in late 2016?

-- culmination of a decadal trend of strong westerlies around Antarctica with
negative Interdecadal Pacific Oscillation that moved warmer water upward in
the column closer to the surface around Antarctica

--a transition to positive Interdecadal Pacific Oscillation around 2015-2016,
produced weaker westerlies and southward warm surface flow to complete
the warming the entire upper ocean

--the trigger: Anomalous mid- and high latitude southward surface winds
forced from the positive convective heating anomalies and record high SSTs
in the tropical eastern Indian/western Pacific, southward warm surface winds
and warmer water to the edge of the sea ice produced a warmer upper
ocean from the surface to 200m depth and a sudden retreat of sea ice
What would it take to move warmer subsurface water upward?
Surface wind stress forcing can produce vertical motion in the water column (upward is
“Ekman suction”):

 1
we = x τ∙

we ~ curl of the wind stress

wind stress curl trend near 60˚S for the 2000s about 1 x 10⁻⁷ N m-3 yr-1,

average change of we over the last decade is about 0.5 x 10⁻⁶ m sec-1.

-- about 15 m per year of upward vertical motion driven by the wind

about 150 m of upward vertical motion if applied over 10 years.
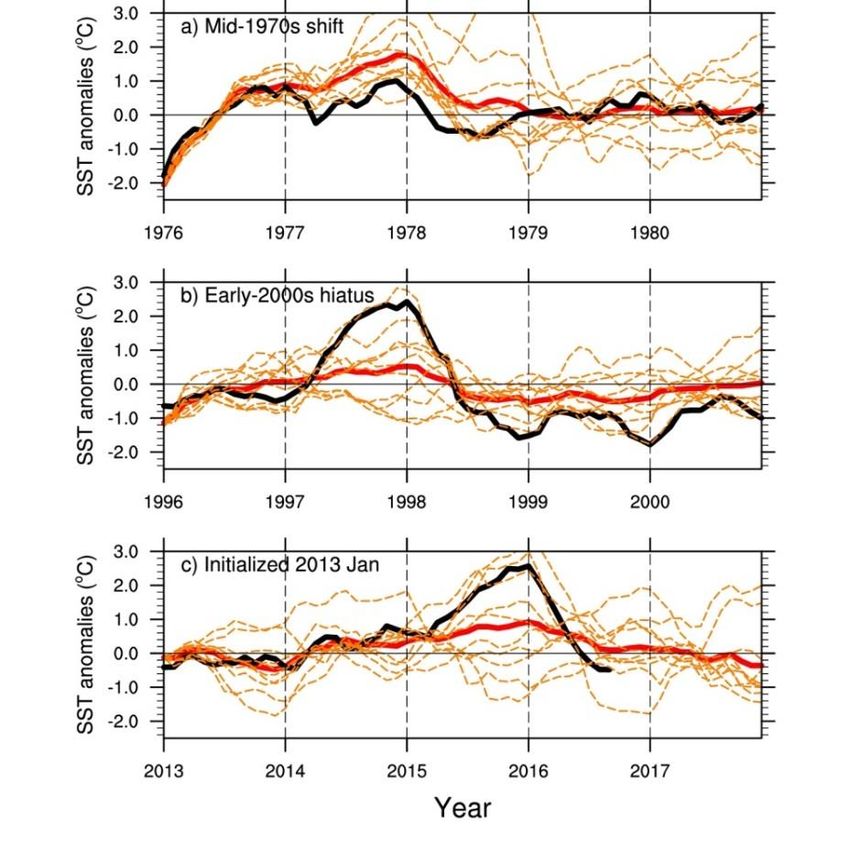
Niño3.4 Initialized prediction
 Observed
 Model initialized in 2013 predicted small
 Predicted ensemble average warming in 2014 followed by larger
 El Niño in 2015-2016

 Physical basis for prediction skill: Initialized
 hindcasts show model qualitatively captures
 ENSO evolution in eastern equatorial Pacific that
 triggers decadal timescale IPO transitions
 associated with off-equatorial western Pacific
 ocean heat content anomalies
 Prediction (initialized in 2013) for years 3-7 (2015-
 2019) shows transition to positive phase of the IPO
 different from persistence
 or uninitialized

 Predicted transition to positive IPO produces global
 temperature trend for 2013-2022 of
 +0.22±0.13°C/decade, nearly 3 times larger than
 2001-2014 trend of +0.08±0.05°C/decade during
 previous negative phase of IPO
 Predicted trend nearly 3 times larger
 than early 2000s (Meehl, G.A., A. Hu, and H. Teng, 2016, Nature Comms.)
In SON 2016, SSTs over
 Mixed
much over much of the layer
Southern Ocean warmed SST SON 2016 minus 2015 depth

and mixed layer depth
shallowed

(gridded Argo float data)
You can also read