Hotspots of Yield Loss for Four Crops of the Belt and Road Terrestrial Countries under 1.5 C Global Warming - MDPI
←
→
Page content transcription
If your browser does not render page correctly, please read the page content below
land
Article
Hotspots of Yield Loss for Four Crops of the Belt and Road
Terrestrial Countries under 1.5 ◦ C Global Warming
Miao Tong 1,2 , Erfu Dai 1,2, * and Chunsheng Wu 1,2

                                          1   Lhasa Plateau Ecosystem Research Station, Key Laboratory of Ecosystem Network Observation and
                                              Modeling, Institute of Geographic Sciences and Natural Resources Research, Chinese Academy of Sciences,
                                              Beijing 100101, China; tongm.17b@igsnrr.ac.cn (M.T.); wucs@igsnrr.ac.cn (C.W.)
                                          2   University of Chinese Academy of Sciences, Beijing 100049, China
                                          *   Correspondence: daief@igsnrr.ac.cn

                                          Abstract: The Fifth Assessment Report of the Intergovernmental Panel on Climate change (IPCC)
                                          shows that climate change poses severe risks to the Belt and Road region and could cut future crop
                                          production. Identifying the positions and features of hotspots, which refer to regions with severe yield
                                          loss at 1.5 ◦ C global warming, is the key to developing proper mitigation and adaptation policies to
                                          ensure regional food security. This study examined yield loss hotspots of four crops (maize, rice, soy-
                                          bean and wheat) at 1.5 ◦ C global warming under RCP8.5. Yield data were derived from simulations
                                          of multiple climate-crop model ensembles from the Inter-Sectoral Impact Model Intercomparison
                                          Project (ISI-MIP). Hotspots were identified by setting a threshold of the 10th percentile of crop yields
                                          during the reference period (1986–2005). To quantify the likelihood of crop yield loss hotspots within
                                          multi-model ensembles, the agreement of model combinations for hotspots was calculated for each
                                crop at the grid scale with 0.5◦ × 0.5◦ spatial resolution. Results revealed spatial heterogeneity of
                                   cultivation structure and hotspot likelihood for four crops. The four crops’ production of SA (South
Citation: Tong, M.; Dai, E.; Wu, C.       Asia) and SEA (Southeast Asia) accounts for more than 40% of the total production in the Belt and
Hotspots of Yield Loss for Four Crops
                                          Road region, roughly four times the amount produced in CEE (Central and Eastern Europe) and
of the Belt and Road Terrestrial
                                          NEA (Northeast Asia). Besides, the hotspots likelihood of maize, rice and soybean is generally larger
Countries under 1.5 ◦ C Global
                                          in SA/SEA than that in CEE/NEA which means the risk of yield reduction is higher in the current
Warming. Land 2022, 11, 163.
                                          main agricultural area. According to IPCC’s classification rules for likelihood, four crops’ hotspot
https://doi.org/10.3390/
land11020163
                                          patterns were displayed under the 1.5 ◦ C global warming. As the highest-yielding crop, maize
                                          shows the largest proportion of “likely” hotspots (hotspot likelihood > 66%), which is about 6.48%,
Academic Editors: Baojie He,
                                          accounting for more than four times that of the other three crops. In addition, four crops’ hotspots
Ayyoob Sharifi, Chi Feng and
                                          are mainly distributed in SEA and SA. Overall, SEA and SA are vulnerable subregions and maize is
Jun Yang
                                          the vulnerable crop of the Belt and Road region. Our results could provide information on target
Received: 26 December 2021                areas where mitigation or adaptations are needed to reduce the adverse influence of climate change
Accepted: 18 January 2022                 in the agricultural system.
Published: 20 January 2022

Publisher’s Note: MDPI stays neutral
                                          Keywords: the Belt and Road; global warming; 1.5 ◦ C; crops; yield; hotspots; likelihood; ISI-MIP
with regard to jurisdictional claims in
published maps and institutional affil-
iations.
                                          1. Introduction
                                               The Belt and Road is a global initiative led by the Chinese government to promote
                                          win-win international cooperation in the new era. Since 1951, the warming rate in the Belt
Copyright: © 2022 by the authors.
                                          and Road region is approximately 0.22 ◦ C per decade, nearly twice the global average [1].
Licensee MDPI, Basel, Switzerland.
                                          According to the fifth assessment report (AR5) of the Intergovernmental Panel on Climate
This article is an open access article
                                          change (IPCC), most regions along the Belt and Road would experience a significant
distributed under the terms and
                                          temperature increase by the end of the 21st century (2081–2100), which will be higher than
conditions of the Creative Commons
                                          the global average. In addition, World Bank’s statistics show that the total population of the
Attribution (CC BY) license (https://
creativecommons.org/licenses/by/
                                          Belt and Road terrestrial countries reached 4.7 billion in 2018, accounting for approximately
4.0/).
                                          62% of the total population of the world, despite over 40 Belt and Road countries having a

Land 2022, 11, 163. https://doi.org/10.3390/land11020163                                                        https://www.mdpi.com/journal/land
Land 2022, 11, 163                                                                                              2 of 12

                     per capita GDP less than $10,000 (current US dollars). Therefore, countries along the Belt
                     and Road would face a higher level of warming risk than the global average, especially for
                     those underdeveloped countries with large populations.
                           Agriculture is an important sector closely linked to human livelihoods. The World
                     Bank’s statistics on employment show that the agricultural sector has supported the income
                     of more than 1 billion people worldwide in 2019. However, the changing climate is
                     affecting global agricultural productivity and threatening food security [2–4] and will
                     therefore hamper the UN Sustainable Development Goals to end hunger [5]. To reduce the
                     adverse effects of warming, the goal set by the United Nations Framework Convention
                     on Climate Change (UNFCCC) emphasizes that the concentration of greenhouse gases
                     in the atmosphere should be stabilized at a level that guarantees secure food production.
                     The Paris Agreement also sets a target to limit global mean temperature to “well below
                     2 ◦ C” above pre-industrial levels and to pursue efforts to limit it to 1.5 ◦ C by the end of this
                     century, considering that 1.5 ◦ C warming would significantly reduce climate change risks.
                     Therefore, 1.5 ◦ C warming has become an important target for climate change studies.
                           Future populations will face a number of climate change-related effects, varying in
                     both intensities and locations. However, some ‘hotspots’ will be at greater risks than
                     others [6]. To promote efficient adaptations, it is crucial to identify and quantify these
                     hotspots and consider their uncertainties at the same time. Many climate-related hotspot
                     analyses are conducted through purely climatic metrics [7–9], with limited consideration
                     about the linkage between climate change and its social impacts. To move forward, some
                     researchers have conducted hotspots analysis covering several sectors, such as agriculture,
                     water, energy and so on [10,11] at a global scale. They have implemented a general analysis
                     for the agricultural hotspots by integrating multiple crops as a whole. But local stakeholders
                     usually need more detailed hotspot information for specific crop varieties when they are
                     making adaptive measures. Through a keyword search for the terms “yield AND hotspot
                     * AND Belt and Road” in the Web of Science, we find analysis on specific crops yield
                     loss hotspots for the Belt and Road region especially under 1.5 ◦ C global warming is
                     still missing.
                           To fill this gap, we evaluated yield loss hotspots of four main crops (maize, rice,
                     soybean and wheat) separately using the results of ISI-MIP multi-model ensembles in
                     the 65 terrestrial countries of the Belt and Road under 1.5 ◦ C global warming. We took
                     multiple ensembles because the median or average of model ensembles is thought to be
                     more accurate in simulating the crop temperature response compared with any single
                     mode [12–14]. Besides, it enables an uncertainty estimation for yield loss hotspots as well.
                     Before the hotspots analysis, it is also essential to have a basic knowledge of the historical
                     cultivation pattern of the study area. Thus, our research mainly aims to (1) clarify the
                     characteristics of the cropping structure and production levels of crops in the study area
                     in the past; and (2) explore the crop yield reduction hotspots in different subregions and
                     reveal the pattern of crop yield loss hotspots under 1.5 ◦ C global warming. These findings
                     can contribute to the awareness of severe yield loss risks of the four main crops and provide
                     reference to regional agricultural adaptations.

                     2. Materials & Methods
                     2.1. Study Area
                          The “Belt and Road” is the abbreviation of “the Silk Road Economic Belt” and “the
                     21st-Century Maritime Silk Road”. The study area is located primarily in Asia, Europe and
                     northern Africa and is characterized by complex and diverse environmental conditions. It
                     has a variety of climates, including tropical, arid, temperate, cold and polar climates, and
                     most of the region shows a warming trend [15]. In this paper, we considered 65 countries
                     under the Belt and Road Initiative and divided the study area into 7 subregions (Table 1)
                     according to the website of the Belt and Road Portal of China (https://www.yidaiyilu.gov.
                     cn/, accessed on 13 September 2021).
Land 2022, 11, 163                                                                                                        3 of 12

                          Table 1. Subregions of the Belt and Road countries.

         Subregions          Abbreviation                                          Detailed List
           China                  CH                  China
        Central Asia              CA                  Kazakhstan, Uzbekistan, Turkmenistan, Kyrgyzstan, Tajikistan
       Northeast Asia             NEA                 Mongolia, Russia
                                                      Vietnam, Laos, Cambodia, Thailand, Malaysia, Singapore, Indonesia,
       Southeast Asia             SEA
                                                      Brunei, Philippines, Myanmar, Timor-Leste
         South Asia                SA                 India, Pakistan, Bangladesh, Nepal, Bhutan, Sri Lanka, Maldives
                                                      Poland, Czech Republic, Slovakia, Hungary, Slovenia, Croatia,
    Central and Eastern                               Romania, Bulgaria, Serbia, Montenegro, Macedonia, Bosnia and
                                  CEE
          Europe                                      Herzegovina, Albania, Estonia, Lithuania, Latvia, Ukraine, Belarus,
                                                      Moldova
                                                      Turkey, Iran, Syria, Iraq, Afghanistan, United Arab Emirates, Saudi
   West Asia and North
                                 WAN                  Arabia, Qatar, Bahrain, Kuwait, Lebanon, Oman, Yemen, Jordan, Israel,
         Africa
                                                      Palestine, Armenia, Georgia, Azerbaijan, Egypt

                          2.2. Data Description
                                Four major crops were analyzed, including maize, rice, soybean and wheat. Their
                          yield (unit: t/ha) simulations with a resolution of 0.5◦ × 0.5◦ were provided by the Fast
                          Track of the Inter-Sectoral Impact Model Intercomparison Project (ISI-MIP, www.isimip.org,
                          accessed on 22 September 2021). The simulated crop yields were computed by seven
                          global gridded crop models (GGCM) (EPIC, GEPIC, GAEZ-IMAGE, LPJGUESS, LPJml,
                          PEGASUS, and pDSSAT). Each GGCM was forced with bias-corrected climatic data [16] of
                          five global climate models (GCM) (GFDL-ESM2M, HaDGem2-ES, IPSL-CM5A-LR, MIROC-
                          ESM-CHEM, and NorESM1-M) under four Representative Concentration Pathways (RCPs,
                          including RCP2.6, RCP4.5, RCP6.0, RCP8.5) from the Fifth Coupled Model Intercomparison
                          Project (CMIP5). In order to reveal hotspots of crop yield loss under a severe greenhouse
                          gas emission scenario, only simulations under RCP8.5 were considered. All GGCMs were
                          run for different parameter settings (with or without CO2 , with or without irrigation). As
                          a result, there are 116, 96, 116 and 116 model pairs available for maize, rice, soybean and
                          wheat, respectively.
                                This study contains two 20-year time slices, including the baseline period (1986–2005)
                          which is a commonly used reference period to derive warming level and assess climate
                          impacts [1,17], and the period when the global mean temperature will be 1.5 ◦ C higher
                          than pre-industrial levels under RCP8.5 (Table 2) [18]. In terms of the spatial range, the
                          cultivated area of four crops during the reference period (1986–2005) were derived from
                          MIRCA2000 data [19]. Due to data availability, the cultivated ranges were supposed to
                          be consistent in the future within ISI-MIP’s simulations. Therefore, each crop’s simulated
                          yield was then extracted by its historical cover, respectively.

                          Table 2. The respective 20-year time slices for 1.5 ◦ C global warming calculated by the ISI-MIP model
                          ensembles under RCP8.5 scenario [18].

                                                                                      Time Slices for a 1.5 ◦ C Global
                                                Name
                                                                                                Warming
                                           GFDL-ESM2M                                              2028–2047
                                           HaDGem2-ES                                              2010–2029
                                          IPSL-CM5A-LR                                             2016–2035
                                        MIROC-ESM-CHEM                                             2010–2029
                                            NorESM1-M                                              2022–2041

                          2.3. Research Methods
                               The climate hotspots could be a concept relevant to vulnerability, which can be defined
                          as a region being especially responsive to climate change and suffering pronounced im-
                          pacts [8,9]. In this study, we defined hotspots as regions with severe yield loss. To identify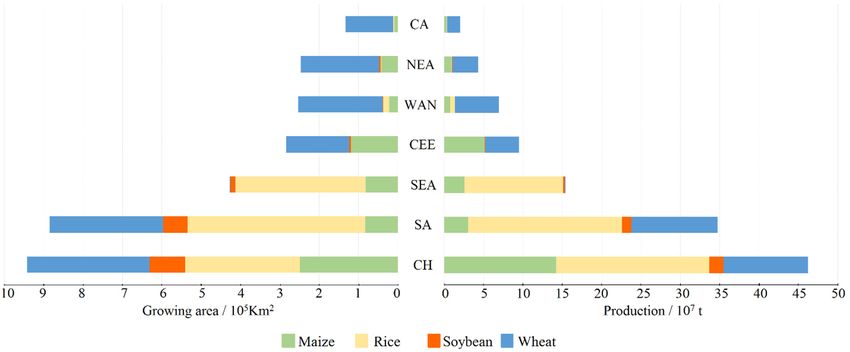
Land 2022, 11, x FOR PEER REVIEW 4 of 12
2.3. Research Methods
Land 2022, 11, 163 4 of 12
The climate hotspots could be a concept relevant to vulnerability, which can be de-
fined as a region being especially responsive to climate change and suffering pronounced
impacts [8,9]. In this study, we defined hotspots as regions with severe yield loss. To iden-
the
tifyyield loss hotspots
the yield of the of
loss hotspots Belt and
the Road
Belt andregion, we tookwe
Road region, thetook
yieldthe
of four
yieldmain crops
of four as
main
the index to recognize the adverse effects of global warming. Figure 1 shows the workflow
crops as the index to recognize the adverse effects of global warming. Figure 1 shows the
of this study.
workflow of this study.
Figure 1. The workflow of research methods.
Figure 1. The workflow of research methods.
Inline
In linewith
withPiontek
Pionteketetal.
al.[11],
[11],thethe10th
10thpercentage
percentagepointpointof ofyield
yielddistribution
distributionininthe
the
baseline period (1986–2005) was taken as the threshold to identify
baseline period (1986–2005) was taken as the threshold to identify each crop’s hotspots. each crop’s hotspots.
Thisthreshold
This thresholdmeansmeansaashift
shiftininaverage
averageconditions
conditionsintointowhat
whatisisconsidered
consideredmoderately
moderately
extreme, happening in about 10% of all historical years. Average conditions
extreme, happening in about 10% of all historical years. Average conditions are measured are measured
as each crop’s yield median over the 20-year time slices for 1.5 ◦°C warming
as each crop’s yield median over the 20-year time slices for 1.5 C warming under RCP8.5. under RCP8.5.
Moreover,multi-model
Moreover, multi-modelsimulations
simulationsalso alsoenable
enablean anassessment
assessmentofoflikelihood.
likelihood.The
Themodel
model
agreement of
agreement of hotspots
hotspots at at each
each grid
grid can
canindicate
indicatehowhowlarge
largethethelikelihood
likelihood ofof
hotspots
hotspots is by
is
dividing
by dividingthethe
number
number of models
of models indicating
indicatinghotspots by the
hotspots by total number
the total of models.
number And
of models.
according
And to IPCC
according AR5,AR5,
to IPCC the the
likelihood
likelihood can can
be described
be describedquantitatively
quantitativelythrough the the
through fol-
lowing terms: likely, 66~100%; about as likely as not, 33~66%; unlikely,
following terms: likely, 66~100%; about as likely as not, 33~66%; unlikely, 0~33%. Thus, 0~33%. Thus, three
classes
three of hotspots
classes werewere
of hotspots divided.
divided.
3. Results
3.1. Cultivation Structure and Crop Production of Different Subregions
Figure 2 shows four crops’ cultivated area and past productions in each subregions
of the study area. The total planted area for CH and SA were the largest, being around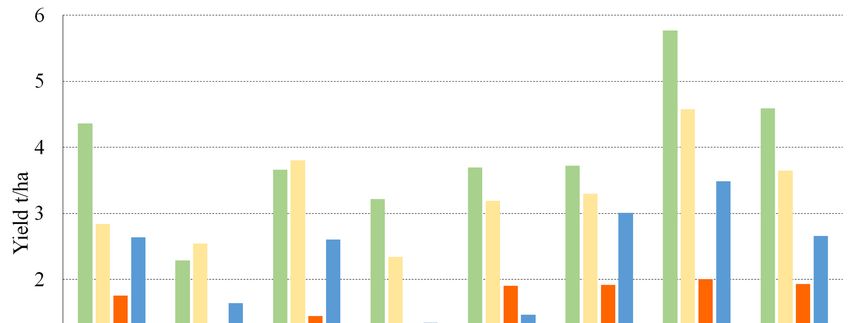
Land 2022, 11, x FOR PEER REVIEW 5 of 12
3. Results
Land 2022, 11, 163 3.1. Cultivation Structure and Crop Production of Different Subregions 5 of 12
Figure 2 shows four crops’ cultivated area and past productions in each subregions
of the study area. The total planted area for CH and SA were the largest, being around 9
9× × 5 km 2 . However, CA’s total planted area was the smallest, being no more than 15%
1010
5 km 2. However, CA’s total planted area was the smallest, being no more than 15% of
of CH’s.
CH’s. Besides,
Besides, thethe ratio
ratio of planted
of planted areaarea
for for
fourfour crops
crops varied
varied among
among subregions.
subregions. For
For CH,
CH, the proportions
the proportions of planted
of planted area
area forfor wheat,
wheat, rice
rice andmaize
and maizewere
werearound
around 30%,30%, while thethe
ration was around 10% for
ration was around 10% for soybean. soybean. In SA, rice and wheat were the major crops with
the major crops with the the
total
total proportion
proportionbeing beingover
over80%80% of
of planting
planting area.
area. The
The major
major crop
crop of
of SEA
SEA waswas rice,
rice, covering
covering
about
about three-quarters of the total planted area. CEE was almost occupied by wheat
three-quarters of the total planted area. CEE was almost occupied by wheat andand
maize
maize with
with little
little soybean.
soybean. As As for
for the
the last
last three
three subregions
subregions (WAN,
(WAN, NEANEA and and CA),
CA), wheat
wheat
was
was the
the dominant
dominant crop crop and
and the
the proportion
proportion of of which
which was
was above
above 80%
80% ofof the
the total
total cultivated
cultivated
area.
area. The ranking of total crop productions in different subregions is consistent with
The ranking of total crop productions in different subregions is consistent with the
the
ranking of the total cropped area. CH had the highest crop production
ranking of the total cropped area. CH had the highest crop production (accounting (accounting for over
for
38%
overof theofstudy
38% area’sarea’s
the study total total
production), followed
production), by SAbyand
followed SASEA (taking
and SEA aboutabout
(taking 29% 29%
and
13%
and of
13%total
of production, respectively).
total7 production, In contrast,
respectively). CA showed
In contrast, the lowest
CA showed crop production
the lowest crop pro-
(about 1.99 × 10 t), less than 2% of the total production in the study
duction (about 1.99 × 10⁷ t), less than 2% of the total production in the study area. area.
Figure 2.
Figure 2. Cultivated
Cultivated areas
areas and
and production
production for
for maize,
maize, rice,
rice, soybean,
soybean, and
and wheat
wheat of
of subregions
subregions in
in the
the
Belt and Road during the reference period (1986–2005).
Belt and Road during the reference period (1986–2005).
3.2. Crops Yield
3.2. Yield Analysis
Analysis of
of Different
Different Subregions
Subregions
Figure33presents
Figure presentsthe themean
mean yield
yield of of maize,
maize, rice,
rice, soybean
soybean andandwheatwheat in seven
in seven subre-
subregions
of the Belt
gions and
of the Road
Belt andduring the reference
Road during period period
the reference (1986–2005), indicating
(1986–2005), that crop
indicating thatyields
crop
vary
yieldsacross crop types
vary across cropand subregions.
types For theFor
and subregions. whole regionregion
the whole of the ofBelt
theandBeltRoad (BR),
and Road
the yields
(BR), of the of
the yields four
thecrops, in descending
four crops, order, were
in descending order,4.58
weret/ha (maize),
4.58 3.64 t/ha
t/ha (maize), 3.64(rice),
t/ha
2.66 t/ha
(rice), 2.66(wheat) and 1.92
t/ha (wheat) andt/ha (soybeans).
1.92 t/ha For For
(soybeans). most subregions,
most subregions, the the
average
average yield of
yield
maize
of maizewas thethe
was highest while
highest whilethe yield
the yieldofofsoybean
soybeanwaswasthe
thelowest.
lowest.Besides,
Besides,therethere are
are also
also
variations
variations inin crop
crop yields
yields among
among different
different subregions.
subregions. For example,
example, the average
average yieldyield ofof
the four crops in CH was higher than that of BR, whereas the crops
the four crops in CH was higher than that of BR, whereas the crops yield of NEA, WAN yield of NEA, WAN
and
and CA
CA were
were lower
lower than
than BR’s
BR’s averages.
averages. AsAs for
for CEE,
CEE, the
the mean
mean yield
yield of
of maize,
maize, soybean
soybean and and
wheat
wheat is similar to that of BR. However, its rice yield was slightly low, being smaller than
is similar to that of BR. However, its rice yield was slightly low, being smaller than
BR’s
BR’s average
average value.
value. For
For SEA
SEA and
and SA,
SA, the
the yield
yield of
of maize,
maize, rice
rice and
and soybean
soybean were were very
very close
close
to each other. However, the wheat yield in SA was almost twice as high
to each other. However, the wheat yield in SA was almost twice as high as that in SEA. as that in SEA.
Therefore, CH, SA and SA are the main crop production area of the Belt and Road
region, with the production of four crops accounting for more than 80% of the total pro-
duction of the Belt and Road region. And the yield of maize is the highest among the four
crops in BR as well as in most subregions.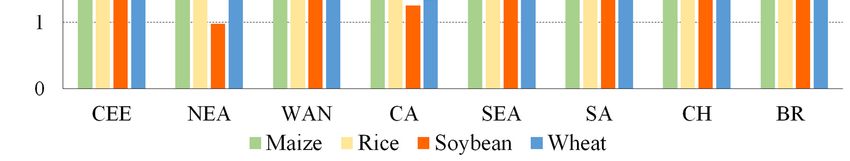
Land
Land2022,
2022,11,
11,x163
FOR PEER REVIEW 6 6ofof12
12
Figure
Figure3.3. The
Themean
meanyield
yieldfor
formaize,
maize,rice,
rice,soybean,
soybean,and
andwheat
wheatof
ofsubregions
subregionsin
inthe
theBelt
Beltand
andRoad
Road
during the reference period (1986–2005).
during the reference period (1986–2005).
3.3. Characteristics
Therefore, CH,ofSA Hotspots
and SALikelihood
are the in Different
main crop Subregions
production area of the Belt and Road
region, with 4the
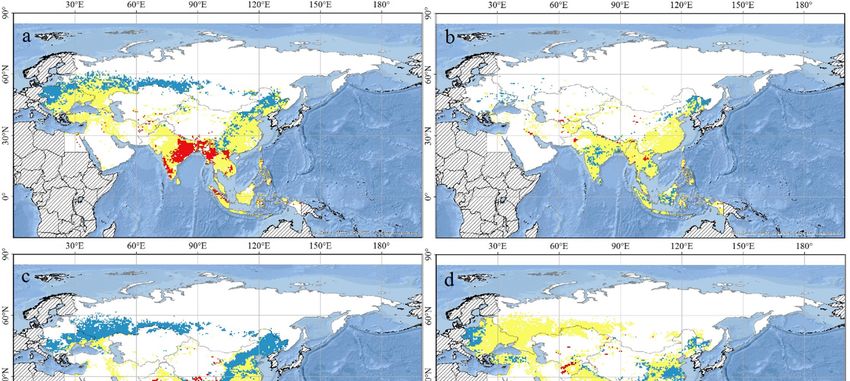
Figure production
displays of four crops
the distribution ofaccounting for morefor
hotspot likelihood than 80%
four of the
crops total pro-
in seven sub-
duction
regionsof ofthe
theBelt
Beltand
andRoad
Roadregion. ◦ C global
for 1.5And the yield of maize
warming is theRCP8.5.
under highest among
There isthe four
a large
deviation
crops in BRinasthewellhotspot likelihood
as in most for each crop in almost every subregion, indicating
subregions.
great variation in hotspot likelihood within subregions. For maize, rice and soybean, the
3.3. Characteristics
median of HotspotsisLikelihood
hotspot likelihood relativelyinlow
Different
in CEESubregions
and NEA compared with other subre-
gions. However, NEA shows a high level of median
Figure 4 displays the distribution of hotspot likelihood hotspotforlikelihood
four crops (>50%)
in sevenforsubre-
wheat,
although with a high latitudinal location. Unlike CEE and NEA, SA and
gions of the Belt and Road for 1.5 °C global warming under RCP8.5. There is a large devi- SEA located at
low latitudes
ation usually
in the hotspot have a high
likelihood level crop
for each of hotspot likelihood,
in almost being around
every subregion, 50% orgreat
indicating even
more than 60% for maize, soybean and wheat. For WAN and CA, where
variation in hotspot likelihood within subregions. For maize, rice and soybean, the me- wheat is the major
crop,hotspot
dian the median hotspotislikelihood
likelihood relativelyoflow
wheat is higher
in CEE and than
NEA50% for CA, with
compared a little higher
other than
subre-
that of WAN. As for CH, its median hotspot likelihood for four crops
gions. However, NEA shows a high level of median hotspot likelihood (>50%) for wheat,is at a moderate level,
ranging from
although with 30% to 40%.
a high latitudinal location. Unlike CEE and NEA, SA and SEA located at
The difference in likelihood among subregions is consistent with previous studies
low latitudes usually have a high level of hotspot likelihood, being around 50% or even
saying that tropical regions at lower latitudes experienced a greater magnitude of impact
more than 60% for maize, soybean and wheat. For WAN and CA, where wheat is the
and likelihood of reduced crop yields than temperate regions [3,12]. The tropical area’s
major crop, the median hotspot likelihood of wheat is higher than 50% for CA, a little
temperature is very close to the threshold suitable for grain growth, so the temperature
higher than that of WAN. As for CH, its median hotspot likelihood for four crops is at a
rising by 1–2 ◦ C will adversely affect grain yields [20–22]. As for the high hotspot likelihood
moderate level, ranging from 30% to 40%.
of wheat in NEA, it could be reasonable due to the increase of extremely high temperature,
aridity in these regions under global warming [23,24].Land 2022, 11,
Land 2022, 11, 163
x FOR PEER REVIEW 77 of
of 12
Figure 4.
Figure 4. Box
Boxplot
plotdistribution
distributionofofhotspot
hotspotlikelihood forfor
likelihood maize (a),(a),
maize ricerice
(b),(b),
soy soy
(c), wheat (d) at(d)
(c), wheat sub-
at
regions of the Belt and Road for 1.5 °C global
◦ warming under RCP8.5. “+” indicates abnormal val-
subregions of the Belt and Road for 1.5 C global warming under RCP8.5. “+” indicates abnormal
ues.
values.
The difference
3.4. Hotspots Patternsinof likelihood
Four Crops among subregions
for 65 Countries of theisBelt
consistent
and Roadwith previous studies
saying that tropical regions at lower latitudes experienced a greater magnitude of impact
As shown in Figure 5, regions being “likely” or “about as likely as not” or “unlikely”
and likelihood of reduced crop yields than temperate regions [3,12]. The tropical area’s
to become hotspots are identified for four crops under 1.5 ◦ C global warming (considering
temperature
RCP8.5), and is very
their close to the
proportions arethreshold
displayedsuitable
in Tablefor
3. grain growth,
For maize, so“likely”
these the temperature
hotspots
rising by 1–2 °C will adversely affect grain yields [20–22]. As for the
account for around 6.48% of the total maize growing area in the baseline period, high hotspotmainly
likeli-
hood of wheat in NEA, it could be reasonable due to the increase of extremely
located in SA and SEA. While for the other three crops, the proportions of the “likely” high tem-
perature, aridity in these regions under global warming [23,24].
hotspots are 1.51%, 0.11% and 0.69% for rice, soybean and wheat, respectively, scattered in
mid-to-low-latitudes. As for “unlikely” hotspots, their proportions of historical cultivated
3.4. Hotspots
area Patterns
range from of Four
12.29% Crops for
to 35.23%, 65 the
with Countries of the
smallest Beltfor
value andrice
Road
and the biggest for soy.
These are mainly distributed in CEE, NEA and some parts of CH. The as
As shown in Figure 5, regions being “likely” or “about as likely not”
last orof
kind “unlikely”
hotspots,
to become
“about hotspots
as likely are identified
as not”, for fourpercentage
takes the largest crops underof1.5 °C global
these crops’ warming (considering
growing area, and the
RCP8.5), and
proportion their proportions are displayed in Table 3. For maize, these “likely” hotspots
is 64.66~86.20%.
account for around 6.48% of the total maize growing area in the baseline period, mainly
located in SA and SEA. While for the other three crops, the proportions of the “likely”
hotspots are 1.51%, 0.11% and 0.69% for rice, soybean and wheat, respectively, scattered
in mid-to-low-latitudes. As for “unlikely” hotspots, their proportions of historical culti-
vated area range from 12.29% to 35.23%, with the smallest value for rice and the biggest
for soy. These are mainly distributed in CEE, NEA and some parts of CH. The last kind of
hotspots, “about as likely as not”, takes the largest percentage of these crops’ growing
area, and the proportion is 64.66~86.20%.Land 2022, 11,
Land 2022, 11, 163
x FOR PEER REVIEW 88 of
of 12
12
Figure 5.
Figure 5. The
The spatial
spatial distribution
distribution of
of maize
maize (a),
(a), rice
rice (b),
(b), soybean
soybean (c),
(c), and
and wheat
wheat (d)
(d) hotspots
hotspots in
in the
the
Belt and Road for 1.5 ◦°C global warming under RCP8.5. The hotspots are divided into three classes
Belt and Road for 1.5 C global warming under RCP8.5. The hotspots are divided into three classes
according to the magnitude of likelihood: >66% “likely”, 33~66% “about as likely as not”, 66% “likely”, 33~66% “about as likely as not”,Land 2022, 11, 163 9 of 12
yields of crops [27,28]. However, elevated CO2 concentration shows a beneficial impact
on C3 crops (i.e., wheat, rice, and soybean). As a C4 plant, maize gains less benefit from
the increased CO2 concentration than C3 plants because its photosynthetic pathway is
unresponsive to elevated CO2 [29,30]. As a result, the CO2 fertilization effect cannot offset
adverse climate impacts on the maize yield [31]. Therefore, maize in the Belt and Road
region is more likely to experience yield reduction under 1.5 ◦ C global warming than the
other three C3 crops. The likelihood of yield loss hotspots varies across subregions. For
instance, the hotspot likelihood of crops is greater in SA and SEA, whereas it is smaller in
CEE and NEA. This is because subregions in the tropical environments, which are already
characterized by high temperature and variable rainfall conditions, are more likely to have
yield loss under a warming scenario unless adaptation measures are taken. This is in line
with previous reports indicating that climate impacts on tropical croplands are generally
more negative than the mid- and high-latitude impacts [22,32,33]. Our analysis confirmed
past studies and will also help inform more details about the locations of these vulnerable
sites by identifying hotspots of crops.
In order to maintain economically acceptable yields under the future climate in the
study area, adaptations of crops to future warmer conditions are required, especially for
tropical subregions. Passive effects of warming can partly be compensated through opti-
mizing sowing date and switching variety [28]. The growth rate of crops will decrease by
sowing earlier in the season when temperatures are cooler, which allows more time for grain
filling and would therefore be expected to increase yield [34,35]. Another possible adapta-
tion under warming conditions would be switching to improved high-temperature-tolerant
varieties [36]. Considering drought and heat stress levels in the tropical environment, incor-
porating drought and heat tolerance into maize germplasm also has the potential to offset
predicted yield loss and sustain maize productivity under climate change in vulnerable
sites [37].
Our study still involved some limitations. Firstly, due to data limitations, our estimates
did not consider the variations in crops’ cultivated area, for example, the expansion of crop
area in some cooler places. However, we focus on the hotspots of crop yield loss, namely the
adverse outcome of increased temperature on crop yield. Therefore, the expansion of the
grown area, a favorable effect of warming is beyond the study scope. In addition, our results
on hotspots may be overly pessimistic because they did not include agricultural adaptations
as mentioned above. On the other hand, these crop models can not explicitly simulate the
effects of extreme events, which have significant impacts on final crop yields [38–40]. Thus,
the assessment results based on yield predictions of ISI-MIP may underestimate the impact
of extreme weather events on crop yields [26,41]. These limitations indicate the scope and
need for future studies on the impacts of changing crop cultivation, extreme climate events
and potential adaptations.
5. Conclusions
Using the multi-model simulated results of crop yields provided by ISI-MIP, this
article explored the features of cultivation, crop hotspots and the patterns of four crops in
65 countries of the Belt and Road under 1.5 ◦ C global warming by a threshold of historical
yield distribution and model agreement of multi-model ensembles. The major conclusions
of the study include:
The analysis shows the spatial heterogeneity of crops’ cultivation structure and
hotspots likelihood for four crops. For maize, rice and soybean, the value of hotspots
likelihood is generally smaller in mid-to-high-latitude regions like CEE and NEA than that
in low-latitude parts such as SA and SEA. However, except for the low latitudinal region,
NEA with a high latitudinal location also shows a high level of median hotspot likelihood
(>50%) for wheat.
The results also reveal hotspot patterns of four crops under 1.5 ◦ C global warming
considering RCP8.5. The proportion of “likely” hotspots for maize is about 6.5%, being at
least four times larger than that of the other three crops. These “likely” hotspots are mainlyLand 2022, 11, 163 10 of 12
situated in SEA and SA, while the “unlikely” hotspots are mainly distributed in CEE and
NEA (except for wheat).
SA and SEA are the main crop producing area of the Belt and Road region and the
majority of people here still rely on agriculture for their livelihoods. However, these
subregions will remain vulnerable to climate warming for the foreseeable future. Maize, as
the most productive crop, will also be exposed to the largest extent of hotspots than other
crops. Our research reveals the yield reduction hotspots of four crops and indicates that
the warming climate will continue reshaping the production pattern of agriculture in the
Belt and Road region unless adaptations are taken.
Author Contributions: Conceptualization, M.T. and E.D.; Data curation, M.T.; Formal analysis, M.T.,
E.D. and C.W.; Funding acquisition, E.D.; Methodology, M.T., E.D. and C.W.; Project administration,
E.D.; Software, M.T.; Supervision, E.D.; Visualization, M.T. and C.W.; Writing—original draft, M.T.;
Writing—review & editing, M.T., E.D. and C.W. All authors have read and agreed to the published
version of the manuscript.
Funding: This research was funded by the Strategic Priority Research Program of Chinese Academy
of Sciences (No. XDA20020202, No. XDA19040300) and the National Key R & D Program of China
(No. 2020YFA0608200, No. 2018YFC1508805). The APC was funded by the Strategic Priority Research
Program of Chinese Academy of Sciences (No. XDA20020202).
Institutional Review Board Statement: Not applicable.
Informed Consent Statement: Not applicable.
Data Availability Statement: The simulated yield data is available at the website of the Inter-
Sectoral Impact Model Intercomparison Project (https://www.isimip.org/impactmodels/, accessed
on 22 September 2021) and can be accessed by registering at the website. The MIRCA2000 data,
including Annual harvested area grids and Maximum Monthly Growing Area Grids is available at
https://www.uni-frankfurt.de/45218031/data_download (accessed on 15 October 2021).
Conflicts of Interest: The authors declare no conflict of interest.
References
1. IPCC. Climate Change 2014: Synthesis Report; Cambridge University Press: Cambridge, UK, 2014.
2. Zhao, C.; Liu, B.; Piao, S.L.; Wang, X.H.; Lobell, D.B.; Huang, Y.; Huang, M.T.; Yao, Y.T.; Bassu, S.; Ciais, P.; et al. Temperature
increase reduces global yields of major crops in four independent estimates. Proc. Natl. Acad. Sci. USA 2017, 114, 9326–9331.
[CrossRef]
3. Challinor, A.J.; Watson, J.; Lobell, D.B.; Howden, S.M.; Smith, D.R.; Chhetri, N. A meta-analysis of crop yield under climate
change and adaptation. Nature Clim. Chang. 2014, 4, 287–291. [CrossRef]
4. Lobell, D.B.; Schlenker, W.; Costa-Roberts, J. Climate Trends and Global Crop Production Since 1980. Science 2011, 333, 616–620.
[CrossRef]
5. FAO. The State of Food Security and Nutrition in the World 2018; FAO: Rome, Italy, 2018.
6. de Sherbinin, A. Climate change hotspots mapping: What have we learned? Clim. Chang. 2014, 123, 23–37. [CrossRef]
7. Fan, X.; Miao, C.; Duan, Q.; Shen, C.; Wu, Y. Future Climate Change Hotspots Under Different 21st Century Warming Scenarios.
Earths Future 2021, 9, e2021EF002027. [CrossRef]
8. Diffenbaugh, N.S.; Giorgi, F. Climate change hotspots in the CMIP5 global climate model ensemble. Clim. Chang. 2012, 114,
813–822. [CrossRef]
9. Giorgi, F. Climate change hot-spots. Geophys. Res. Lett. 2006, 33, 1–4. [CrossRef]
10. Byers, E.; Gidden, M.; Leclere, D.; Balkovic, J.; Burek, P.; Ebi, K.; Greve, P.; Grey, D.; Havlik, P.; Hillers, A.; et al. Global exposure
and vulnerability to multi-sector development and climate change hotspots. Environ. Res. Lett. 2018, 13, 055012. [CrossRef]
11. Piontek, F.; Muller, C.; Pugh, T.A.M.; Clark, D.B.; Deryng, D.; Elliott, J.; Gonzalez, F.D.C.; Florke, M.; Folberth, C.; Franssen,
W.; et al. Multisectoral climate impact hotspots in a warming world. Proc. Natl. Acad. Sci. USA 2014, 111, 3233–3238. [CrossRef]
12. Asseng, S.; Ewert, F.; Martre, P.; Roetter, R.P.; Lobell, D.B.; Cammarano, D.; Kimball, B.A.; Ottman, M.J.; Wall, G.W.; White,
J.W.; et al. Rising temperatures reduce global wheat production. Nat. Clim. Chang. 2015, 5, 143–147. [CrossRef]
13. Li, T.; Hasegawa, T.; Yin, X.; Zhu, Y.; Boote, K.; Adam, M.; Bregaglio, S.; Buis, S.; Confalonieri, R.; Fumoto, T.; et al. Uncertainties
in predicting rice yield by current crop models under a wide range of climatic conditions. Glob. Chang. Biol. 2015, 21, 1328–1341.
[CrossRef]Land 2022, 11, 163 11 of 12
14. Wallach, D.; Martre, P.; Liu, B.; Asseng, S.; Ewert, F.; Thorburn, P.J.; van Ittersum, M.; Aggarwal, P.K.; Ahmed, M.; Basso, B.; et al.
Multimodel ensembles improve predictions of crop-environment-management interactions. Glob. Chang. Biol. 2018, 24, 5072–5083.
[CrossRef]
15. Wu, S.; Liu, L.; Liu, Y.; Gao, J.; Dai, E.; Feng, A.; Wang, W. The Belt and Road: Geographical pattern and regional risks. J. Geogr.
Sci. 2019, 29, 483–495. [CrossRef]
16. Hempel, S.; Frieler, K.; Warszawski, L.; Schewe, J.; Piontek, F. A trend-preserving bias correction-the ISI-MIP approach. Earth Syst.
Dyn. 2013, 4, 219–236. [CrossRef]
17. IPCC. Global Warming of 1.5 ◦ C; Cambridge University Press: Cambridge, UK, 2018.
18. Schleussner, C.-F.; Lissner, T.K.; Fischer, E.M.; Wohland, J.; Perrette, M.; Golly, A.; Rogelj, J.; Childers, K.; Schewe, J.; Frieler,
K.; et al. Differential climate impacts for policy-relevant limits to global warming: The case of 1.5 degrees C and 2 degrees C.
Earth Syst. Dyn. 2016, 7, 327–351. [CrossRef]
19. Portmann, F.T.; Siebert, S.; Doell, P. MIRCA2000-Global monthly irrigated and rainfed crop areas around the year 2000: A new
high-resolution data set for agricultural and hydrological modeling. Glob. Biogeochem. Cycles 2010, 24, 24. [CrossRef]
20. Hatfield, J.L.; Boote, K.J.; Kimball, B.A.; Ziska, L.H.; Izaurralde, R.C.; Ort, D.; Thomson, A.M.; Wolfe, D. Climate Impacts on
Agriculture: Implications for Crop Production. Agron. J. 2011, 103, 351–370. [CrossRef]
21. Gornall, J.; Betts, R.; Burke, E.; Clark, R.; Camp, J.; Willett, K.; Wiltshire, A. Implications of climate change for agricultural
productivity in the early twenty-first century. Philos. Trans. R. Soc. B Biol. Sci. 2010, 365, 2973–2989. [CrossRef]
22. Pranuthi, G.; Tripathi, S.K. Assessing the climate change and its impact on rice yields of Haridwar district using PRECIS RCM
data. Clim. Chang. 2018, 148, 265–278. [CrossRef]
23. Moore, F.C.; Lobell, D.B. The fingerprint of climate trends on European crop yields. Proc. Natl. Acad. Sci. USA 2015, 112,
2670–2675. [CrossRef]
24. Pavlova, V.; Shkolnik, I.; Pikaleva, A.; Efimov, S.; Karachenkova, A.; Kattsov, V. Future changes in spring wheat yield in the
European Russia as inferred from a large ensemble of high-resolution climate projections. Environ. Res. Lett. 2019, 14, 034010.
[CrossRef]
25. Long, S.P.; Ainsworth, E.A.; Leakey, A.D.B.; Nosberger, J.; Ort, D.R. Food for thought: Lower-than-expected crop yield stimulation
with rising CO2 concentrations. Science 2006, 312, 1918–1921. [CrossRef] [PubMed]
26. Jin, Z.; Zhuang, Q.L.; Wang, J.L.; Archontoulis, S.V.; Zobel, Z.; Kotamarthi, V.R. The combined and separate impacts of climate
extremes on the current and future US rainfed maize and soybean production under elevated CO2 . Glob. Chang. Biol. 2017, 23,
2687–2704. [CrossRef]
27. Lizaso, J.I.; Ruiz-Rarnos, M.; Rodriguez, L.; Gabaldon-Leal, C.; Oliveira, J.A.; Lorite, I.J.; Sanchez, D.; Garcia, E.; Rodriguez, A.
Impact of high temperatures in maize: Phenology and yield components. Field Crops Res. 2018, 216, 129–140. [CrossRef]
28. Rose, G.; Osborne, T.; Greatrex, H.; Wheeler, T. Impact of progressive global warming on the global-scale yield of maize and
soybean. Clim. Chang. 2016, 134, 417–428. [CrossRef]
29. Amouzou, K.A.; Lamers, J.P.A.; Naab, J.B.; Borgemeister, C.; Vlek, P.L.G.; Becker, M. Climate change impact on water- and
nitrogen-use efficiencies and yields of maize and sorghum in the northern Benin dry savanna, West Africa. Field Crops Res. 2019,
235, 104–117. [CrossRef]
30. Tigchelaar, M.; Battisti, D.S.; Naylor, R.L.; Ray, D.K. Future warming increases probability of globally synchronized maize
production shocks. Proc. Natl. Acad. Sci. USA 2018, 115, 6644–6649. [CrossRef] [PubMed]
31. Yang, C.Y.; Fraga, H.; Van Ieperen, W.; Santos, J.A. Assessment of irrigated maize yield response to climate change scenarios in
Portugal. Agric. Water Manag. 2017, 184, 178–190. [CrossRef]
32. Rosenzweig, C.; Elliott, J.; Deryng, D.; Ruane, A.C.; Muller, C.; Arneth, A.; Boote, K.J.; Folberth, C.; Glotter, M.; Khabarov, N.; et al.
Assessing agricultural risks of climate change in the 21st century in a global gridded crop model intercomparison. Proc. Natl.
Acad. Sci. USA 2014, 111, 3268–3273. [CrossRef] [PubMed]
33. Tesfaye, K.; Zaidi, P.H.; Gbegbelegbe, S.; Boeber, C.; Rahut, D.B.; Getaneh, F.; Seetharam, K.; Erenstein, O.; Stirling, C. Climate
change impacts and potential benefits of heat-tolerant maize in South Asia. Theor. Appl. Climatol. 2017, 130, 959–970. [CrossRef]
34. Huang, M.X.; Wang, J.; Wang, B.; Liu, D.L.; Yu, Q.; He, D.; Wang, N.; Pan, X.B. Optimizing sowing window and cultivar choice can
boost China’s maize yield under 1.5 degrees C and 2 degrees C global warming. Environ. Res. Lett. 2020, 15, 024015. [CrossRef]
35. Craufurd, P.Q.; Wheeler, T.R. Climate change and the flowering time of annual crops. J. Exp. Bot. 2009, 60, 2529–2539. [CrossRef]
[PubMed]
36. Zhang, L.L.; Zhang, Z.; Chen, Y.; Wei, X.; Song, X. Exposure, vulnerability, and adaptation of major maize-growing areas to
extreme temperature. Nat. Hazards 2018, 91, 1257–1272. [CrossRef]
37. Tesfaye, K.; Kruseman, G.; Cairns, J.E.; Zaman-Allah, M.; Wegary, D.; Zaidi, P.H.; Boote, K.J.; Rahut, D.; Erenstein, O. Potential
benefits of drought and heat tolerance for adapting maize to climate change in tropical environments. Clim. Risk Manag. 2018, 19,
106–119. [CrossRef]
38. Lobell, D.B.; Sibley, A.; Ortiz-Monasterio, J.I. Extreme heat effects on wheat senescence in India. Nat. Clim. Chang. 2012, 2,
186–189. [CrossRef]
39. Lesk, C.; Rowhani, P.; Ramankutty, N. Influence of extreme weather disasters on global crop production. Nature 2016, 529, 84–87.
[CrossRef]Land 2022, 11, 163 12 of 12
40. Vogel, E.; Donat, M.G.; Alexander, L.V.; Meinshausen, M.; Ray, D.K.; Karoly, D.; Meinshausen, N.; Frieler, K. The effects of climate
extremes on global agricultural yields. Environ. Res. Lett. 2019, 14, 054010. [CrossRef]
41. Lobell, D.B.; Asseng, S. Comparing estimates of climate change impacts from process-based and statistical crop models. Environ.
Res. Lett. 2017, 12, 015001. [CrossRef]You can also read