HORIZONS - Change the future Picture the past - Past Global Changes
←
→
Page content transcription
If your browser does not render page correctly, please read the page content below
VOLUME 1 ∙ April 2021

                                                      HORIZONS

First issue!

                                                    Change the future
         Picture the past

  Paleoscience and
 the UN Sustainable         How green were the
 Development Goals          oceans in the past?       The stone readers
       pp 4-5                      pp 9-11                pp 23-27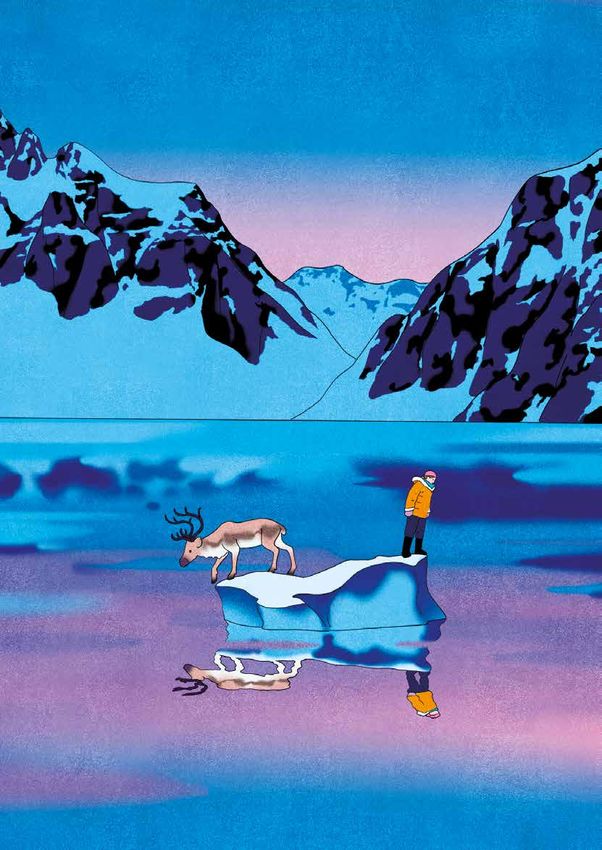
TABLE OF CONTENTS
    3      Editorial – Has changed, is changing, will change:
           Our home the Earth
           Boris Vannière, Graciela Gil-Romera and Sarah Eggleston
    4      Paleoscience and the UN Sustainable Development Goals
           Keely Mills and Matthew Jones
    6      Can we tell how climate will change in the future?
           Frank Oldfield
    9      How green were the oceans in the past?
    	Iván Hernández-Almeida and Mariem Saavedra-Pellitero
    12     From the depths of the Amundsen Sea
           Margot Courtillat
    16     Why sea level is not level
           Juliet Sefton and Fangyi Tan
    20     A message from the buried past: Deciphering the location of ancient settlements
           Hadar Elyashiv
                                           23      The stone readers
                                           		      Jérémie Moreau and Boris Vannière
                                           28      Young scientists speak about global change sciences
                                           		      Stella Alexandroff, Alicja Bonk and Tamara Trofimova
                                           30      The South Pacific and climate change
                                           		      Silvia Frisia, Nicole Pierce and Pauline Treble
                                           34      Linking lead pollution in ice cores to ancient history
                                           		      Nathan Chellman and Joe McConnell
                                           36      Lake mud detectives
                                           		      Laura Hunt, Angela Nankabirwa and Tessa Driessen
    38     Pollen reveals the plant world of the past
           Andrea Miebach
    41     How to record fires that burned thousands of years ago
           Emma Rehn
    44     Humans and environments in the most arid place of the world
           María Eugenia de Porras, Eugenia M. Gayó, Mauricio Uribe and Antonio Maldonado
    49     Past farmers and the environment
           Jerry Olatoyan
    52     Paleovirology
           Marco Palombelli and Peter Gitau
    54     Glossary
    	Robyn Granger and Graciela Gil-Romera
    56     Meet the authors and illustrators
    58     Resources and references
    59     Acknowledgments
    60     Paleotherapy
           Boris Vannière and Peb & Fox

    Cover Jérémie Moreau
    Editors Boris Vannière, Graciela Gil-Romera and Sarah Eggleston

2   PAGES HORIZONS • VOLUME 1 • 2021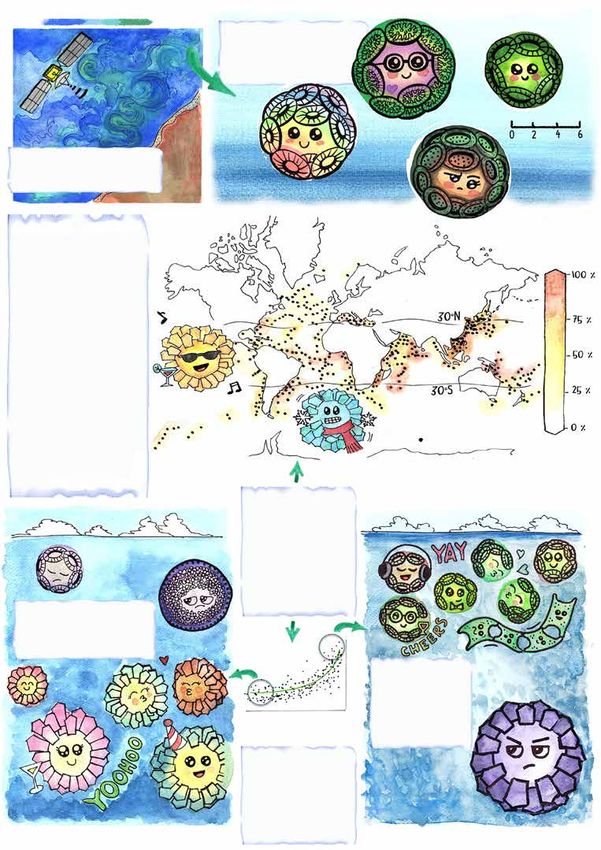
doi.org/10.22498/pages.horiz.1.3

HAS CHANGED, IS CHANGING,
WILL CHANGE: OUR HOME THE EARTH
Boris Vannière, Graciela Gil-Romera and Sarah Eggleston

Generation Z, or C for change? Most of the faces seen at climate       the present global changes, and to provide the key knowledge
strikes and other international political movements for environ-       to build a sustainable future. By digging into the Earth's surface,
mental justice have been those of you – the "Post-Millennials",        it is possible to learn a lot about the history of the planet. For
teenagers and young adults. To provide you with a sound                instance, some PAGES scientists drill into the bottoms of lakes
scientific basis for issues concerning current environmental and       to examine microscopic charcoal particles accumulated in the
climate change, we have launched a new PAGES publication,              sediments. This can allow them to calculate how many wildfires
Past Global Changes Horizons, where we have asked scientists           occurred at a certain location in the past. Understanding the
from all over the world to explain "global change" to the younger      causes and consequences of these long-gone fires helps to bet-
generation, and why it is not merely a hypothesis but rather a         ter estimate what might happen in the future.
reality based on facts. This change can be measured, it needs
to be highlighted, and we have to face it. You may consider the        PAGES research includes all topics in environmental science
following pages as a direct source of information that will help       addressing the past: geology, paleoecology, paleoclimatology,
you to defend your voice in the ongoing global change debate.          paleogeography, archaeology, and history. The articles in this
You might also consider the time you take to read these articles       magazine reflect this, and the topics include life in the desert,
as your contribution to slowing down the current climate change!       micro-organisms in the ocean, pollen grains hidden in mud in
                                                                       lakes, and molecular thermometers in caves. The stories come
Right now, the Earth is changing a lot, but let's stop to think: how   from all over the world: from some of the coldest regions and
unique is the change that our planet is experiencing compared to       some of the warmest, from the deepest parts of the ocean and
changes in the past? Or even more importantly: what is the role        the shores, from the land and the air. They deal with the history of
of humans in this global change? The only way to find answers to       pollution and present-day Sustainable Development Goals iden-
these questions is by looking back in time. That's what paleosci-      tified by the United Nations. They also explore the long history
entists do: travel through time! This isn't done with a time           of human adaptation, because of changes in the climate, and
machine like Dr. Who's TARDIS, the Back to the Future DeLorean,        human impacts on the Earth. There are comics and stories with
or the dark matter holes from Dark or Stranger Things. Instead,        illustrations. Some of the diagrams seem complicated at first, but
paleoscientists travel to Antarctica,                                                                sometimes pictures are worth even
caves, deserts, or virtually to super-                                                               more than a thousand words: this is
computing centers, to study ancient                                                                  the best way for scientists to show
societies, explore former landscapes,                                                                what they have measured and what
or look for the reasons for changes in                                                               this tells us about the past. More
past climate conditions. Their obser-                                                                importantly, this collection of articles
vations allow them to document the                                                                   will give you the facts to tell apart
long history of the planet that we have                                                              actual science from fake news or
inhabited for millennia. All of these                                                                non-expert opinions.
observations show that human activi-
ties have deeply modified ecosystems                                                                 Have fun reading this magazine!
and the dynamics of these ecosys-                                                                    We hope you enjoy the adventures
tems through time.                                                                                   narrated by our scientists: these
                                                                                                     are their time-traveling experiences
Like Alice's Adventures in Wonder-                                                                   where they describe what they have
land, where time runs backwards, and                                                                 learned, how this may help them
where Alice learns a lot about herself,                                                              to envision a better future world,
paleoscientists cross the mirror of                                                                  and what might be done to help
time in order to learn from our past                                                                 make those dreams come true. Flip
to better understand our present                                                                     through these PAGES, and change
and, more importantly, to help                                                                       how you think about the world.
inform decisions about how to create                                                                 Step into Alice's shoes for a while
a better future. This is one of Past                                                                 as you jump through the mirror and
Global Changes' (a.k.a. PAGES) main                                                                  turn back the clock.
missions: to understand past changes
on Earth and the causes and impacts
of these changes in order to explain                                                                 Illustration: Alice Favory

                                                                                                 PAGES HORIZONS • VOLUME 1 • 2021         3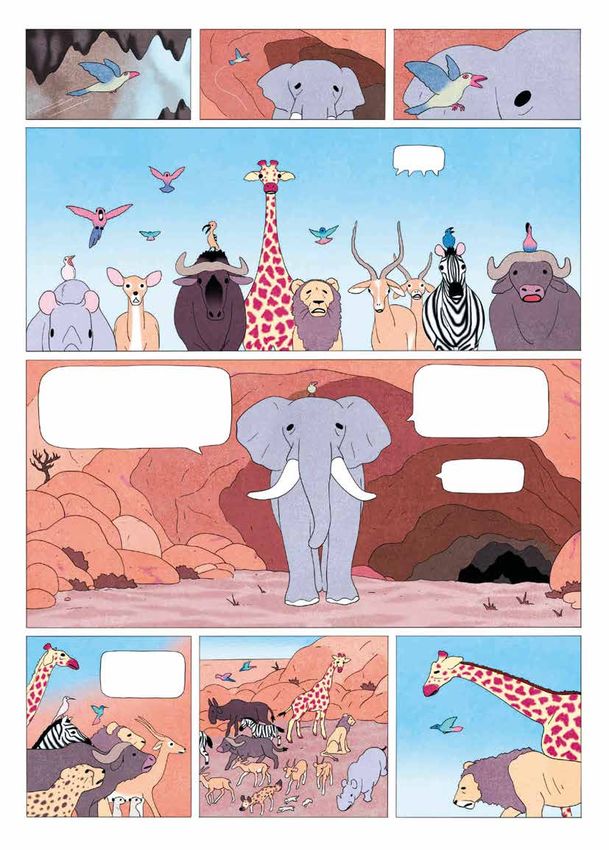
doi.org/10.22498/pages.horiz.1.4

              ce an d th e UN
    Paleoscien             e nt Goals
                   velo pm
    Sustainable De
Keely Mills and Matthew Jones                                The Sustainable what ...?
                                                             In 2015 the United Nations called for governments and
                                                             people across the world to work together to "end pover-
                                                             ty, protect the planet and improve the lives of all". They
                                                             set 17 goals – the Sustainable Development Goals (SDGs)
                                                             – which have 169 targets! We need to hit all of those
                                                             targets by 2030!

                                                             A global challenge
                                                             The 17 SDGs can only be reached if everyone – from
                                                             you and your nextdoor neighbor, to scientists (including
                                                             PAGES scientists) and government organizations – works
Figure 1: The 17 Sustainable Development Goals               together. We also need to bring together different types
as defined by the United Nations.                            of research, such as environmental science and social
                                                             science to really make a lasting change.

 Figure 2: The creation of sustainable partnerships
 in geoscience (and beyond) are critical to the
 delivery of the Sustainable Development Goals.
 Photo credit: British Geological Survey.

Can studying the past really help achieve the SDGs?
Geoscientists have many skills that can be used to address   The research we do looks at the Earth and the environ-
these global goals. We take lots of measurements that        ment today and in the past. This is important as we can
allow us to understand our planet and how people inter-      use this information to work out what will happen to the
act with their environment. We work with scientists and      Earth and the environment in the future. This includes
communities all over the world, and we often join the dots   everything from understanding past climate change and
between many different science subjects (such as biology,    modeling future climate, to understanding and pre-
chemistry, and physics) to solve difficult problems.         dicting changes in water resources, and predicting the
                                                             impact of environmental hazards like volcanic eruptions
                                                             and earthquakes.

4   PAGES HORIZONS • VOLUME 1 • 2021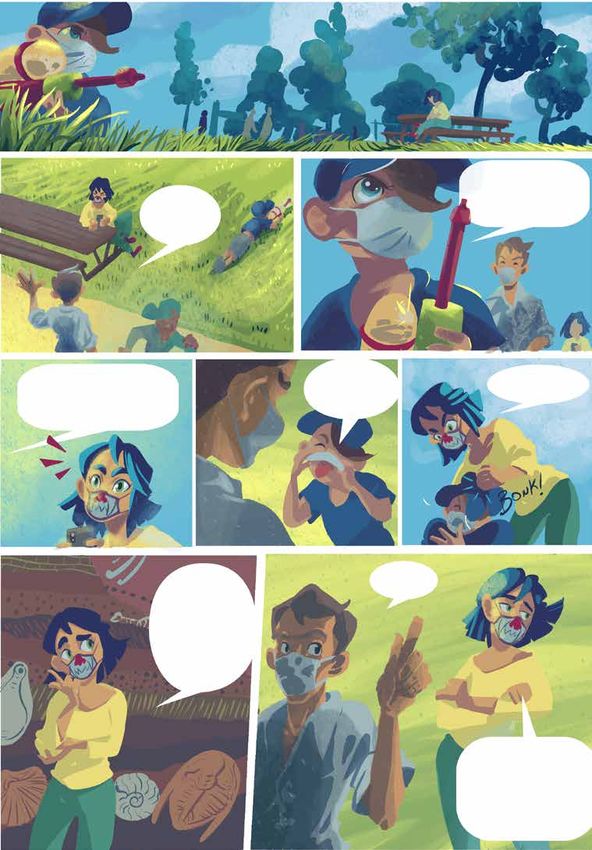
GOAL 2: ZERO HUNGER                                                          GOAL 6: CLEAN WATER
End hunger, achieve food security and improved                               Protect water-related ecosystems including
nutrition, and promote                                                       wetlands and lakes
sustainable agriculture
                                                                             Tropical regions are home to
Agriculture was first developed                                              some of the fastest growing
over 10,000 years ago and has                                                populations and some of the
been supporting human popu-                                                  world's poorest people. These
lations ever since. The archaeo-                                             regions are also impacted by
logical and geological records                                               climate changes, which can
provide examples of how past societies, and their agricul-                   influence how much rain falls, for example. This can cause
tural practices, have been able to cope with changes in the                  problems with how much water there is in lakes, and how
environment and climate. Paleoscience can also measure                       clean that water is. If there is not enough water, or if it is
how agriculture in the past may have caused problems,                        very dirty, it can make people sick, and it can also make
such as desertification or changes in water availability and                 the creatures and fish that live in the lakes die. Paleoscien-
quality. We can learn from these examples to ensure that                     tists can study how the amount of lake water has changed
agriculture in the future does not cause additional stress                   through time and how clean it has been, and work with lake
to the environment while still being able to feed a growing                  managers to develop guidelines to help look after the lakes
human population.                                                            into the future.

                                                                             GOAL 17: PARTNERSHIPS
                                                                             Enhance global partnerships to share knowl-
                                                                             edge to support the achievement of SDGs in all
                                                                             countries

                                                                             Perhaps the key to achieving all the SDGs is tied up in Goal
                                                                             17. Paleoscientists are very good at working as a team
                                                                             to help understand some of the problems that our Earth
                                                                             faces; paleoscience relies on experts from many different
                                                                             subjects. It is important that we continue to work together,
Figure 3: Excavation at the Neolothic site of Wisad Pools, Jordan, as        at home or overseas, with scientists, government bodies,
part of the Eastern Badia Archaeological Project. Evidence suggests the      and our nextdoor neighbors! We must work hard to create
region was a lot wetter and greener in the past. Photo credit: Matt Jones.
                                                                             new ideas that will have a positive impact on the environ-
                                                                             ment and fellow humans. PAGES engages with groups
GOAL 13: CLIMATE ACTION                                                      of people from all over the world, who work together to
Take urgent action to combat climate change                                  ensure that we understand Earth's changes in the past,
and its impacts                                                              present, and future.

Paleoscientists have and will
continue to contribute to the
Intergovernmental Panel on
Climate Change Assessment
Reports. These reports bring
together scientific knowledge
on the impacts of climate change and provide information
for governments in over 120 countries. Paleoscientists con-
tribute by providing data on how the climate has changed
going back in time for hundreds and thousands of years.
The data covers all parts of the Earth, including the atmos-
phere, oceans, and polar regions.

Find out more:                                                               Figure 4: Lake Parishan, Fars, Iran. Photo taken during fieldwork
                                                                             associated with the Mamasani Archaeological Project. Research
UN SDGs: https://sdgs.un.org/goals                                           indicates that lake levels have been sensitive to human activities for
Intergovernmental Panel on Climate Change                                    thousands of years. Photo credit: Matt Jones.
Assessment Reports: www.ipcc.ch/reports

                                                                                                         PAGES HORIZONS • VOLUME 1 • 2021             5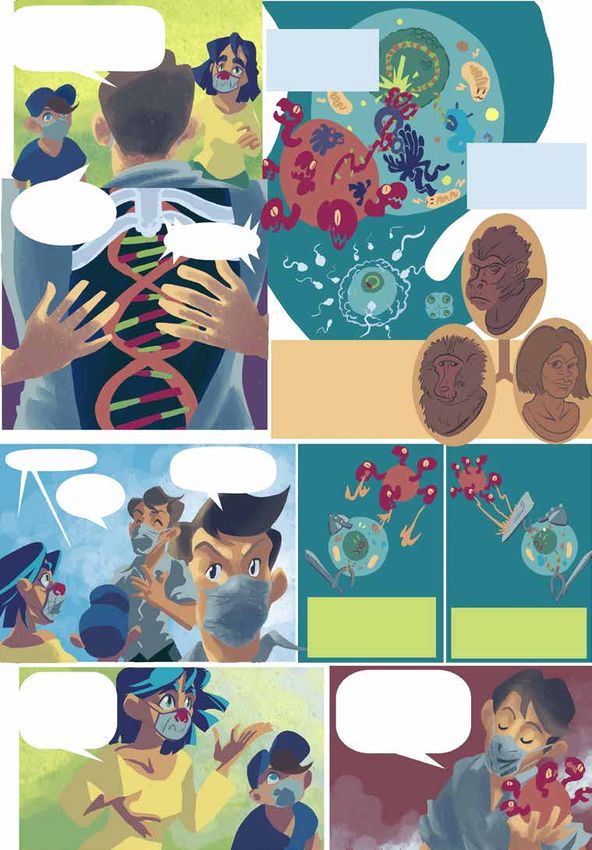
doi.org/10.22498/pages.horiz.1.6

                        e
Can we tell how climat
     change in the future ?
will
Frank Oldfield
                                                                                                 Image credit: IPSL, CEA

Working out how climate will change in the future de-           A key test is whether they can predict the climate during a
pends on the use of computer-based models. The latest           period for which we already know what the climate was like:
models of future climate change tell us that during your        the past! Unlike in modern times, earlier climatic changes
lifetime, global warming and the weather extremes linked to     were driven by natural processes such as changes in the en-
it will pose major challenges for life on Earth unless urgent   ergy received from the sun, natural variations in atmospheric
action is taken now. How reliable are these models and the      greenhouse gases such as CO2 and methane, and volcanic
projections of future climate that they create? Producing       activity. Over the last few decades, changes arising from
them requires a rather new kind of science that is often        human activities must also be included, mainly increases in
criticized by those who don't believe in man-made climate       atmospheric greenhouse gases and notably CO2 arising large-
change, so it is important to learn more about how climate      ly from the use of fossil fuels. Only if the results produced by
models, especially those used to project future global warm-    the models for the past compare well with the actual record
ing, are tested for their reliability.                          of past climate changes can we rely on the models to give
                                                                reliable projections for the future. The model-based results
                                                                are usually referred to as simulations.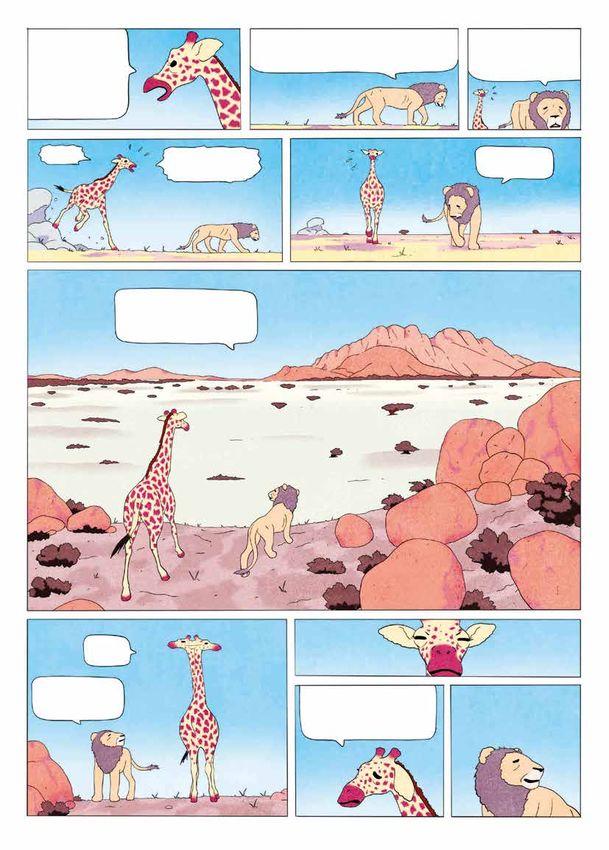
We know mainly from meteorological and written records                  Now we come to the key question: how well do the mod-
how climate has changed over the last 170 years or so. Mod-             el-based simulations of past temperature compare with
els can therefore be tested by comparing the simulations                the records derived from measurements and from natural
for this period with the actual record of climate change.               archive-based reconstructions? Figure 1 shows a reconstruc-
But climate has varied on much longer timescales, so it is              tion of global temperatures for the period 1200 to 1850 CE
also important to be able to make similar comparisons for a             compared with the results from a range of the most recent
longer period in the past. For pre-measurement times, past              computer-based global temperature simulations for the
global temperatures have to be reconstructed from other                                   same period. The graph shows that there is
lines of evidence, for example tree rings,                                                good agreement between the model-based
                                                          toring in
sediments, and corals. We may think of       Only by fac eenhouse                         simulations and the grey envelope of nat-
                                                           r
these as natural archives of information     the rise of grations is                      ural archive-based reconstructions. So far
                                                          t
                                             gas concen account
                                                         to
                                             it possible rved
about the climate. First, we need to                                                      so good, but what about the recent past,

                                                         e
                                             for the obs increase.
work out, through a process of calibra-                                                   during which time human activities have
                                                         re
tion, how well they have recorded past
                                             temperatu                                    affected the climate?
climate change.
                                                                        Figure 2 shows the record for the most recent period, the
Take tree rings as one example. Accurately dated features               one during which the key question of human-induced global
like annual ring width for a group of trees can be established          warming arises. The graph provides a comparison between
for each year that the trees grew. The sequence obtained                the past changes in global temperature over the last 170
can then be compared with the temperature records span-                 years and the calculated effects of the various processes,
ning the same period from nearby weather stations. By                   both natural and human-induced, that are used to generate
comparing the sequence of tree-ring measurements with                   computer-based climate models. Until the middle of the
the sequence of temperature values, the tree-ring record                20th century, the changes in global temperature mainly re-
can be translated into past temperature changes. Then,                  flect the influence of natural processes, but since then those
by measuring ring widths in dated older wood, beyond the                natural processes on their own fail to generate changes
timespan of direct observations, the values derived from                that match the actual, rapid temperature increase recorded
the calibration can be used to
reconstruct a longer record of
annual temperature changes.
The next step is to combine re-
cords from long-lived trees with
those from fossil wood. These
can then provide temperature
records spanning many centu-
ries. The methods for calibrat-
ing other natural archives may
                                                                                                          ted result s with natural
                                                                        co mpares computer-simula                                      d
                                                              e gra ph                                  rature between 1200 an
be different, but the goal remains               ure   1: Th
                                             Fig
                                                                          uc tions of global tempe
                                             archive-based reconstr                                       s for mu ltip le mo  de l-
the same, to derive records of past                                           e lines plot mean value
                                             1850 CE. The red and blu line uses maximum values for variations in
                                                                           red
climate change for the period before         based simulations. The                                      values. The grey shadin
                                                                                                                                       g
                                                  sun 's influe nc e, the blue line uses minimum                  ep en de nt res ea  rch
                                             the                                                            l ind
                                                                             struc ted values by severa e and below the
                                             spans the range of recon
the 1850s.
                                                                                     shows  var iat ion s ab ov
                                                                              scale
                                             groups. The temperature rature for the period 1500 –1850 (dashed line).
                                                                             pe
                                             reconstruc ted mean tem                                   Fif th Assessment Repo
                                                                                                                                     rt
                                                e  gra ph  is ba sed  on  Figure 5.8 shown in the
                                             Th                                                           ge.
                                                                            l Panel on Climate Chan
                                                                                                              1

                                             of the Intergovernmenta
                                                                                                  PAGES HORIZONS • VOLUME 1 • 2021          7
Global Warming Index
Observed
pares
e graph com
All human factors
Figure 2: Th lated result s
1.0ºC
u
computer-sim observed record
All factors
th e ac tu al
with the
perature for
All natural factors
of global tem 50 CE. The black
18
period since annual values
0.5ºC
p re se n t
dots re s of
th e lin e s p lot the result
and s, b o th
mulation
alternative si t of
w it h out the impac m
with and fr o
ties. Adapted
0.0ºC human ac tivi g Index.2
in
Global Warm
1850 1875 1900 1925 1950 1975 2000
Year (CE)
by recent measurements. Only by factoring in the rise in that models provide. How can anyone doubt their value as a
greenhouse gas concentrations resulting largely from fossil basis for action?
fuel use is it possible to account for this increase. From these
graphs, we see that models can reproduce the past record Enough about the science used to validate future global
of climate change extremely well; moreover, the second temperature projections – the actual course of climate
graph confirms that the main cause of the recent increase change during your lifetime and beyond will depend, above
in temperature is human activity. These results strengthen all, on human behavior. Projecting the likely impact on
confidence in the projections of future global temperature climate change of different combinations of human activities
calls for models that go beyond the strictly
Alternative simulated global temperature trends to 2100
scientific. They inevitably include additional
6ºC uncertainties. Figure 3 is one of many
attempts to show the crucial importance of
4ºC human behavior. The two lines are shaded
to indicate the level of uncertainty for each
2ºC projection. If there is an urgent, optimum
reduction in emissions we would expect to
0ºC follow the blue line. If there is continued,
rapid growth in atmospheric concentrations
of greenhouse gases the climate models
-2ºC
2000 2050 2100 suggest that we will follow the red line. The
Year (CE) future therefore depends on human policy
and responses.
ht the
m an y at te m pts to highlig rse
on e o f cou
re 3: T h e graph shows re sp o n se s on the future nued Look at the graph and ask yourself: what
Fig u hum an con ti
of alternative es. The red line assumes rgent and
likely impac t tu re ch an g as su m e s u
blue line
pera needs to happen to bring further increases
of global tem is si o n s; th e n ce rtainty
use gas em shows the u
high greenho ion and control. Shading Figure SPM.6.1 in greenhouse gases to levels that minimize
uct m
optimum red h projection. Adapted fro
to e ac future environmental damage and human
at tached
hardship?
8 PAGES HORIZONS • VOLUME 1 • 2021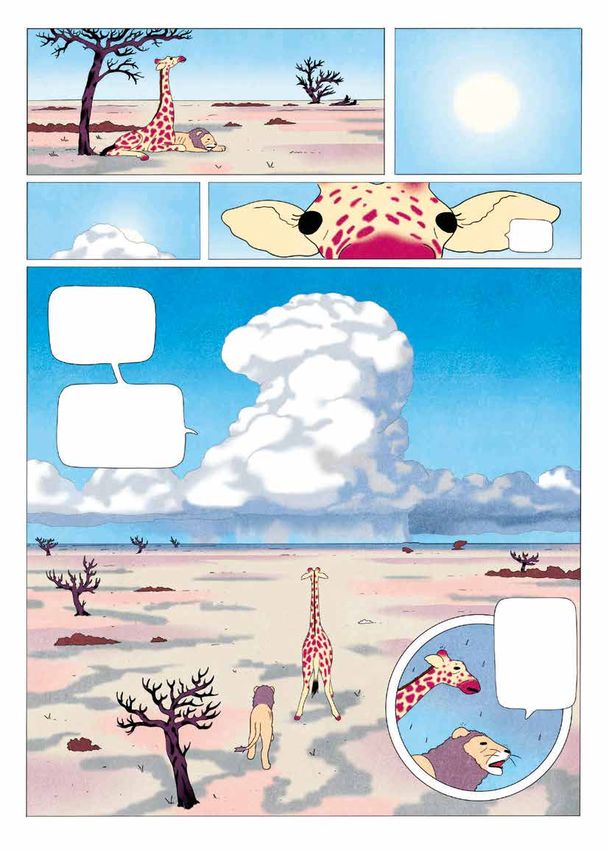
doi.org/10.22498/pages.horiz.1.9

                            HOW GREEN WERE THE OCEANS IN THE PAST?
                                         GGetGG the answer from an awesome "bug" buried in the mud
                                                           Iván Hernández-Almeida and Mariem Saavedra-Pellitero

           When we look beyond the clouds, at the                          But their memory is short,
           starry night, there are eyes looking back at                    going back not much further
           us. Sentinels in space, able to see colors in                   than the year you were born.
           the blue abyss of the sea.
                                                                           1998         Time           2020

                                                             Temperature

                                                                                                                            Joint Intention
- Ocean productivity +

                                                                                                                       To have a peek beyond, further into
                                                                                                                       the past, we must dig into the mud.
                         1998           Time   2020                                                                    Fine layers of sand and clay, alternating
                                                                                                                       like a chocolate cake, are like pages
                                                                                                                       of a book. Each slice, a grasp of time,
                                                                                                                       traps the remains of "bugs" that lived,
                                                                                                                       bloomed and died.

         You may have heard that tiny algae
                                                                                                                                     "c oring"

         creatures, invisible to the naked eye, are
         the trees of the ocean. You may have
         been told that these algae might hold
         the key to combat GLOBAL WARMING.

                                                                                       They consume CO2 during photosynthesis,
                                                                                       and when they die, they sink to the
                                                                                       seafloor where they are buried. These
                                               Tim e                       Neweeer     minute primary producers are the food
                                Older                                                  factories of the ocean...
              CO2

                                                                                                                                                  Neweeer

                           Older                                             Neweeer
                                                                                          sedim ent core

                                                                             ...and they hold secrets about how
                                                                             green the oceans were in the past.                                  Older
                                                                                                                        PAGES HORIZONS • VOLUME 1 • 2021           9
low productivity             high productivity
                                                  Coccolithophores cover themselves
                                                  with discs of calcium carbonate,
                                                  like scales on a dragon's egg,
                                                  forming armored spheres.

                                                                                                                                                  micrometers
 Tiny creatures swarmed the sea,
 coloring the surface with fifty
 shades of aquamarine.

 You may have been told that
 these algae thrive everywhere                                                                                                               Florisphaera profunda (%)
 in the ocean. But this is not                                                                                                                  in surface sediments
 entirely true. There are vast
 areas of the ocean that are
 like deserts for life.
 The tropical oceans are heated
 throughout most of the year.
 They turn into a warm soup
 that rarely mixes. Although
 sunlight is not a problem,
 nutrients are rare and lie
 deeper in the ocean.
 One of these coccolithophore
 algae, called Florisphaera                                                                                                   SURFACE SEDIMENTS
 profunda, loves living deep, in
 this warm soup, and it is rarely
 found in cold waters.
                                                       Using the abundance of
                                                        Florisphaera in surface
                                                         sediments (=same as
                                                       modern ocean conditions)
                                                           and comparing to
                                                          satellite productivity
                                                        measurements, we can
                                                        reconstruct past ocean
     The lower the productivity of                       primary productivity!
     the surface ocean, the happier
     and more abundant Florisphaera
                                                                                  + Florisphaera profunda (%) -

     is in the depths.
                                                                                                                  It is a bit sad, but
                                                                                                                  Florisphaera prefers
                                                                                                                  living alone, in darker
                                                                                                                  and deep waters. Never
                                                         - Ocean productivity +                                   invited to its upstairs
                                                                                                                  neighbor's "plankton
                                                                                                                  parties", full of color.
                                                            This relationship
                                                       (=equation) can be used
                                                       to transform abundances
                                                         of Florisphaera found
                                                         in deeper sediments
                                                       (=older times) into ocean
                                                              productivity.
10    PAGES HORIZONS • VOLUME 1 • 2021
We studied Florisphaera in many sediment cores (24000-19000 ye
l Ma xi m u m ars ag
around the globe, and used that relationship.
a s t Gl a c i a o) Ocean
We see that... L productivity
...thousands of years in the
past, when ice-sheets were
larger than today and global
temperatures colder, winds also
blew stronger, mixing surface
ocean waters. Photosynthesis was
higher, meaning more carbon was
transferred into the deep ocean.
Florisphaera got a bit upset. With
all this higher productivity, it was
a bit distressed!
ne (6000 yea rs ag
ate Holoce
Ocean
productivity to-L o-tod
ay)
Mid-
After that, in a time not much
different than today, temperatures
were warmer, and the mid-latitude
oceans got calmer. Ocean
productivity decreased, and
Florisphaera lived in peace.
If the planet gets really
warm, we should be
alarmed! Florisphaera
Our eyes from space tell us that the will be happier when the
low-latitude deserts in the ocean are deserts in the oceans will
becoming larger. Rising temperatures get larger!
of the planet warm up the ocean
too. Marine plant life slows down and
absorbs less carbon.
A little bit of warm can
WHAT WILL HAPPEN IN THE FUTURE?
cause harm! Surface
ocean color will turn
from green to brown,
May 417 ppm and productivity will go
2020 CO2 down!
Only if we take a
strong stand can we
prevent such change!
CO2
Time
PAGES HORIZONS • VOLUME 1 • 2021 11doi.org/10.22498/pages.horiz.1.12
e dep th s o f the A m un dsen Sea:
From th climate!
re wit h hints of future
Hidden treasu
Margot Courtillat and all the scientists from IODP Expedition 379
The news isn't great! You may have already heard: the The IPCC also highlighted that the marine ice sheet
climate is changing, and sea level is rising. But did you from the Amundsen Sea Embayment, the indentation
know that the East and West Antarctic Ice Sheets, giant in the shoreline which forms an open bay, will likely
masses of ice covering the continental land, could be be one of the major contributors in the substantial
one of the main reasons for this? increase in sea-level rise over the next century. The
Amundsen Sea is located right in front of the West
In 2018, the Intergovernmental Panel on Climate Antarctic Ice Sheet and to the south of the Pacific
Change (IPCC) Special Report on Global Warming Ocean. The West Antarctic Ice Sheet is suspected to
concluded that the instability of the marine ice sheet in have previously collapsed 3–4 million years ago, when
Antarctica and the irreversible loss of the Greenland Ice temperatures were like today. One such collapse raised
Sheet could be triggered by a rise of about 1.5 to 2°C global sea level by several meters. But to be sure of this
(34.7 to 35.6°F) in the global temperature. This could we needed to have more information about its behav-
then lead to a rise of the ocean of several meters, over ior over the last few millions of years. This is the main
hundreds to thousands of years. reason why the International Ocean Discovery Program
(IODP) decided to organize Expedition 379 to drill the
marine sediments from the Amundsen Sea.
Marine sediments
You are now probably wondering why we need to drill
marine sediments to know the history of an ice conti-
nent, and that is a good question! When an ice sheet
retreats, a lot of icebergs are released. Together with
the ice itself, they also transport dirt (also known as
sediment) into the sea. This sediment, which eroded
from the continent, falls onto the seafloor when the
iceberg melts. It falls in chronological order: that is, old
sediments end up on the bottom and young ones at
the top.
Antarctica and
Figure 1: Map of
as (NASA).
its surrounding se
12 PAGES HORIZONS • VOLUME 1 • 2021But residues from the continent are not the only type ning electron
ke n with a scan Sea
of materials you can find on the seafloor. Indeed, you Figure 2: P h oto ta
in if er a from the Amundsen have
fora m inif era
microscope of pedition 379. These foram
can also find the shells of dead marine organisms, and d durin g Ex th of 39 6 0 m (13,000
foun w ater dep
been retrieve
d from a a, an on the
d
that is my specialty! Between complicated words for le ft is Pullenia quinquelob µm corresponds
ft). On th e scale 200
rthia sp. The
organisms, like diatoms, coccolithophores, and radiolar- right is Stainfo of two hairs.
ess
to the thickn
ians, you can find the foraminifera. Foraminifera are
organisms made up of a single cell. They have mineral
Millions of years after the death of the organism, you
shells, like many other marine organisms and terrestrial
can find its shell in the sediment, and this tells you
snails, for instance. The shell doesn't decompose over
which species once lived there. This information gives
time and therefore remains in the sediment as a fossil.
you clues about the environment in the past and espe-
cially information like the former
oceanic temperature, concentration
of nutrients, and salinity (amount
of salt in the water).
Expedition 379
On 18 January 2019, an interna-
tional team of 34 scientists gath-
ered in southern Chile and sailed to
the Amundsen Sea. The expedition,
on board the drilling ship JOIDES
Resolution, aimed to recover as
much sediment as possible during
two months at sea in the Antarctic.
Working in such a remote place is
not easy, and indeed, we had some
trouble with icebergs!
PAGES HORIZONS • VOLUME 1 • 2021 13Figure 3: The JO
IDES Resolution
in the Amundsen
Sea. The ship
is 143 m (469 ft)
long, and the
tower, called a de
rrick, which is
used to raise an
d lower the drill,
62 m (205 ft) ab is
ove the water.
Photo credit: Phil Christie
In 2019, the number of icebergs in the Amundsen Sea of the time, and because of a medical evacuation, the
during the austral (Southern Hemisphere) summer was, expedition was shortened by one week. Despite these
compared to previous years, very high. This phenom- interruptions, Expedition 379 was a great success!
enon may have been caused by major calving events
(sudden release and breaking away of a mass of ice) of Analyses
the ice shelves over the last two to three years. As you We were able to drill at two sites and retrieved 1.08
can imagine, we really wanted to avoid re-enacting the km (0.62 miles) of sediment dating from the present
Titanic, so we had to avoid the icebergs. We succeed- to six million years ago, in the late Miocene. This is the
ed, thanks to two ice specialists who monitored the longest sediment core from the Antarctic region ever
ice conditions 24/7. There were two simple rules: if an to have been drilled from a marine platform near a
iceberg floats within two miles (3.2 km) of the vessel, rapidly melting, massive ice sheet!
stop all drilling operations; if it comes within one mile
(1.6 km), abandon the drilling hole! The large number The JOIDES Resolution is a very well-equipped ship.
of icebergs forced us to pause drilling operations 50% It's like a floating laboratory with a nice view. We
ents. The Photo credit: Tim Fulton, IODP JRSO
en core s of marine sedim d will
Figure 4: O p carefully an
studying them
scientists are
the core.
then sample
14 PAGES HORIZONS • VOLUME 1 • 2021could therefore pre-analyze the collected
sediment while we were still onboard and
found out that it covered a succession of
warm and cold periods. The warm periods
are characterized by a high abundance of
microfossils and sediments that have been
transported by icebergs or sea ice and then
released into a marine environment or a
lake. In comparison, the cold periods are
characterized by a grey, terrigenous mud.
The absence of microfossils and sediment
transported by icebergs during cold periods
is mainly due to the absence of the intru-
sion of the warm ocean current (Circum-
and U1532)
polar Deep Water). Indeed, this current is re d circles (U1533 9.
Figure 5: T h e Expedition 37
responsible for the melting of the ice sheet th e dr illing sites during
show
and, consequently, for the formation of the
icebergs. The lack of food for microfossils For now, the whole scientific crew is working hard to produce more
is another reason to explain their absence. detailed results, even during a global pandemic.
So, stay tuned for more!doi.org/10.22498/pages.horiz.1.16
Why sea level is not level:
An introduction to paleo sea-level science
Juliet Sefton and Fangyi Tan
The surface level of the ocean – what we call sea level
– is not the same everywhere. Sea level may be rising
in one location and falling in another, and by different
amounts. Sea levels also change over time.
Figure 1: Illustrating the difference between global mean sea
level and relative sea level.
There are some changes that we can observe on
a daily basis, like the rising and falling tides. Other
changes are slow and take decades, centuries, Scientists average the height of the ocean's surface
millennia, or even millions of years. To understand across the globe relative to the center of the Earth –
the processes behind sea-level changes, scientists we call this global mean sea level. Measurements of
use both modern instrumental and geological sea level in one specific location, made relative to land,
(paleo) observations. are called relative sea level.
Sea-level rise is a threat to human society. Understanding how and why sea
levels change is important to accurately predict what may happen in the future.
Processes of global and relative sea-level change
Short-term processes: Medium-term processes: Long-term processes:
minutes, days, years decades, centuries thousands to millions of years
Some examples...
Tidal cycles and waves
1 change relative sea levels.
During storms, storm surges
can cause coastal flooding.
Tsunamis and sudden land-
2 level changes generated
by earthquakes can cause
extreme flooding.
Local weather, climate, and
3 ocean currents can change
relative sea levels.
An increase in ocean
4 temperature and saltiness
can cause the ocean to
expand, causing global and
regional sea levels to rise.
Figure 2: Processes of sea-level changes over space and time. Adapted from IPCC.1
Extraction of groundwater Land rises or sinks in response to changes Melting of ice sheets (like
5 can cause land to subside, 6 in the weight of water or ice on top of it 7 Antarctica) adds a lot of
causing a rise in relative sea (called isostasy), causing a change in global water to the oceans, raising
level. and regional sea levels. global sea level.
16 PAGES HORIZONS • VOLUME 1 • 2021Why do we study Tales from our
past sea levels? predecessors
Many cultures around the world have rich oral and
To learn about long-term processes written histories that refer to memorable sea-level
changes in the past.
Humans have only been collecting sea-level data
for a few hundred years at most.
To understand medium- to longer-
Fishing up myths: demigods or Earth's furies?
term processes, we need to look
In the Pacific, myths speak of demigods fishing up
further back in time, before our
islands from the middle of the ocean. Researchers
observational record.
think this relates to the eruption
of underwater volcanoes, or
How have sea levels changed over
the uplift of the land during an
hundreds, thousands, and millions of years? What
earthquake – which creates
caused those changes?
"new" islands.
Scientific term: understanding temporal
variability
To learn about
geographical differences
Seashells are meant to be by the sea!
Our recorded history is also quite geographically Over 2000 years ago, Pythagoras found marine shells
skewed – our knowledge mostly far inland of the modern seashore – evidence that
comes from coastlines along the North the sea was no longer where it used to be.
Atlantic Ocean. This might be causing
a bias in our understanding of sea-level
processes.
Are sea-level changes different in different
places? Why or why not?
Scientific term: understanding spatial variability
Fun (and not so fun) facts
Japanese legend:
• During our last ice age ~21,000 giant catfish causes
years ago, sea level was ~130 earthquakes and
m (430 ft) below present sea tsunamis
level. Land masses were more "People attempting to
connected around this time: you capture Namazu, the
could walk from Europe, across giant catfish believed to
Asia, to the Americas! cause earthquakes."
• The Antarctic Ice Sheet, if melted completely,
could raise global sea levels by ~65 m (213 ft).
Source: UBC Library,
Rare Books and Special
Collections, QE537.2 J3 D57
1800z. Page 13
PAGES HORIZONS • VOLUME 1 • 2021 17FROM PAST TO PRESENT: How do we measure sea level?
The instrumental period (~1800–present)
Tide gauges were first introduced in the late 17th to early 18th centuries, and are the oldest instrumental
records of sea level that we have. Tide gauges measure relative sea level (see Fig. 1).
Since 1993, satellites have made it possible for
us to monitor nearly the entire surface of our PALEO RECORD INSTRUMENTAL RECORD PROJECTIONS
oceans. Satellite altimetry, unlike tide gauges,
1800 1993 PRESENT
measure only changes in the sea-surface
height. They do not record changes in relative
sea level caused by movement of the land. 2,000 years ago tide gauge
coral
The paleo record (before ~1800) satellite
Paleo archives can be dated, which allows us
to extend the sea-level record further back
in time to before the instrumental period. sediments
Examples are archaeological remains,
geomorphological features, sediment
records, and fixed biological indicators.
Figure 3: Adapted from IPCC Projection1; Paleorecord adapted
from Kopp et al.2; Tide-gauge data from CSIRO3; Satellite data
from NASA.4
Archaeological remains Sediment records
Certain archaeological structures are built near sea level, such Changes in the sediments and fossils within a sediment core
as piers and fishponds. Finding these abandoned structures tell us about changes in depositional environments through
where they can no longer serve their intended purposes time, which can be linked to rising or falling relative sea levels.
indicates where sea level was in the past.
Submerged 7000-year-old sea wall off the Carmel coast, Israel. Sediment core from Pulau Ubin, Singapore.
Adapted from Galili et al.5 Source: Sarah Cates, Earth Observatory of Singapore.
Geomorphological features Fixed biological indicators
Erosional or depositional landforms higher or lower than their Fixed biological indicators are organisms that are attached to
modern equivalents tell us that relative sea level must have hard surfaces and/or grow at specific depths in the ocean (e.g.
been different in the past, for at least long enough to have oysters, coral microatolls). Because they live in predictable
carved out these landforms at a different elevation. habitats in relation to sea level, they can tell us about relative
sea levels in the past.
Tidal notches at Xiapu, China. Coral microatoll exposed at low spring tides.
Source: Fangyi Tan, Earth Observatory of Singapore. Source: Fangyi Tan, Earth Observatory of Singapore.
18 PAGES HORIZONS • VOLUME 1 • 2021+8 meters (26 ft 3 in) mean tide level (mtl)
Your turn now,
paleo sea-level
scientist! 4,000 year-old mangrove
bark found at 2.5 meters
(8 ft 2 in) depth
Upland forest
Modern mangrove environment
+1 m (3 ft 3 in) mtl
0 m (0 ft) mtl
-1 m (-3 ft 3 in) mtl
Activity Context
We visited an upland forest and drilled a sediment
Using the information provided in the text,
core into the ground. At 2.5 m (8 ft 2 in) depth
illustration, and the equation below, answer
within the core, we found fossils that indicate a
these questions:
former mangrove environment (mangrove bark,
mangrove pollen). These fossils are 4000 years old.
?
The top of the sediment core was 8 m (26 ft) above
Was relative sea level 4000 years ago higher
mean sea level.
or lower than today?
? What was the relative sea level (in feet or
meters) 4000 years before present?
Necessary assumptions
? Based on the elevation range that mangroves
live in today, what is the possible elevation
range that sea level could have been (in feet or
MANGROVE HABITATS
HAVEN'T CHANGED
meters)?
The habitats/elevation zone we find mangroves
living in today were the same in the past.
RSL = E – RWL
RSL: relative sea level THE TIDAL RANGE HAS REMAINED
THE SAME THROUGH TIME
E: elevation of sample
RWL: midpoint of the vertical living range Where mangroves live is a function of the
tidal range; the larger the tidal range, the
that a sea-level indicator occupies
larger the elevation range in which the
mangroves can live.
In assuming that mangroves today occupy the
same elevation zone as they did in the past,
Hint: Principle of uniformitarianism we are also assuming that the tidal range at
The present is the key to the past. The processes the site has not changed.
that we observe today are the same processes that
happened in the past.
PAGES HORIZONS • VOLUME 1 • 2021 19
Answers: Higher; RSL: 5.5 m (18 ft) above present sea level; range: 1 m (3 ft)doi.org/10.22498/pages.horiz.1.20
A message from the buried past:
Deciphering the location of ancient settlements
Hadar Elyashiv
Follow this sign to see the observations,
South-East
evidence, and interpretation of the data
from Haifa Bay. Mediterranean
How can we know what a coastal
environment looked like 4000 years ago?
Tell
In a world with no cars or public transportation, going N River
to the sea to fish or to collect food along the coast, even Mountain area
W E
1 kilometer or 1 mile can be too far. So why are settle-
ments from 4000 years ago now located between 2–5
km (1–3 miles) away from the coastline? This question
has troubled archaeologists who studied the coastal area
now called Haifa Bay in Israel. It is especially puzzling as
we know that fishermen would choose to live close to
the water, where they can leave their boats rather than
carry them.
ne
Curre 2k
1.2 m
tli
nt c a s
o mi
Did people 4000 years ago have special technology, or
4 4m
was the coastline in a different position than it is today?
1.
km i
How can we know what a coastal environment looked
like 4000 years ago? Knowing the answer could help us
understand how people lived in the past and perhaps tell
us about possible future changes to the coastline.
To reconstruct the past environment, a geologist's work
resembles the work of a detective reconstructing a crime
scene. It begins with observing and collecting evidence
such as field observations, sediments, and fossils sam-
ples. Once samples are analyzed, the geologist must
interpret these natural clues – how did they get there, Figure 1: Marine and coastal area of Haifa Bay (Satellite
where did they come from, and how old are they? images by Google Maps).
How can we find the past in the present? Observing the current coastal environment of
Haifa Bay reveals a narrow, sandy coastline
A first step towards environmental reconstruction is to stretching almost linearly in the north-south
follow the principle "the present is the key to the past". direction. To the south, the coastal area is bordered by a
This principle suggests that processes we see today also mountainous area. The Mediterranean Sea stretches to
happened in past times. In order to understand how a the west and the land to the east and north. Two main
coastal environment looked like thousands of years ago, rivers drain into the bay, thus delivering sediments to the
we first need to observe how the coastal environment bay. An array of Tells ("Tell" is the local term for an
looks and functions today. ancient settlement) stretches from south to north in a
crescent-like shape. Tells are situated between 2–4 km
(1–2.5 miles) away from the current coastline.
20 PAGES HORIZONS • VOLUME 1 • 2021What can observations from a current
coastal environment tell us? These represent the result of many processes in the
coastal environment of the recent years. Monitoring and
If you visit different coasts around the world, you will measuring the winds and ocean currents, plus the effect
notice many differences among coastal environments. of storms, wave action, and tides, gives us an under-
Yet in general, there is a strip of sand between the sea standing of the processes that create these deposits
and the land (geologists call this land "inland"). The along the coast. The location of the coastline is defined
width of that sand strip may differ from place to place, by where coastal sediments are found. Therefore, to find
and features such as plants, shells, algae, sand dunes, the location of the coastline in the past, we need to find
and wetlands may be found in one place but not anoth- such coastal sediments from the past, which are buried
er due to different environmental conditions. within the subsurface of different sediment layers.
Tell
To extract that infor-
N
mation from under-
ground, we drilled
W
cores along Haifa Bay in the E
Figure 2:
bay (west of the current Reconstruction
coastline), the beach, and of past coastlines
inland (east of the current along Haifa Bay,
coastline). In cores where we based on location
found coastal sand, we and dates of coastal
sand.
= 16 ft)
sampled and measured the
age of the sand. We marked
the coastline 8000, 6000,
3 ft)
0 ft)
and 4000 years ago on a
(-5 m
t)
= - 49 f
3
map. These results are very
m=
-
80 0 0
m=
clear– the coastline moved
go
yea
e (0
from west to east during the
rs a
rs a
m
40 go (-10
past 8000 years. This also go (-15
tlin
yea
indicates that the sea level
as
00
rose from about 15 m (50 ft) rs
a
co
below today's sea level to its ay's ea
Tod
y
current level. 0
0
60
Why does the coastline change with time?
The coastline changes because of changes in sea level Because of the sea-level change, the location and the
with time. Sea-level changes differ from short times- width of the coastline – the beach itself – is changing
cales, as in hours for the tide, leading to a change of as sediments are removed from or added to the coast.
inches to feet (centimeters to meters). Over longer pe-
riods – thousands and millions of years – sea level can
rise and fall tens to hundreds of feet or meters.
Find out more about sea-level changes here:
PAGES HORIZONS • VOLUME 1 • 2021 21
Haifa Bay coastline (photo credit: Naama Sarid)How does the coastal environment
change following sea-level rise?
When we talk about a sea-level change, this refers In the figure below, we see a 3D model of the
to the height (or depth) of the water: a change in layers of sediments below the water in Haifa
the vertical direction. However, the changes to the Bay in two cores. The cores showed us that the
environment, such as the location of the coastline, are coastline migrated eastward from around 7000 years
in the horizontal direction. When sea level rises, the ago over almost 3 km (2 miles) as a result of a global
coastline shifts inland, which affects the environments sea-level rise. However, this was not enough to
both onshore and offshore. As seen below, such a determine the distance between the past coastline and
transition causes the coastline to migrate (move). This some of the easternmost Tells. To do this, we had to
in turn leads to the build-up of water from river outlets, examine the sediments, which showed us that through
and a wetland is formed inland, behind the sand dunes. time, some locations that were marine became coastal
and, later, even inland environments: special fossils
found within the sediments, such as seashells or
freshwater shells that grow in rivers or wetlands,
enabled us to differentiate between each of these
Inlan environments. We found that as the sea level rose and
d
Coas
tal
the coastline migrated eastward, an environmental
change in the coastal area occurred at the same time.
Mari
ne
Wetland mud
Sand Marine mud Inlan
d
Ruins of
a tell Coas
tal
Mari
ne
Wetland
Seashells
mud
Soil
Sand dunes
Soil
Coastal sand
Shallow marine mud
Sandy
mud
Wetland Inland Coastal Marine
The environmental change in Haifa Bay was caused Understanding the effects of sea-level rise on
by a sea-level rise. Sand dunes formed along the coastal settlements poses an important question:
coastline, blocking rivers from draining into the sea. knowing that the sea level is currently rising, what
The stagnant waters formed wetlands, which creat- will happen to our coastal cities in the future?
ed a barrier, which made it more difficult to estab-
lish villages close to the sea in these locations.
22 PAGES HORIZONS • VOLUME 1 • 2021
Haifa Bay coastline (photo credit: Naama Sarid)doi.org/10.22498/pages.horiz.1.23
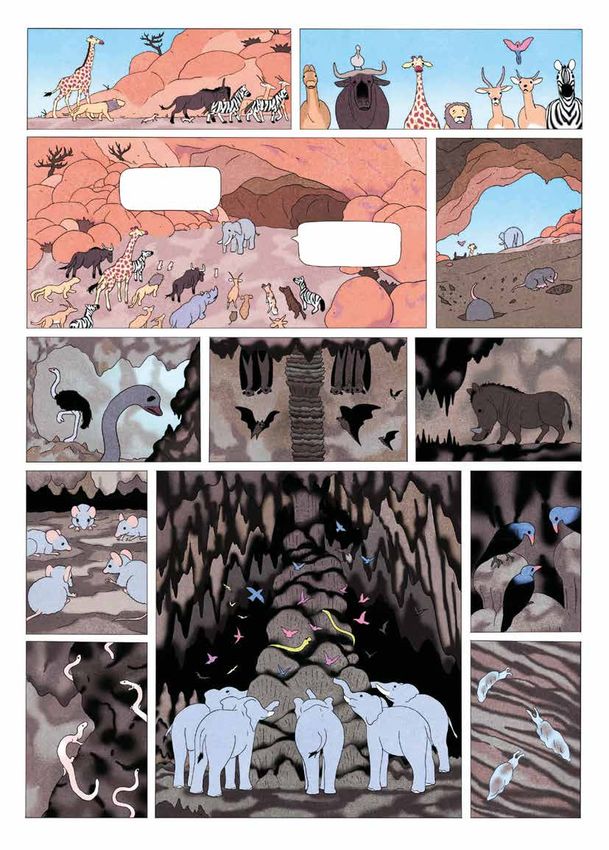
THE STONE READERS
JÉRÉMIE MOREAU BORIS VANNIÈRE
WHAT DO YOU
HAVE IN EXCHANGE
FOR MY PRECIOUS
PREDICTIONS,
OLD LION?
I'M THIRSTY; NOTHING...
I'M OVERHEATING... I'M JUST SKIN
AND BONES...
MOTHER GIRAFFE,
YOU WHO CAN SEE SO FAR...
YOU WHO CAN SEE THE REALLY? IN
FUTURE... DO YOU SEE RAIN THAT CASE, I'M
COMING?... I CAN'T LAST AFRAID MY
MUCH LONGER. EYESIGHT IS
BLURRED. GO
AWAY.
BUT MOTHER GIRAFFE, THE HUGE ASSEMBLIES:
REMEMBER HOW FAMOUS ANTELOPES, WILDEBEEST,
I MADE YOU WHEN I WAS ZEBRAS, MEERKATS, NOW YOU
POWERFUL. MARABOUS, STORKS... ARE AS LONELY
AS I AM... ...AND THE
ALL AT YOUR FEET. SAVANNA IS
SO DRY.
PAGES HORIZONS • VOLUME 1 • 2021 23AS YOU WISH. I PROBABLY CAME TO SEE YOU OUT I'M GOING TO CONSULT
I CAN SEE THROUGH OF NOSTALGIA... BUT YOU HAVE FORCED ME TO THESE NEW SCHOLARS OF
YOUR OLD TRICKS. MOVE WITH THE TIMES. THE STONES EVERYONE
LIKE YOUR OLD MAN'S IS TALKING ABOUT.
BODY, THEY HAVE
LOST THEIR LUSTER.
WAIT! FOLLOW ME AND
WHAT DID YOU SAY?
THE NEW WHAT? YOU SHALL SEE.
THEY'RE OVER THERE, IN A
CAVE. THEY READ THE EARTH'S
PAST AND PREDICT THE FUTURE.
WHERE?
THERE?
THE MOUNTAIN
OVER THERE; DON'T NO... I'LL LET YOU IN ON
YOU SEE IT? A SECRET, OLD KING. I AM
SHORTSIGHTED, AND MY
EYESIGHT IS GETTING WORSE...
24 PAGES HORIZONS • VOLUME 1 • 2021THE STONE READERS
ARE STILL AT WORK.
THEY ARE EXPECTED
TO ANNOUNCE THEIR
FINDINGS SHORTLY.
PAGES HORIZONS • VOLUME 1 • 2021 25AND?
SO, WE'VE LEARNED A LOT. BUT FROM READING THE
UNFORTUNATELY, WE CANNOT TELL SIGNS OF THE PAST IN THE
YOU ANYTHING CERTAIN ABOUT OUR FUTURE. ROCKS AND FROM OUR
WE CAN ONLY MAKE PREDICTIONS BASED OBSERVATIONS IN THE DEPTHS
ON WHAT HAS HAPPENED IN THE PAST. OF THE EARTH, IT WILL RAIN.
MAYBE EVEN
TODAY.
...BUT AS THE YEARS
PASS, IT WILL RAIN
LESS AND LESS...
26 PAGES HORIZONS • VOLUME 1 • 2021IT'S
COMING.
I MUST
ACKNOWLEDGE –
THESE STONE
READERS CAN SEE
FURTHER THAN ME...
HOPEFULLY THEY
WILL BE ABLE TO PREPARE
US FOR THE MADNESS OF
THE SKIES!
THE YOUNGER
GENERATION
HAS A LOT OF
WORK TO DO...
THEY'RE FACING
A NEW WORLD...
WITH NEW
CHALLENGES...
PAGES HORIZONS • VOLUME 1 • 2021 27Young scientists speak about global
change sciences
st
Pa
PAGES interviewed three members of the PAGES
Pre
Early-Career Network who have been studying
sen
different topics in paleoscience. Alicja Bonk is an
t
assistant professor at the University of Gdańsk in
Poland; Stella Alexandroff is a research associate
at the University of Exeter in the UK; and Tamara
Trofimova is a researcher at the NORCE Norwe-
gian Research Centre and the Bjerknes Centre for
Fut
Climate Research in Norway. They gave us some ure
insights about their research but also their motiva-
tion for choosing to study paleoscience and how this
can help us prepare for the future. Why did you decide to become a paleoresearcher?
How has your education prepared you for paleo-
research?
Alicja: After my graduation I joined a research team
Alicja Bonk collecting which had different scientific interests from mine. It
samples from Lake cost me years of filling gaps in my knowledge and I
Żabińskie, northeastern still spend a lot of time learning, because new discov-
Poland (Photo credit: eries await. I didn't expect that paleoresearch would
Marcin Zięba, aka become my career but now I can't imagine doing
FINCH). something else.
Stella: I did not plan to do that from the beginning. I
followed my interests, and the many small choices
I made along the way led me to the field I am in
now. I studied ecology, which, although we heard
a lot about shifting baselines, did not really include
paleoresearch. It was through my diploma thesis
on fossil coral reefs that I eventually understood the
importance of the paleo aspect, and that is how I got
into studying past marine environments. I often feel
unprepared for it, but with solid research skills and
enthusiasm you can do just about anything.
Why should we study the Earth, ecosystems, and/or
climate history?
Alicja Bonk: Paraphrasing T.H. Van Andel: "Today is
the product of yesterday." There is no better way to Shell samples (ocean
express why we should study the Earth and its history. quahog, Arctica islandica)
By studying the past we can predict changes that are drying on the shore,
about to happen, estimate their range, and develop Lofoten islands, northern
strategies for future generations. Norway (Photo credit:
Tamara Trofimova).
Stella Alexandroff: We can only understand the
changes we are causing to the Earth system if we
have a baseline – a problem needs context. What
does the natural variability look like? How rapid are
the current changes? How will the system react? We
can answer these questions by looking into the past.
Tamara Trofimova: We know only a fraction of what
the world around us is really like, which is, by itself, a
good reason to learn more! By studying the history
of the Earth and life on it, we can better understand
nature, how our actions can affect it, and be pre-
pared for the future.
28 PAGES HORIZONS • VOLUME 1 • 2021Tamara: It is fascinating that we can study what the
world was like thousands of years ago and learn how
it has been changing through time! Much like detec-
tive work, we use small clues to reconstruct the big
picture and the course of events. I became interested
in paleoresearch when I learned how some organisms
Stella Alexandroff at
and their fossil remains can provide such clues and Rothera, Antarctica,
help us better understand past, present, and even during a research
future climate. I studied ecology and marine biology cruise off the Antarctic
and later focused on paleoceanography. My educa- Peninsula.
tion helps me to interpret paleorecords provided by
the organisms I use in my research.
end of a year in the "skeletal records". Through these
What is your research specialty? More generally,
records, we can learn how ocean and climate were
how is it useful?
changing through time and what are the mechanisms
Alicja: To talk about the dynamics of change, including controlling these changes.
abruptness and duration, a robust and accurate chro-
nology (arranging events in time order) is needed. How do you think your work can change the world?
My primary research specialty is constructing chro-
Alicja: I don't think my work alone is powerful enough
nologies based on lake sediments, which are incred-
but I believe that joint effort of (paleo)researchers
ibly important archives tracking environmental and
and society can influence the future of our planet.
climate changes.
There are examples of climate-environment-human
Stella: My research field is called sclerochronology – I interactions in the past which can be useful in tack-
study past marine climate variability using the annual ling today's problems. Education and innovative
banding and geochemical signals in clam shells. approaches will change the world.
Natural archives of past marine climate are needed
Stella: I believe in community effort, and I see my work
because instrumental records are very scarce and
as one piece of the puzzle. A network of records
only cover the past few decades. The great thing
across geographic regions and geological timescales
about our techniques in particular is that the records
is needed to improve our understanding of the envi-
we produce are very highly resolved (daily to annu-
ronment. It takes a village – or rather a global commu-
ally), they are absolutely dated, and can go back sev-
nity – of researchers from various backgrounds.
eral centuries or millennia. Thus, this is an incredibly
powerful and precise tool that can further our knowl- Tamara: My research helps to fill the gaps in our knowl-
edge and understanding of the history of marine edge of past climate, nature, and the processes
environmental changes. within it. My work might not change the world but can
change the way we see it.
Tamara: I study past marine climate and use clam shells
and coralline red algae in my research. While grow-
From a personal point of view, what would you like
ing, these organisms record ambient conditions in
to say to the younger generation about past, pres-
their carbonate skeletal structures (mollusks' shells
ent, and future global changes?
and thalli of algae), just like weather stations. By ana-
lyzing a physical and chemical composition of these Alicja: The Earth is a very dynamic and complex
structures, we can "read" their records and "extract" system and so are global changes. To reconstruct
environmental information on, for example, past the past, understand the present and predict the
ocean temperatures and salinity. These structures future, networking, collaboration and engaging the
also have annual bands similar to tree rings, which younger generation is necessary. It is crucial to ask
we use as a calendar marking the beginning and the tough questions and look for the answers beyond a
single discipline.
Stella: It can be difficult not to feel world-weary with
Tamara Trofimova
everything going on. The key is to seek out examples
examines a sample of of positive progress and nuggets of hope – they are
coralline algae during sometimes hard to find among a wealth of messages
a research cruise off the of doom, but they do exist. The climate movement is
coast of Svalbard one of them.
(Photo credit:
Tamara: There is much to learn from the past if we
Raymond Olsen).
want to know what the future might be. Although our
knowledge is limited, we know that the world around
us is changing at an unprecedented rate. If we want
to avoid dramatic consequences, we need to change
the way we act towards nature.
PAGES HORIZONS • VOLUME 1 • 2021 29You can also read