Hobsons Bay kerbside waste and recycling - One-year Review June 2021
←
→
Page content transcription
If your browser does not render page correctly, please read the page content below
Hobsons Bay kerbside
waste and recycling
One-year Review
                  June 2021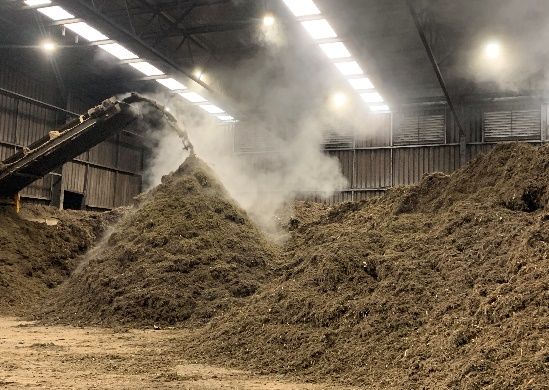
Hobsons Bay kerbside services: one-year review

Hobsons Bay City Council acknowledges the peoples of the
Kulin Nation as the Traditional Owners of these municipal
lands and waterways and pays respect to the Elders past,
present and emerging.

Executive summary ................................................................................................................................. 3
   A rigorous and extensive consultation process .................................................................................. 3
   Key outcomes and recommendations of the review: ......................................................................... 3
Purpose and scope of review .................................................................................................................. 5
   Kerbside waste and recycling, influences and impacts....................................................................... 5
Key performance outcomes from the four bin service........................................................................... 9
Community feedback ............................................................................................................................ 12
Consultation outcomes and method .................................................................................................... 12
   Methods and outcomes .................................................................................................................... 13
   Key demographic insights ................................................................................................................. 15
General rubbish (landfill) stream .......................................................................................................... 16
   Survey feedback ................................................................................................................................ 17
   System performance ......................................................................................................................... 18
   Recommendation and costings:........................................................................................................ 18
Food Organics and Garden Organics (FOGO)........................................................................................ 19
   A FOGO paper bag pilot .................................................................................................................... 20
Comingled recycling (yellow) stream .................................................................................................... 21
Glass recycling ....................................................................................................................................... 24
   Container Deposit Scheme ............................................................................................................... 25
Businesses and Council’s waste and recycling services ........................................................................ 26
Kerbside waste and recycling service – alternative scenarios .............................................................. 27
   A note on costs ................................................................................................................................. 27
   Costing assumptions ......................................................................................................................... 28
Aligned services and impacts ................................................................................................................ 29
   Dumped rubbish ............................................................................................................................... 29
Conclusion ............................................................................................................................................. 30

                                                                                                                                                         1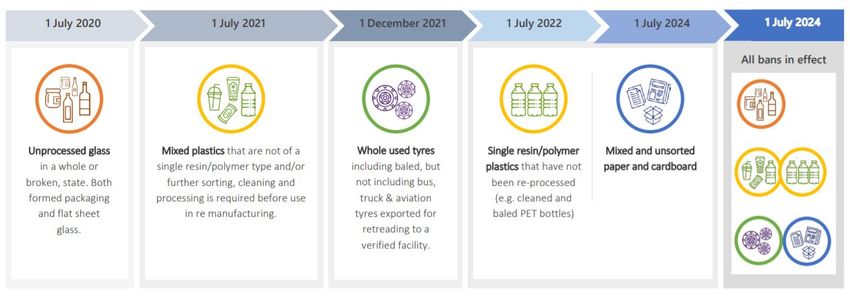
List of Figures
Figure 1: The new, market and regulatory context for Council's kerbside waste and recycling services       6
Figure 2 Key Impacts on HB's kerbside waste and recycling service                                          6
Figure 3 COAG Waste Export Bans Response Strategy: Waste export ban timetable                              7
Figure 4 Kerbside waste and recycling summary, 2020-21                                                     9
Figure 5: General Rubbish Summary, satisfaction and preference, Metropolis Research                      10
Figure 6: Total collection volumes, showing decreased landfill and increased recycling                   11
Figure 7 Key consultation methods and outcomes                                                           12
Figure 8: Notice of Motion (9 February 2021)                                                             13
Figure 9: Overall Satisfaction with kerbside services. Source: Metropolis Research.                      14
Figure 10: State government landfill levy over time ($ per tonne)                                        16
Figure 11: 2021 survey undertaken by Metropolis (including statistically significant random sample and opt
     in online survey)                                                                                   16
Figure 12: Average bin volumes – old and new services                                                    18
Figure 13: Mulching, Veolia                                                                              19
Figure 14 Monthly food and garden collection volumes                                                     19
Figure 15 From kitchen to kerbside – the use of paper and compostable bags                               20
Figure 16 Australian Paper Recovery facility                                                             21
Figure 17: Comingled recycling contamination over time – 2018, 2019, 2020, 2021 (estimated)              22
Figure 18: contamination identified by truck audits before and after bin contamination checks (Phase 1) 22
Figure 19: bin contamination inspections by round (Phases 1 and 2)                                       23
Figure 20 Monthly glass collection volumes                                                               24
Figure 21: Illegal dumping rates are steadily increasing in our local vicinity                           30
Figure 22: New kerbside system, Change model                                                             31

List of Appendices:
A Metropolis Household survey report
B Metropolis Business survey report
C Kerbside Waste and Recycling One Year Review - Performance Outcomes

                                                                                                          2
Executive summary
The waste and recycling industries have seen enormous changes in recent times as a result of new
State and Federal regulations and policies which have responded to a growing crisis in the sector.
One of the early consequences of the crisis was the collapse of SKM in July 2019.
SKM was Council’s comingled recycling provider. In response to SKM’s collapse and the wider sector
changes that were in train, Council introduced a four-bin kerbside waste and recycling service in
February 2020. Council’s new four-bin service is aligned with new State requirements, and is
meeting Council’s core objectives to reduce waste to landfill while providing an efficient and cost-
effective service to the community.
This report considers the first full year of operational outcomes against council and State objectives
and priorities. Importantly, it incorporates in-depth analysis of extensive community feedback on the
program. All four streams of the service to households and businesses are covered, to determine
what is working well and what can be improved.

A rigorous and extensive consultation process
Extensive engagement was an essential part of the review. As a major checkpoint on one of Council’s
most essential services, the cornerstone of the review was a statistically representative phone
survey undertaken with 500 residents (this provides feedback with a 95 per cent confidence
interval). An opt-in version of the survey was also offered to ensure all residents had the opportunity
to be heard. A similar survey was undertaken with Hobsons Bay businesses. In addition, 82 in-place
consultations were held with staff attending 14 locations across the municipality to hear from
residents in their daily lives. Three targeted focus groups were also held.
Overall, the survey feedback was very positive, with some clear areas of frustration with
opportunities for improvement. A key aspect of the engagement was the difference between the
statistically significant phone survey of a random sample of residents, and the opt-in online version
of the survey. The difference was reasonable and consistent, with respondents to the opt-in survey
on average less satisfied than the random sample. Survey experts Metropolis designed and delivered
the surveys, and advise that the random sample survey is the most representative of the entire
community’s feedback on the service.

 Phone survey best reflects community sentiment
 Research specialist Metropolis who undertook the survey work advises that the phone survey of a random
 sample of 500 residents is the most reliable indicator of overall community sentiment in Hobsons Bay. This
 feedback is at a 95 per cent confidence level. The opt-in online survey also provides very valuable feedback
 from residents who were motivated to provide feedback. Metropolis advises this is a very common outcome
 with opt in surveys.

Key outcomes and recommendations of the review:
Two main changes are recommended to the current service, and discussed in further detail
throughout the report:
    Extend the current ‘free upsize’ to a 240L general rubbish bin to all households.
    Pilot a paper bag for FOGO, as a precursor to extending to all households.
These options address the biggest pain points of the system for the community, being volume in the
rubbish stream and use of bags in the FOGO stream while still meeting the need to reduce landfill
and not significantly increase operational costs.

                                                                                                                3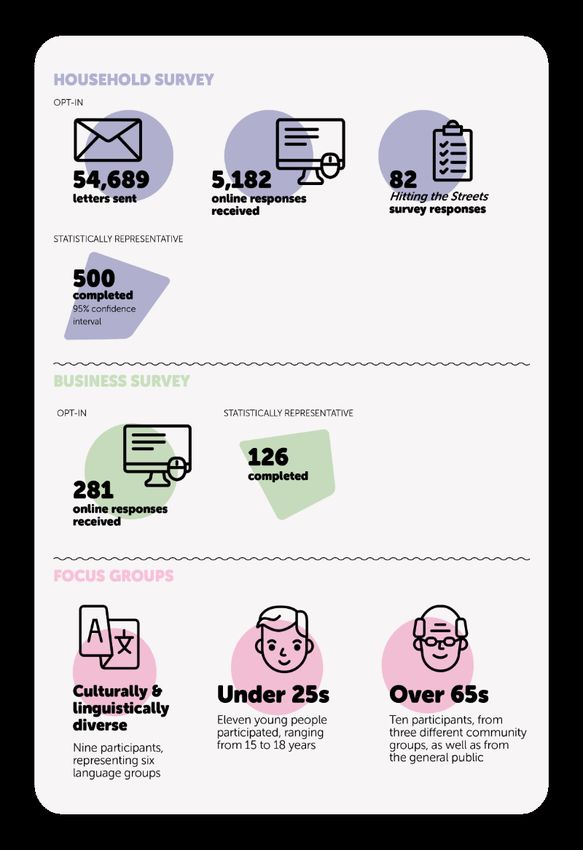
There are six broad observations coming out of the review.
    Engagement: The review achieved a high rate of community engagement with around 6,000
    respondents. Around 86 per cent of residents are satisfied with the service overall, and there is a
    significant group within the community who are particularly dissatisfied with the current
    standard general rubbish service.
    General rubbish: While the new service achieved a 33 per cent reduction in waste to landfill,
    around 40 per cent of households’ needs are not being met by the standard 120L garbage bin.
    The report recommends that the current ‘free upsize’ to a 240L general rubbish bin that was
    introduced on a temporary basis during COVID lockdowns be extended to all households on an
    ongoing basis. This options retains the gains of the new service in diverting substantial FOGO
    volumes from landfill, while supporting households that need more volume in their general
    rubbish stream.
    Food Organics and Garden Organics: There has been good uptake of the food and garden waste
    service, which accounts for the bulk of the diversion from the general rubbish stream. There are
    some barriers that many residents experience around odour and mess from food organics, in the
    absence of compostable bags. There are opportunities to address these issues and potentially
    further increase the recovery of food organics through piloting and then rolling out paper bags
    to FOGO.
    Comingled recycling: Contamination levels are high in the comingled recycling stream. The
    report recommends continuing to work to reduce contamination with ongoing general
    education programs and another round of targeted bin checks. Council will continue to work
    with our comingled delivery partner to increase local recycling options for more products.
    Businesses A small number of Hobsons Bay businesses (16 per cent) currently utilise Council’s
    waste and recycling service predominantly for general rubbish and comingled recycling. The
    report recommends allowing businesses to opt out of using one or more bins to reduce misuse
    and storage requirements of unused and unwanted bins. This is recommended alongside
    consideration of stronger enforcement or removal of service in hotspot areas.
    Glass recycling: Glass recycling is improving the recovery rates of comingled materials, and
    providing a separate resource stream. Contamination is low, and the community is largely
    supportive of the new collection stream.
A range of opportunities for change were considered, following community and council feedback.
These include options (and combinations of options) such as: reintroducing a weekly garbage service
for part or all of the year, switching FOGO to a fortnightly service for all or part of the year, more
limited access to a free garbage upsize, and a free upsize to 240L of any one stream for each
household.
While these other alternatives have not been recommended, further information on these options is
detailed in Table 1 on page 27 of this report.

                                                                                                      4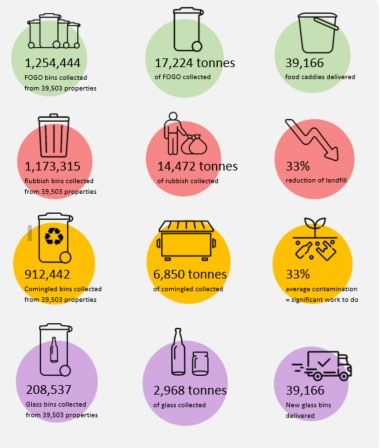
Purpose and scope of review
Council’s new kerbside waste and recycling program has been in operation since February 2020. The
program was rolled out in the context of a crisis in the waste sector following SKM’s collapse. As a
result it drew on extensive previous community consultation on the Waste and Litter Strategy 2025,
and some fast, opt-in feedback run via Council’s Participate consultation page and provided through
a range of other forums.
An interim review of the program was considered in June 2020, in the midst of the first COVID-19
pandemic lockdown, with Council endorsing ongoing monitoring and review of garbage performance
data and volumes over the first year of the service. Following a full year of operation, this review
considers the performance outcomes of the first year of operation and the community’s feedback on
the new program.
The purpose of the review is to assess the current service offering and the outcomes of the program
against council and State objectives and priorities alongside a much more thorough engagement
with the community now the program is established.
The Kerbside Waste and Recycling Service Review covers all four streams of the kerbside service,
which is a mandatory service for households and an opt-in service for businesses. It considers:
•     Capacity, frequency and performance of each stream
•     System outcomes
•     Community attitudes and behaviours
A key consideration of the review is satisfaction with the new system by both household and
business users. The review included an extensive community engagement process with feedback
from around 6,000 respondents. Detailed information on the engagement is provided through this
report and the appendices. The survey aspects of the engagement included both phone surveys
undertaken with a statistically significant sample of residents and businesses, as well as opt-in
surveys for both residents and businesses.
The review was undertaken in the first half of 2021, in parallel with the 2021-22 council budget
process. Cost implications of the recommendations of the review have not been reflected in the
2021-22 Waste Service Charge, and if implemented will be caught up through future Waste Service
Charge increases.

Kerbside waste and recycling, influences and impacts
Council’s new kerbside recycling and waste service commenced in February 2020. The service
brought forward key elements of Council’s Waste and Litter Management Strategy 2025 (adopted
August 2019). The strategy sets out a vision to provide leadership and empower the community to
deliver innovative and collaborative solutions to waste and litter management within Hobsons Bay.
Development of the strategy coincided with the China Sword crisis and SKM Recycling collapse. The
strategy provided a response to the recycling crisis, which resulted from SKM Recycling closing
down, and strong community responses seeking Council to act swiftly to develop a solution to this
crisis and strengthen recycling in Hobsons Bay.
Bringing implementation of the new recycling and waste program forward enabled a response to the
SKM Recycling crisis and strong community feedback seeking Council act quickly to develop a
sustainable recycling solution for Hobsons Bay. On 8 October 2019, Council endorsed the immediate
rollout of a revised waste and recycling service, including four bins for kerbside source separation, a
focus on local recycling and resource use, a revised kerbside collection schedule, and an intensive
community engagement program.

                                                                                                     5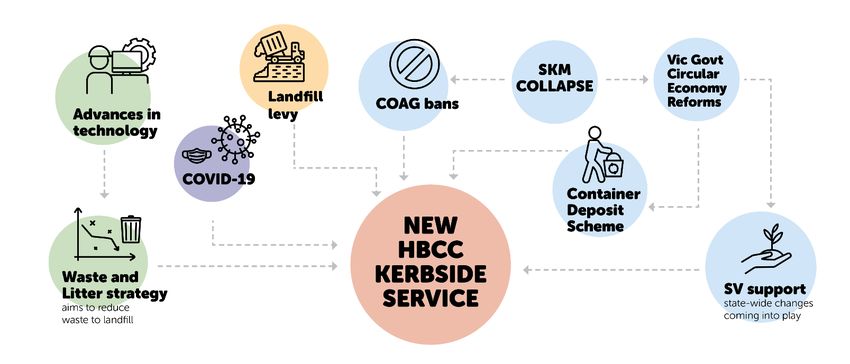
The SKM Recycling crisis revealed systemic problems in the recycling sector and presented an
opportunity to accelerate localised sustainable solutions in Hobsons Bay. The market and regulatory
context has significantly changed in response to the recycling crisis. Council’s new kerbside program
delivered a new waste and recycling service with substantial changes in the context of significant
sector and all level government change (Figure 1).
The aims of the new waste and recycling service include:
    •    Reduce the amount of waste being sent to landfill, with a focus on food waste that made up
         approximately 35 per cent of the weekly garbage stream
    •    Diversify and implement local solutions with local suppliers and local markets that can adapt
         to change. Expand the types of items accepted in the recycling stream over time.
    •    Improve the quality of recyclables
The aims and approach align with the directions of the Victorian Government’s circular economy
policy, Recycling Victoria, a new economy, announced in February 2020.

 Figure 1: The new, market and regulatory context for Council's kerbside waste and recycling services

 Figure 2 Key Impacts on HB's kerbside waste and recycling service

                                                                                                        6
Recycling Victoria, a new economy
The State Government released the Recycling Victoria, a new economy policy as part of the circular
economy reform introduced in February 2020. A circular economy seeks to design out waste,
reducing the environmental impacts of production and consumption whilst enabling economic
growth through reuse of materials and products. The reforms address the increasing volume of
waste, and aim to deliver a State with reduced waste and pollution, and improved recycling
outcomes whilst also creating a stronger economy. The reforms include requiring all councils to
move to a four-bin service by 2030.
As more councils come on board to the four-bin system, there will be greater consistency across the
state supported by state-wide campaigns to reinforce and promote recycling objectives. The policy
includes targets of a 15% reduction in waste generation per capita and increase of waste recovery to
80%.
COAG bans
The Council of Australian Governments (COAG) imposed export bans on waste paper and plastics,
which impact the way waste and recycling is processed in Australia. The bans will be implemented in
a phased approach with all bans in effect by July 2024. The bans respond, amongst other drivers, to
the introduction in 2018 by China of its National Sword Policy which restricted recyclable material
imports. The bans aim to boost Australia’s onshore processing and manufacturing and drive local
technological advancements in resource recovery and recycling.

Figure 3 COAG Waste Export Bans Response Strategy: Waste export ban timetable

Landfill levy
The cost of Victoria’s landfill levy is increasing each year and will almost double by 2022-23 (see
Figure 10: State government landfill levy over time ($ per tonne) for the landfill levy cost over time).
The increasing landfill costs have a significant impact on waste budgets across all Council’s state-
wide. Reducing volumes collected through the kerbside system provides improved environmental
outcomes and reduced budget implications.
Council’s Waste and Litter Management Strategy 2025 outlines the aim of increasing the amount of
waste diverted from landfill from the household waste service to 54 per cent by June 2022. The first
year of the new program has diverted 33 per cent of waste from going to landfill. Opportunities to
further reduce the amount going to landfill and minimise the impact of the increasing landfill levy
will continue to be explored.

                                                                                                       7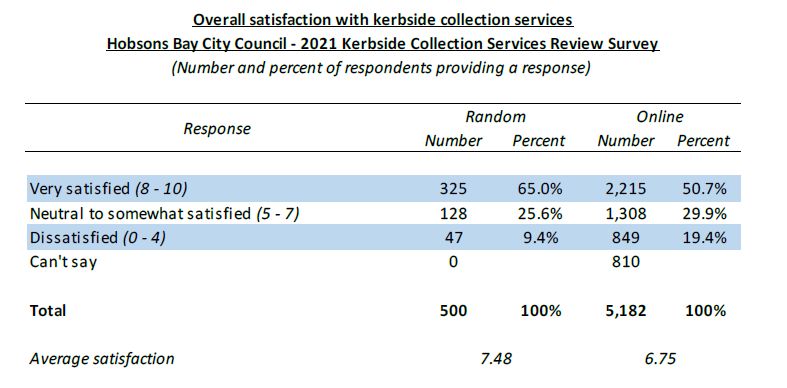
Impacts and variables in 2020:
The new service was introduced one month prior to the first Victorian lockdowns in response to the
Covid-19 pandemic. The pandemic has changed the way we live, particularly in Victoria with reports
indicating a 10-to-20 per cent increase 1 in rubbish and recycling volumes as a result of stay-at-home
measures. Extensive engagement programs were undertaken to inform and educate the community
on the changes introduced by the new kerbside program. Implementation of the new service was
impacted by the lockdowns with face to face engagements revised to online where possible and
increased social media and print engagement undertaken.
    Hobsons Bay has one of the lower Waste Service Charges

    Based on financial benchmarking of Victoria’s 79 councils and looking at waste charges, Hobsons Bay sits in
    the lower quarter. While there are differences between councils, in tailored offerings (e.g. upsizing or
    downsizing, opt-in streams, etc, in every municipality), this is a good indication that Hobsons Bay (being an
    early adopter of the new four-bin system) is offering better value to its residents than many other councils.

1
 Australian Council of Recycling: ‘Coronavirus pandemic sees household waste rise with resurgence of single
use plastic’, ABC, August 2020 & ‘Lockdown’s a load of rubbish: Recycling fear as household waste spikes’,
SMH, April 2020

                                                                                                                    8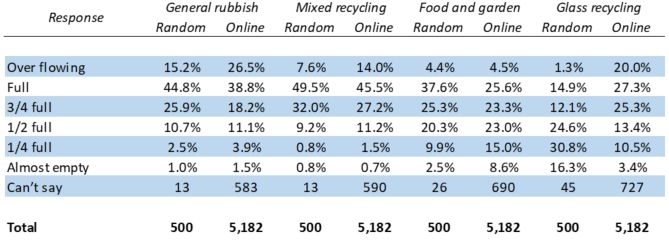
Key performance outcomes from the four bin service
The first year of Council’s new kerbside waste and recycling program has:
•   Reduced landfill by 33 per cent
    7000 tonnes
•   Increased FOGO by 9,500
    tonnes (124 per cent)
•   Increased comingled recycling
    by 11 per cent
•   Highlighted contamination
    issues in the comingled stream
•   Introduced a dedicated glass
    recycling stream with 2,968
    tonnes collected with very low
    (less than five per cent)
    contamination rates
•   Achieved an excellent
    satisfaction level for a first year
    change, with 86.4 per cent of
    residents satisfied overall with
    Council’s service (i.e. rated
    satisfaction at 6 or more out
    of 10)
The new program introduced
significant change, including
introduction of FOGO to all
                                           Figure 4 Kerbside waste and recycling summary, 2020-21
households; a new dedicated glass
bin; revised frequency of collection for the general rubbish stream; and reduced items accepted in
the comingled stream. Given the extent of change, the performance outcomes of the initial months
indicate a transitional period borne out in the data across all streams. Extensive engagement
programs were undertaken to inform and educate the community on the changes; however, these
were impacted by the Covid-19 pandemic lockdown restrictions.
Setting aside the first few transitional months the new service has seen a significant reduction in
landfill of 7,000 tonnes or 33% annually. Figure 5 below shows the reduction in landfill alongside the
significant increase in FOGO. Figure 6 indicates the settling of volumes in the general rubbish stream
following the initial transitional months.
One of the highest impacting changes of the program (based on community feedback) was the
change to the rubbish stream collection frequency. With the introduction of a weekly FOGO and
increased recycling collections the new program changed the collection of rubbish from weekly to
fortnightly. This change has elicited the highest amount of feedback. Bin fullness checks indicate
approximately 80 per cent of bins had sufficient capacity. However, given the base service is based
on 120L bin capacity adjusting this analysis to include households who have upsized to a 240L bin
approximately 40 per cent of households are struggling with the 120L bin capacity. This aligns with
the presentation rates of the vast majority of households who present their rubbish bin every
collection cycle. As a result of the Covid-19 pandemic lockdowns a free upsize to a 240L bin was
offered to all large households of four or more and those with medical needs. Of the just over 8,000

                                                                                                     9
eligible households that qualify for a free upsize 59 per cent (just under 5,000) have responded to
the offer.
The random sample feedback indicates the majority of residents are satisfied with the general
rubbish stream service, with the current system the most preferred by respondents. As noted
previously, the opt in survey records lower levels of satisfaction on most topics including the general
rubbish stream, as respondents are those most motivated to provide feedback (ie, most satisfied or
dissatisfied). However, a number of respondents are dissatisfied with the size of the general rubbish
bin, and not all of these indicated they are prepared to pay additional costs to have a larger bin. Key
satisfaction data included:
• An average satisfaction score for bin sizes of 6.54 out of 10.
• An average rating of bin collection frequency of 6.44 out of 10.
• 62.2 per cent of respondents indicated that they would prefer a fortnightly garbage service if
the bin was 240L.
Figure 5: General Rubbish Summary, satisfaction and preference, Metropolis Research
Online Survey (Score out of 10) Random Survey (Score out of 10)
Bin Size Satisfaction (Average) 4.97 6.54
Collection Frequency Satisfaction (Average) 4.60 6.44
Preferred Collection Frequency if 240L bin Online Survey (%) Random Survey (%)
Weekly 39.4 34.5
Fortnightly 49.4 62.2
Monthly 7.6 3.3
Other 3.5 0.0
TOTAL RESPONSES 5,182 500
The introduction of a weekly service would have a cost for every household of in the order of
$40 per year (increasing further as the landfill levy increases). This is one of the factors that has been
considered in weighing up the recommended approach with the garbage stream to retain a
fortnightly service with a larger capacity.
The new kerbside program introduced the collection of food organics as a new service across the
municipality and the collection of green organics to all households. The previous service was offered
as an opt-in green only collection service, with over 60 per cent of households registered as opting
into this service.
There has been a good uptake of FOGO resulting in a significant reduction in the volume of landfill.
Figure 6 indicates an increase of 9,500 tonnes or 124 per cent annually. The increase is likely to be
higher than a normal year, given the impact of COVID-19 lockdowns (more people at home
generating food waste during the day, and potential more time gardening), combined with an
unseasonably wet summer.
10The new kerbside service Figure 6: Total collection volumes, showing decreased landfill and increased recycling
did not change the volume
or collection frequency of
the comingled stream Total Collection (tonnes)
however, the items that 45,000
were accepted in the 40,000 Green waste / FOGO
comingled bin did change. 35,000 7,715 7,685 17,224
The review has highlighted 30,000 - Glass
the need for significant 25,000 9,850 7,143
ongoing work to reduce 1,692 2,968
20,000 3,485 Recycling (not
contamination in this 3,366
15,000 landfilled)
stream. Education and
10,000 20,721 21,588
contamination assessment 14,472 Recycling (whole
programs including bin 5,000 loads landfilled)
inspections, truck audits -
Garbage
Dec 2017 to Jan 2019 to Feb 2020 to
and communication
Dec 2018 Jan 2020 Feb 2021
campaigns are resulting in
improved contamination
outcomes (on average
from 38 per cent contamination to 33 per cent contamination, equating to a roughly 13 per cent
reduction), however, it will take time.
The initial transitional months of the new service saw significant glass contamination in the
comingled stream. Data after April shows low glass contamination, as the community adjusts to the
new requirement of separating glass. Comingled volumes once adjusted to include glass (which was
previously included in the comingled bin) show an increase of 11 per cent volume.
The weekly 120L FOGO service is preferred by the majority of residents. While the uptake of FOGO
has been high there is also concerns about odour and mess with the service not accepting
compostable bags. This is exacerbated by the fact some other councils (with alternative FOGO
recycling partners) do accept compostable bags.
The service introduced a new glass only bin for all households. After the intial transitional months
where glass contamination was high in the comingled stream the glass service has been postive.
Glass has very low contamination rates and high community satisfaction levels. The presentation
rates are low for glass bins with 58 per cent of residents not presenting their bin each month
indicating there may be an opporutity for sharing options for some households, for example multi-
unit developments may not require a bin per unit. There is also an opporutnity to continue to
explore higher end use of the collected glass.
Council’s kerbside service is designed to meet the needs of residents. However it is also offered to
businesses as an opt-in service. Most businesses do not use Council’s waste and recycling services as
it does not meet their needs. For many of the 16 per cent of businesses who do use the service,
many have requirements that differ from residential needs with feedback with higher utilisation of
the general rubbish and mixed recycling bins. Contamination assessments of comingled commercial
bins indicate similar contamination levels to residential bins apart from slightly higher glass
contamination. An issue for some businesses is storage of bins, with frequent complaints about
visible contamination, amenity issues, and bins accessible in laneways leading to inreased
contamination and illegal dumping.
11Community feedback
Recommendation:
Council acknowledges a very high level of engagement from this process, including more than
6,000 individual responses. Overall strong satisfaction with system, with improvements identified
to better meet the needs of all households.
Community feedback informs all decisions affecting Council services. Community views are reflected
in the principles of the Waste and Litter Strategy 2025 and the practice of being early adopters of a
four-bin service in Hobsons Bay to address the recycling crisis and opportunities to reduce waste to
landfill.
Council’s four-bin service has been in operation for just over a year. Transitional issues – of major
behaviour change and operational efficiencies – are largely behind us. The service is now embedded,
albeit one of many services effected by the pandemic and lockdowns. After a year of service,
community views were again sought to inform this review.
Consultation outcomes and method
Figure 7 Key consultation methods and outcomes
• Achieved a high rate of engagement,
with more than 6,000 individual
respondents through a variety of
methods
• Random household survey, with
statistically relevant sample, with
95 per cent confidence interval
• Opt-in online household survey, one of
the highest response rates of recent
surveys
• Both surveys indicate the significant
majority of residents report ‘good’-to-
‘very good’ satisfaction levels with the
overall service (average of 7.48 out of a
potential 10 from random household
survey respondents).
• Responses show a clear difference in
sentiment between those who are
highly engaged with waste and
recycling and those who are more
passive users.
• There is a subset of the community
dissatisfied with the current standard
general rubbish service.
12The results show that the community is positive about the kerbside service, and that there is a
segment of the community who are less satisfied – offering room for adjustment.
Methods and outcomes
To promote the opportunity to contribute feedback through the online survey, Council conducted
the following activities set out in a Notice of Motion (Feb 2020), Figure 8: Notice of Motion (9 February
2021). Council also undertook a range of further engagement activities, including a statistically
significant random sample phone survey, extensive in place consultations with residents in locations
across the municipality, and several focus groups.
Figure 8: Notice of Motion (9 February 2021)
As one part of the Recycling 2.0 review, Council:
1. Ensure that all members of the community are aware of the opportunity to provide input as part of the
review of our Waste and Recycling system by sending a mail out to all residents and ratepayers
providing the link to an online survey.
2. To minimise consultation costs while still enabling households without Internet access to participate, on
request (e.g. by phone or in-person), provide a hard copy survey and a reply-paid envelope by mail to
residents / ratepayers.
3. Ensure the online survey has a mechanism to limit responses to one per household while maintaining
anonymity (e.g. unique login code).
4. Make arrangements to enable non-English speakers, as well as other people who may need additional
support, to understand and respond to the survey.
5. Ensure the survey includes questions to understand:
a. Household demographics including suburb, dwelling type, number of residents per household, age
and any circumstances that have a particular impact on waste and recycling needs (e.g. babies in
nappies; health needs; pets)
b. Satisfaction rating overall for the waste and recycling system, as well as for each of the four waste
and recycling services/bins, including a brief description of the current service.
c. Desired collection frequency for each of the four waste and recycling services/bins with existing
default bin sizes.
d. Desired collection frequency for general waste collection and FOGO if a 240L bin was provided. If
weekly collection is desired with a 240L bin, seek to understand the reasons for this.
e. If only one bin could be collected weekly or up-sized (due to costs), what household’s preference
would be?
f. How often, on bin collection night for each bin, residents observe rubbish overflowing for either
their own or their neighbour’s bins
g. Whether residents would like compostable bags to be included in their FOGO service. If compostable
bags were provided, understand whether this would impact their use of the bin / desired collection
frequency for FOGO.
h. Willingness to pay an additional cost for more frequent general waste collection / or a bin upsize
(including providing an estimate of the annual cost increase for weekly collection for each service).
i. Any other comments that respondents would like to make
6. Engage an expert in survey question design to, prior to distribution, review the draft survey for clarity.
7. Conduct a separate consultation to understand the Waste and Recycling needs of businesses across
Hobsons Bay
Household survey
A household survey was designed by a consultant research specialist and conducted using two
methods:
131. A random-sample telephone survey of 500 respondents drawn proportionally from across the
municipality, conducted by research specialist Metropolis Research, returning a 95 per cent
confidence level.
2. An open-access online survey, open for completion by all residents and ratepayers of the City of
Hobsons Bay, with 5,182 respondents.
There was a significant difference in the views of online respondents and randomly selected
respondents. The self-selected online survey respondents were measurably and significantly less
satisfied overall than the random sample survey respondents. The research specialist supporting
Council on this provided the following explanation on the difference between the two surveys:
The difference reflects the fact that residents had to make a conscious choice to log onto the
Council website and complete the online survey, whereas for the residents approached to
complete the random sample survey, they did not select themselves, and only had to passively
agree to participate. This ensures that they are more reflective of the underlying community.
This is the strength of the statistically robust, random-sample research as compared to an open-
access, self-selecting consultation such as the online survey.
There is a role for both sets of results in understanding the views of the Hobsons Bay community.
The random sample survey provides a statistically robust and reliable understanding of the
views of the underlying Hobsons Bay community (including being fully weighted by suburb, age,
and gender). The self-selected online survey respondents reflect the views of the sub-set of the
Hobsons Bay community who are more actively engaged in the issues around waste and
recycling services, particularly those who have a more negative view about these services.
Figure 9: Overall Satisfaction with kerbside services. Source: Metropolis Research.
Focus groups
To ensure all voices were heard in the feedback, Council ran three one-hour sessions targeting
harder-to-reach segments of the community including culturally and linguistically diverse (CALD);
over-65s; and under-25s.
These sessions were adapted from the household survey questions. They were conducted by a
consultant research specialist along with Council officers.
The focus groups provided additional input including:
1. Over-65s, with 10 participants representing three community groups and the public
14Echoed the general compostable bag feedback; seeking options for soft plastics collection;
weight of glass bins; creating a narrative to explain costs of the waste and recycling services.
2. Culturally and linguistically diverse, with nine participants from six language groups
Suggested targeted promotion of the service; more information on the collection schedule as
well as what to put into the bins; and concerns regarding renters whose landlords are unwilling
to pay for increased service, locked into standard service offering.
3. Under-25s, with 11 young people ranging from 15 to 18 years in age
Suggested customising the Recycling 2.0 phone app; bin security issues; and useability to
encourage FOGO bin usage.
In place, Hitting the Streets consultations
To provide an additional forum for feedback Council officers went out to 14
different locations (shopping hubs, parks, foreshore, school drop areas) and
asked random passers-by a set of five questions. Answers were captured
anonymously from 82 individual sessions. Feedback from these sessions
indicates overall satisfaction and satisfaction with the four bin streams is
positive: Glass recycling 7.7, Mixed recycling 7.6, Food and garden waste 7.4,
General rubbish 6.8 with Overall satisfaction 7.3. The overall satisfaction levels
are sitting at slightly lower than the statistical survey (7.48) and higher than the
online opt in survey (6.74).
Business survey and face-to-face engagements
To understand the waste and recycling needs of businesses in Hobsons Bay and the experiences of
businesses using Council’s service, a survey was conducted using two methods:
1. A consultant research specialist conducted a random telephone survey of 126 businesses, 80
per cent used Council’s service.
2. Council hosted an open-access online survey open to local businesses, which received 281
responses.
Council officers engaged directly with business operators in areas where waste issues are reported,
and attended trader association meetings to promote the opportunity to provide feedback via the
online survey.
Key demographic insights
There were some differences in the demographic profile observed between the two household
surveys including:
• The opt-in online survey respondents were notably more likely to be living in flats, units, and
apartments than the random telephone survey respondents.
• Large households have been over-represented and small households under-represented in both
surveys in comparison to demographic data.
• Owner-occupiers have been over-represented and renters significantly under-represented in
both surveys, but more noticeable in the self-select online survey.
Whilst these slight demographic differences are important to note they are not the reason for the
differing views between the online and random survey. The random telephone survey is a
statistically representative survey reflecting the views of the entire Hobsons Bay community. The
opt-in online survey reflect the sub-set of the community who are sufficiently engaged (often, but
not always negatively) with the issues around kerbside collection services.
15General rubbish (landfill) stream
Recommendation:
• That the option to switch to a 240L general rubbish bin at no additional charge be extended to
all households.
The overarching goal of the Hobsons Bay Waste and Litter Strategy 2025 is “to set directions and
innovative actions for waste and litter management in Hobsons Bay which focuses on avoiding,
reusing and recycling waste and litter rather than disposal to landfill”. This reflects the growing
financial and environmental costs of landfill to the community.
Figure 10: State government landfill levy over time ($ per tonne) The State Government’s landfill levy
will steeply increase the cost of
200 landfill (Figure 10). Council is
150 committed to introducing innovative
alternatives to landfill including waste
100 to energy (Strategy 3.1 of the Waste
and Litter Strategy 2025), when those
50
options come online in coming years.
- While it still has a significant carbon
2011–12 actual
2012–13 actual
2013–14 actual
2014–15 actual
2015–16 actual
2016–17 actual
2017–18 actual
2018–19 actual
2019–20 actual
2020–21 actual
2021–22 actual
2022–23 actual
2023–24 trend
2024–25 trend
2025–26 trend
footprint, waste to energy’s carbon
footprint is far lower than landfill. In a
waste to energy scenario, the aim will
be to reduce landfill volume.
At the local government level, the levers to reduce landfill volume are constrained as we do not
control state and national supply chains and product standards. For example, for as long as plastics
code 3, 4, 6 and 7 which have almost no local recycling pathways are allowed to be used for
products and packaging, all those products and packaging will end up in the landfill stream.
Kerbside review findings
Figure 11: 2021 survey undertaken by Metropolis (including statistically significant random sample and opt in online survey)
While the kerbside program has achieved a 33 per cent reduction (7,000 tonnes) in annual landfill, it
is clear that the reduction in volume in the landfill stream is causing a volume challenge for many
households. The kerbside review has found that:
16• Based on bin fullness inspections, up to 40 per cent of households’ needs are not being met by
the standard 120L garbage bin. This includes 22 per cent of bins that are over-full on the
kerbside and 16 per cent of households that already have a larger bin.
• In the random sample kerbside review survey, 15.2 per cent of households reported that their
garbage bins are overflowing (statistically significant sample to a 95 per cent confidence
interval). See Figure 11: 2021 survey undertaken by Metropolis (including statistically significant
random sample and opt in online survey).
• In the opt-in kerbside survey (which as noted previously reflects a level of interest from some
residents, but as an opt-in survey is not as statistically robust or reflective of the entire
community), 26.5 per cent of households reported an overflowing garbage bin. See Figure 11:
2021 survey undertaken by Metropolis (including statistically significant random sample and opt
in online survey).
Survey feedback
There is significant variation in satisfaction levels between the statistically representative
sample and the online survey for the general rubbish bin. Metropolis suggests this is because
there is a group who are very dissatisfied the general rubbish bin service.
Capacity
Without considering cost, households report approximately a 65 per cent satisfaction level (with
a 95 per cent confidence interval) with the size of the garbage bin. By contrast, the opt in survey
respondents report approximately 50 per cent satisfaction. The significant difference in this
feedback reflects the fact that there is a group in the Hobsons Bay community who are very
dissatisfied with the small size of the general rubbish bin. See Figure 5: General Rubbish
Summary, satisfaction and preference, Metropolis Research.
Frequency of collection
Without considering cost, households report approximately 64 per cent satisfaction level (with a
95 per cent confidence interval) with the frequency of collection, compared with 46 per cent in
the online survey. See Figure 5: General Rubbish Summary, satisfaction and preference, Metropolis
Research.
Feedback factoring in costs
When average per-household costs were included in the question, the survey indicates a strong
preference for a fortnightly garbage service. See page75-6 of Appendix A.
• 72.6 per cent of respondents to the random sample (95 per cent confidence interval) preferred
a fortnightly 120L or 240L service.
• 60.7 per cent of the online opt in survey preferred a fortnightly 120L or 240L service.
• By contrast, only 14.4 per cent (statistically significant random) or 11.6 per cent (opt-in sample)
preferred a weekly service.
17System performance
The reduction in overall landfill is a very positive Figure 12: Average bin volumes – old and new
outcome. At a system wide level, the average per services
household volume has gone from a weekly bin with
69 litres of garbage, to a fortnightly bin that has 99 litres.
However, based on survey feedback and bin fullness
checks, it is clear that there is considerable variation in
volume between households with some households using
considerably more or less than the average.
Interventions to improve the user experience of the
FOGO stream may slightly reduce the average garbage
volume, as some households are currently reporting they
have been bagging FOGO and disposing of it in the waste
stream.
Recommendation and costings:
Given the strong community feedback about the waste stream noted above, it is recommended that
a larger bin be made available to all households at no additional charge. This option is lower cost
than the reintroduction of a weekly service, and continues to ensure the best possible recycling and
recovery rates are achieved with a continued weekly FOGO service.
There is a cost associated with a larger bin which will need to be met through the waste service
charge over time. This includes two elements. First, sector leader Sustainability Victoria reports that
when presented with a larger 240L bin, on average households produce 7 per cent 2 more waste
than with a smaller 120L bin. This therefore increases the tonnes of volume to landfill. There is also a
materially higher lift rate charged by kerbside operators for a larger bin.
The actual cost of an open free garbage bin upsize across the municipality may vary, for three
reasons. First, the last 15 months included substantial periods of lockdown during the COVID-19
pandemic. During those times most households were generating substantially more waste in their
kerbside bins as more people were at home during the day; waste which might normally be going
into waste streams at workplaces, schools, and childcare centres. Secondly, it is often difficult to
predict what actions people might take based on survey results and demographic projections. For
example, with the current free COVID-19 upsize, approximately 60 per cent of eligible households
have taken up the offer. Finally, the free upsize offered to households with nappies, medical needs,
or four or more people living in the house during COVID-19 has already provided larger bins to many
of the households experiencing the greatest need.
However, a conservative cost estimate of this recommendation is in the order of $0.48m per year,
plus a one off capital cost of $0.37. This equates to an annual $12 per household increase through
the waste charge. This includes the following assumptions:
• A total of 40 per cent of households (approximately 16,000 households) take up the option.
• The approximately 5,900 households currently using an upsized bin (including second 120L bins,
paid upsize, and free COVID-19 upsize) would not require a new bin.
• The average volume of landfill for upsizing households will increase by fifteen per cent.
2
Page 24, Fig 3, Victorian Local Government Annual Waste Services Report 2018-19
18Food Organics and Garden Organics (FOGO)
Recommendations
• Pilot the use of paper bags with a view to rolling out across the municipality.
• Increase communication and engagement on odour/mess options.
• Work with Council’s contractor to ensure all opportunities for odour and mess reduction
are explored.
Council’s new kerbside program introduced the collection of food organics as a new service across
the municipality and the collection of green organics to all households. The previous service was
offered as an opt-in green only collection service. The number of FOGO bins in service increased by
47 per cent with the introduction of the new service. The availability of a food and garden waste
service for all households has been a significant contributing factor to the reduction in landfill of the
new program.
Figure 13: Mulching, Veolia There has been good uptake of the service, with a 124
per cent increase in annual volume collected. Our
processing partner, Veolia, reports low contamination
rates (5.11 per cent), but also a low proportion of food
(2 per cent to 6 per cent) – which means there is still
an opportunity to increase the food waste through the
FOGO stream and further reduce landfill volumes.
FOGO collections always contain mostly garden
organics, with a small portion of food organics, and this
is also predicted to continue in Hobsons Bay where
there is a substantial majority of homes with gardens.
Discussions with FOGO processing partners indicate the
average food organics in the Hobsons Bay FOGO stream is between 2 and 6 per cent (varying
seasonally), with a goal to achieve an average at the higher end of this range. Obviously, as noted,
the year in review is unusual for FOGO given the impact of both COVID-19 lockdowns and an
unseasonably wet summer season.
There is strong community Figure 14 Monthly food and garden collection volumes
support (69.6 per cent) for
the current food and garden
waste model of a 120L
collected weekly. Residents
prefer a weekly collection for
food and garden waste to
reduce the potential for odour
and mess, and weekly
collections are more likely to
lead to higher recovery rates
of food and garden waste.
Feedback received indicated
some residents are not using
the FOGO stream as putting
food waste in bins loose (not bagged) creates mess and odour which is a deterrent from recycling
19food. There is some significant seasonal variation in FOGO so many households will have fuller bins
in spring and summer from garden material. However, there is clearly an opportunity for further
engagement to increase use of the stream.
In particular if more options are available to contain mess and smell, there is an opportunity to
recover more food from garbage and divert more waste from landfill. As well as a paper-bag trial,
Council will continue to work with our contractor to ensure all opportunities for odour and mess
reduction are explored.
A FOGO paper bag pilot
A pilot is proposed to explore a range of paper bag products, and inform the full roll out of the
option to use paper bags to contain food organics. It is proposed that the pilot be run as an opt in
model, with participants capped at a maximum of 2,000 households, running for approximately
six months. Feedback from the pilot will be used to inform a potential full roll out, and to design the
full roll out model. A range of options are possible with further work to be done to confirm the right
model for Hobsons Bay. These include for example:
• A user pays model where households purchase the bags they need.
• A subsidised model where all households pay for the cost of bags through the waste service
charge regardless of how many they use.
• A combination model where some bags are provided free (once, or on an annual basis), with
households that require additional bags purchasing them.
A range of the above models are in use across councils in Victoria. Indicative costings suggest that
costs could range from a small saving through to up to $0.5 m per year.
Figure 15 From kitchen to kerbside – the use of paper and compostable bags
Food and garden waste is relatively new in Victoria, and while councils transition to a universal service (by 2030),
currently there are a variety of models in use, including opt-in.
Of 24 metropolitan councils currently offering some form of food and / or garden collection service, 13 do not accept
biodegradable ‘plastic’ bags, while nine do. Councils that do allow bags have their own distribution models, which
includes an initial supply (at no additional cost to the resident) upon roll-out of the food and garden waste service.
Residents purchase their own bags thereafter.
Some Councils keep a supply available for purchase, others promote places of purchase.
While the use of plastic bags increases the likelihood of residents recycling food waste, it also leads to higher
contamination.
To test whether paper bags reduce odour and mess sufficiently to increase the uptake of food recycling, with
continued low contamination in Hobsons Bay, this review is recommending a trial of paper bags (which are accepted
by our processing partner, Veolia) to contain food organics, with a view to these becoming a permanent option.
20Comingled recycling (yellow) stream
Recommendations:
• Continue to work to reduce contamination in the comingled stream, including:
o Ongoing general education program to improve community understanding of what can be
recycled.
o Another round of targeted bin checks (with supporting communication).
o Continuing to work with comingled delivery partner to increase local recycling options for
more products.
The comingled recycling stream presents the greatest ongoing challenge to the kerbside service. For
many years poor quality recycling was shipped overseas with little transparency about outcomes.
Council’s Waste and Litter Strategy 2025 included actions around increasing local recycling, which is
now being achieved through Council’s partnership with APR (Council’s comingled recycling
contractor – Australia Paper Recovery). However, contamination levels have been high, and while
education programs have had a material impact more work is needed.
Survey feedback
Overall feedback on the comingled stream is very positive, which is unsurprising given there has
been no change to capacity or frequency of the comingled stream with the new kerbside service.
Approximately 87 per cent of random survey respondents report they are satisfied with the
fortnightly frequency of collection (86 per cent of the opt in survey). Approximately 96.5 per cent of
random survey respondents report they are happy with the 240L capacity of their comingled bins
(75.7 per cent in the opt in survey). A relatively small proportion of residents report that their
comingled bin is regularly overflowing (7.6 per cent of the statistically representative sample and
14 per cent of the opt in survey respondents).
Around 80 per cent of comingled bins are presented to the kerbside each fortnight. The comingled
stream has also generated relatively low free text responses in the surveys. The majority of issues
identified in comments were to do with missed bins; a small number of respondents identified
confusion over what can be recycled. While survey comments on the bin contamination inspection
program were low in number, and both positive and negative, Council does receive some enquiries
and concerns from residents about this program.
System performance
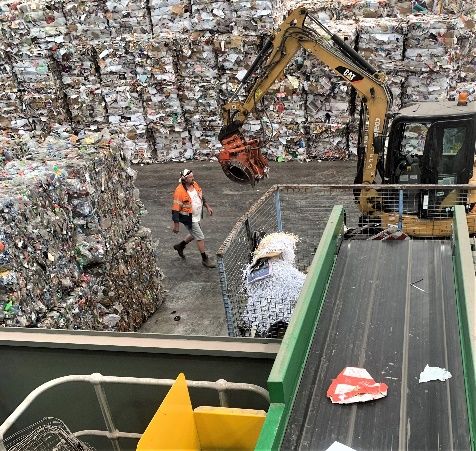
There are three sources of data on contamination. The most Figure 16 Australian Paper Recovery facility
reliable is truck audits. These sort a random sample of material
in trucks and categorise and weigh the contents. The only data
point that is possible at the household level is bin
contamination checks which are being rolled out across the
municipality. These provide visual data on what is visible in the
bin. It is possible to do full household bin audits but these are
costly and not practical to roll out at a whole of municipality
level. The third source of data is information that comes from
providers. This includes high level / visual inspection feedback
(indicative but not precise), costings based on diversion rates,
and periodic audits.
Overall contamination has been high, particularly in 2020 which
was a transition year compounded by the impact of COVID-19
21restrictions. Figure 17 provides a comparison of comingled streams before and after the change. As
glass was the heaviest element of the previous comingled stream, the separate glass and comingled
streams must be added to make a true comparison. Based on the first few months of 2021,
combined contamination for the 2021 calendar year will be around 28 per cent. In practice as we are
seeing comingled contamination levels gradually reduce, it is likely that the 2021 result will be lower.
Figure 17: Comingled recycling contamination over time – 2018, 2019, 2020, 2021 (estimated)
10000 119
894 1397 105 Glass
648
8000 2020
1692 Recycling
3348 398
6000
Contamination (whole load)
8956 4028
4000 2105
6495
Contamination (processed
2000 landfilled)
2850 2511
Glass contamination 4%
0
2018 (reported) 2019 (reported) 2020 (actual) 2021 (estimate from
3 months' actual)
One of the big changes with the new service is that APR is focused on achieving local (Australian)
recycling users, rather than offshoring material. There are a number of products such as UHT milk
and juice containers which do not currently have a local recycling pathway – providers who are
accepting these are sending them offshore. However, at the start of the program, APR and Council
committed to seeking more local options over time. Over the course of 2020, Council’s comingled
recycling partner APR was able to secure a local recycling outcome for plastic code 5 – which is
commonly used in packaging such as yoghurt and butter / margarine containers, and ice cream
containers. APR and Council continue to explore opportunities to increase the items accepted in the
comingled stream.
Bin inspection program
As noted above, the bin inspection program Figure 18: contamination identified by truck audits before and after bin
is the only way Council has been able to contamination checks (Phase 1)
provide tailored feedback at a household
level. The program is being rolled out in Truck audits - overall outcomes
groups of suburbs, over three comingled 100%
bin cycles. The first cycle checks all bins, the 38% 33%
80%
second and third cycles checks only those
bins which had significant contamination in 60% 8%
8% 4%
5%
the previous cycle. Stickers and information 40% 30%
are provided to households. While the 29%
program only checks what is visible on the 20%
20% 24%
top of the bin, it is a valuable source of 0%
information for householders, and appears 2020 2021
to be having an impact. Paper Cardboard
Aluminium cans and foil Plastics
Truck audits undertaken before and after Contamination
the program (for the Phase 1 suburbs
already completed) indicate that total
contamination has reduced from 38 per cent to 33 per cent – a 13 per cent improvement. See Figure
18Figure 18: contamination identified by truck audits before and after bin contamination checks
(Phase 1).
The highest contaminants include bagged materials (many households still place recyclables in a
plastic bag – not realising the entire bag will go to landfill on the sorting line), paper and cardboard
22You can also read