Heavy Metals and Nutrients Loads in Water, Soil, and Crops Irrigated with Effluent from WWTPs in Blantyre City, Malawi - MDPI
←
→
Page content transcription
If your browser does not render page correctly, please read the page content below
water
Article
Heavy Metals and Nutrients Loads in Water, Soil, and Crops
Irrigated with Effluent from WWTPs in Blantyre City, Malawi
Raymond S. Malikula, Chikumbusko C. Kaonga *, Harold W. T. Mapoma                                 , Fabiano G. D. Thulu
and Petra Chiipa

                                          Physics and Biochemical Sciences Department, Malawi University of Business and Applied Sciences (MUBAS),
                                          P/Bag 303, Chichiri 312225, Blantyre 3, Malawi; reoraymond@gmail.com (R.S.M.);
                                          hmapoma@poly.ac.mw (H.W.T.M.); fthulu@poly.ac.mw (F.G.D.T.); pchiipa@poly.ac.mw (P.C.)
                                          * Correspondence: ckaonga@poly.ac.mw; Tel.: +265-888-855-399

                                          Abstract: Heavy metals may cause acute and chronic toxic effects to humans and other organisms,
                                          hence the need to treat wastewater properly, as it contains these toxicants. This work aimed at
                                          assessing zinc, copper, cadmium, and chromium in water, soil, and plants that are irrigated with
                                          effluent from Manase and Soche Wastewater Treatment Plants (WWTPs) in Blantyre, Malawi. Atomic
                                          Absorption Spectrophotometry (AAS) was used to assess the heavy metals. Heavy Metal Health Risk
                                          Assessment (HMHRA) on plants (vegetables) around both WWTPs was also conducted. Average
                                          daily dose (ADD) and target hazard quotients (THQ) were used to assess HMHRA. Physicochemical
                                          parameters were determined using standard methods from American Public Health Association
                                          (APHA). The heavy metal ranges were below detection limit (BDL) to 6.94 mg/L in water, 0.0003 to
                                          4.48 mg/kg in soil, and 3 to 32 mg/L in plants. The results revealed that plants irrigated with effluent
                                          from WWTP had high values of aforementioned metals exceeding the Malawi Standards and WHO
                                permissible limits. Furthermore, the health risk assessment values showed that vegetables consumed

                                          for a long period of time from Manase WWTP were likely to cause adverse health effects as compared
Citation: Malikula, R.S.; Kaonga,         to those from Soche WWTP.
C.C.; Mapoma, H.W.T.; Thulu, F.G.D.;
Chiipa, P. Heavy Metals and               Keywords: heavy metals; health risk assessment; wastewater; biological parameters; wastewater
Nutrients Loads in Water, Soil, and       treatment plants
Crops Irrigated with Effluent from
WWTPs in Blantyre City, Malawi.
Water 2022, 14, 121.
https://doi.org/10.3390/w14010121
                                          1. Introduction
Academic Editor: Stavroula Tsitsifli           Wastes generated from industries, homes, marketplaces, and any other areas need
Received: 29 September 2021               to be treated to avoid polluting the environment. According to Kalulu et al. [1], many
Accepted: 13 November 2021                developing countries lack the infrastructure for waste treatment. In some instances, this is
Published: 5 January 2022                 due to lack of land caused by high population growth. Other countries struggle to treat
                                          wastes in their existing centralized wastewater treatment systems due to dysfunctional
Publisher’s Note: MDPI stays neutral      equipment and inadequate treatment capacity. This leads to an appropriate-to-partial
with regard to jurisdictional claims in
                                          treatment, which later affects the water bodies they are discharged in [2]. It is worth noting
published maps and institutional affil-
                                          that sewage effluent may lead to increase in levels of biochemical oxygen demand and
iations.
                                          nutrient loads in water bodies. The Government of Malawi established dumping sites, such
                                          as landfills and wastewater treatment facilities, to combat these problems. The facilities
                                          are only established in the cities. In Blantyre, there are three main WWTPs, namely Soche,
Copyright: © 2022 by the authors.
                                          Limbe, and Manase (Blantyre) [3].
Licensee MDPI, Basel, Switzerland.
                                               In Malawi, like many developing countries, wastewater generation has increased
This article is an open access article
                                          mostly due to rapid population growth and urbanization, which have resulted into treat-
distributed under the terms and           ment facilities failing to keep up with the demand. Most of the treatment facilities in
conditions of the Creative Commons        Malawi are either old, non-functional, or their efficiency is greatly compromised due to
Attribution (CC BY) license (https://     numerous challenges. For example, it was observed that Soche WWTP had only one
creativecommons.org/licenses/by/          trickling filter (out of three) working at the time this study was being conducted. Limbe
4.0/).                                    WWTP was not functional due to a broken sewer line feeding the plant from the source,

Water 2022, 14, 121. https://doi.org/10.3390/w14010121                                                      https://www.mdpi.com/journal/water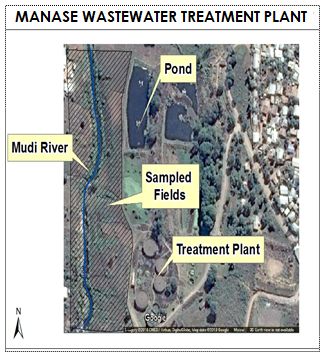
Water 2022, 14, 121 2 of 13
and Blantyre/Manase WWTP had all the three trickling filters not working due to blockage
and vandalism. At Manase (Blantyre) WWTP, it was only stabilization ponds that were
working, but they were in poor condition. The reasons that resulted in non-functional
WWTPs were overloading due to the handling of larger volumes of wastewater than the
intended capacity and lack of financial muscle to support rehabilitation. Due to the afore-
mentioned challenges, these WWTPs contribute to water-quality degradation of water
bodies in Malawi [4].
The reuse of wastewater for irrigation is a common phenomenon across the globe [5,6]
for sufficient food production and combating of water scarcity. Regulation standards on
minimum water quality for reuse in agriculture were established by the European Union
to avoid challenges that emanated from the reuse of wastewater in irrigation [7]. The
challenges are based on the composition and origin of the wastewater, as it has multiple
sources, including hospitals, residential areas, and industrial areas. The composition of
wastewater affects the growth of different plants positively; on the other hand, they may
be a source of dangerous pollutants, such as heavy metals (zinc, cadmium, chromium) that
bring disruption of complex biochemical cycles, which may threaten the survival of plant
and animal life, including humans [2].
The term “heavy metals” refers to metals that often create a number of challenges
when released into the environment [8]. Heavy metals are environmental pollutants due
to their toxicity, persistence, and bioaccumulative nature. Examples of such heavy metals
include zinc (Zn), copper (Cu), iron (Fe), manganese (Mn), cadmium (Cd), chromium (Cr),
and others. Although some of them are also essential to plants for their growth, on the
other hand, they mostly become harmful at high concentrations. However, some heavy
metals, namely cadmium (Cd), lead (Pb), and chromium (Cr), are even harmful at low
concentration. Heavy metals are not the only problem in wastewater effluent, as it may
also contain phosphates, nitrates, and pathogens. Nitrate and phosphate are also necessary
nutrients for the growth of plants; however, high concentration of these in surface and
ground water is harmful to the environment and could cause serious problems to aquatic
life [9,10] due to their ability to cause eutrophication. Nitrates can also harm human beings.
Consequently, the concentration of nitrates in potable water is limited to 50 and 10 mg/L
for adults and babies, respectively [11]. Phosphate generally arises from the elemental
phosphorous and affects water quality by the disproportionate development of algae,
and its excessive concentration results in the eutrophication process, which decreases the
amount of dissolved oxygen in aquatic systems [10].
Due to the dangers posed by partially treated wastewater for irrigation, it is always
important to monitor its composition. Therefore, what necessitated this study, apart from
the fact that partially treated wastewater is released into surface water bodies, is that raw
effluent is also used at times to irrigate crops by small-scale farmers. These crops, for
example, vegetables, apart from being consumed by the farmers, are also sold in local
produce markets, which poses a danger to the locals.
2. Materials and Methods
2.1. Description of Study Area
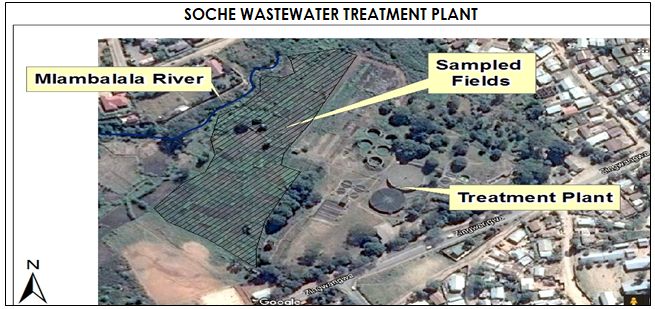
Figure 1 is map of Blantyre City showing rivers that surround Manase and Soche
WWTPs. It also shows sampling fields, rivers, and the position of the aforementioned
treatment plants. The fields are irrigated with effluent from the WWTP before discharge
into Mlambalala River. These WWTPs are managed by Blantyre City Assembly (BCA). The
outcome from one facility shows a good picture of results from other facilities since they
are managed by one institution.
2.2. Collection of Crop Samples
Plant samples were collected from the fields that are located within the Soche and
Manase WWTPs. The crop plants collected were maize (Zea mays), Chinese cabbage
(Brassica chinensis), and pumpkin leaves (Telfairia occidentalis). The crops were sampled
Water 2022, 14, 121                                                                                                           3 of 13

                                    randomly from the upper, middle, and lower parts of the farmers’ fields. These crops are
                                    irrigated with wastewater from Soche and Manase WWTPs, respectively. The crops were
                                    washed with de-ionized water to remove any debris. Next, the samples were collected in
    Water 2021, 13, x FOR PEER REVIEW                                                                              3 of oven
                                    polyethylene bags. Thereafter they were taken to the laboratory, where they were    13

                                    dried. The oven-dried samples were then stored for further analysis.

         Figure 1. Map of Blantyre showing rivers that surround Manase and Soche Wastewater Treatment Plants and boundary
                                    Figure 1. Map of Blantyre showing rivers that surround Manase and Soche Wastewater Treatment
         of Blantyre city and aerial view showing sampled fields, the rivers, and positioning of the two WWTPs, respectively.
                                    Plants and boundary of Blantyre city and aerial view showing sampled fields, the rivers, and
                                    positioning  of the
                                      2.2. Collection of two
                                                          CropWWTPs,
                                                               Samplesrespectively.
                                        Plant samples were collected from the fields that are located within the Soche and
                                2.3. Collection of Soil Samples
                                 Manase WWTPs. The crop plants collected were maize (Zea mays), Chinese cabbage (Bras-
                                 sica Soil samples
                                       chinensis),   were
                                                   and     collected
                                                        pumpkin      using
                                                                  leaves    a handheld
                                                                         (Telfairia        auger. The
                                                                                    occidentalis). The crops
                                                                                                       soil samples   were collected
                                                                                                              were sampled    ran-
                                randomly
                                 domly from at athe
                                                  depth  of 5middle,
                                                     upper,  cm to 30and
                                                                       cmlower
                                                                           in theparts
                                                                                   crop of
                                                                                         fields
                                                                                            the at the WWTPs.
                                                                                                farmers’          Then, the
                                                                                                          fields. These     samples
                                                                                                                         crops are
                                were  collected
                                 irrigated  with in  polyethylene
                                                   wastewater  frombags
                                                                    Socheand
                                                                           andtaken
                                                                                Manaseto the laboratory
                                                                                          WWTPs,         for further
                                                                                                    respectively.  Theanalysis.
                                                                                                                       crops were
                                 washed with de-ionized water to remove any debris. Next, the samples were collected in
                                 polyethylene bags. Thereafter they were taken to the laboratory, where they were oven
                                 dried. The oven-dried samples were then stored for further analysis.
Water 2022, 14, 121 4 of 13
The fresh soil samples were used to estimate microbes using membrane filtration
method. The rest of the soil samples were dried in an oven at 105 ◦ C for 6 h, then ground
and sieved through a 2-mm mesh sieve. The sieved samples were kept and sealed in
polythene plastic bags.
2.4. Collection of Water Samples
Effluent samples were collected using the grab sampling method. The effluent samples
were collected in strategic points, at the outlet of the WWTPs and inlet and outlet of the
fields. Temperature, pH, electrical conductivity (EC), and total dissolved solids (TDS) were
measured on-site [2].
2.5. Chemical Analysis
Instruments and Other Analytical Issues
The study used Atomic Absorption Spectrophotometry (Atomic Absorption Spec-
trophotometer AA-6200 model) to determine heavy metals [12], and Ultraviolet-Visible
Spectrophotometer (UV/VIS) model Spectronic 20, Milton Roy Company (Ivyland, PA,
USA), was used to determine phosphates and nitrates. Wagtech pH meter (serial # 1518360)
was used to determine pH and temperature, while EC and TDS were determined using
MP-4 EC meter (serial # M401468) [2]. BOD was determined by Winkler Method of oxygen
measurement in samples before and after incubation for 5 days at 20 ◦ C [13].
Sampling bottles were cleaned with 5 % HNO3 and rinsed with double-distilled water.
The samples were then sealed in sterilized glass bottles and then placed in a cooler box
with some ice blocks in order to keep the temperature at 4 ◦ C.
2.6. Analytical Methods
The study used the titrimetric method to determine COD (APHA 1995).
COD is given by:
( A − B) × M × 8000
O2
COD =
L V sample
where A = Volume of ferrous ammonium sulfate (FAS) used for blank (mL); B = Volume
of FAS used for sample (mL); M = molarity of FAS; and 8000 = milli equivalent weight of
oxygen (8) × 1000 mL/L.
Fecal coliforms were determined using membrane filtration method. A total of 1 mL of
each sample was diluted with distilled water in 9-mL test tubes; then, from these samples,
1 mL was taken into a 9-mL test tube while topping up the sample with distilled water.
Thereafter, 1 mL was taken from each sample and put under filtration, where 100 mL of
distilled water was added and filtered. The filtered papers were put in membrane pads,
which were soaked with 1.5 mL of broth, then later were incubated at 37 ◦ C.
Phosphate was determined by using the Vanadomolybdophosphoric acid colori-
metric method. Firstly, 10 mL of each sample was placed in a 50-mL volumetric flask.
Then, 10 mL of vanadate-molybdate reagent was added to the samples and diluted to the
mark with distilled water. Vanadate-molybdate reagent was prepared by mixing solution
A and solution B. Solution A was prepared by placing 25 g of ammonium molybdate,
(NH4 )6 Mo7 O24 ·4H2 O, in 300 mL distilled water. Solution B was prepared by heating up
and boiling 1.25 g ammonium metavanadate, NH4 VO3 , in 300 mL distilled water. Then,
the solution was cooled, and 330 mL concentrated hydrochloric acid (HCl) was added to it.
Next, solution B was cooled to room temperature before adding solution A to it and diluted
to 1 L with distilled water. The absorbance was measured from the samples at 470 nm
wavelength using a Spectrophotometer (Spectronic 20, Milton Roy Company, Ivyland, PA,
USA). Using standard solution values, a calibration curve was plotted, which was used to
determine the concentrations, which are recorded in the Table 1. Nitrates were determined
using Salicylate calorimetric method using a Spectrophotometer (Spectronic 20, Milton Roy
Company) [2].Water 2022, 14, 121 5 of 13
Table 1. Mean and standard deviation of nitrate, phosphate, physical, and biological parameters in effluent and soil at Manase and Soche WWTPs.
In Effluent
Dry Season Nitrate (mg/L) Phosphate (mg/L) Temp (◦ C) pH EC (µs/cm) TDS E. coli (CFU/g) Total Coliforms (CFU/g) COD BOD
Manase WWTP 39 ± 34 2 ± 0.2 17 6.9 ± 0.06 1224 ± 44 859 ± 28 185,800 ± 60,895 433,333 ± 194,415 195 ± 89 78 ± 45
Soche WWTP 37 ± 18 1.2 ± 0.5 22 7.66 ± 0.16 705 ± 2 479 ± 1 200,233 ± 82,323 647,000 ± 239,380 285 ± 86 69 ± 23
Rainy season
Manase WWTP 75 ± 56 1.4 ± 0.3 25 6.77 ± 0.18 450 ± 40 298 ± 28 111,466 ± 65,121 266,666 ± 30,550 137 ± 5 73 ± 30
Soche WWTP 445 ± 92 1.75 ± 0.12 26 6.98 ± 0.11 483 ± 23 320 ± 16 108,453 ± 40,896 408,666 ± 204,081 133 ± 0.6 73 ± 23
MW
50 0.15
(MS579:2013)
EPA 5 mg/L
In Soil Samples
Dry Season Nitrate (mg/L) Phosphate (mg/L) pH EC (µs/cm) TDS E. coli (CFU/g) Total Coliforms (CFU/g)
Manase WWTP 187 ± 175 649 ± 97 5.4 ± 0.22 1813 ± 43 1289 ± 33 171,000 ± 101,424 723,000 ± 547,029
Soche WWTP 84 ± 45 688 ± 174 5.54 ± 0.5 2409 ± 158 1752 ± 124 77,077 ± 21,752 723,000 ± 547,029
Rainy season
Manase WWTP 1.89 ± 0.14 567 ± 98 4.85 ± 0.21 1793 ± 14 1272 ± 10 1,887,266 ± 854,892 15,280,000 ± 19,505,856
Soche WWTP 12 ± 7 582 ± 106 4.78 ± 0.32 1769 ± 58 1255 ± 44 526,543 ± 227,594 253,233 ± 11,551Water 2022, 14, 121 6 of 13
2.7. Soil Analysis
After being ground, 20 g of soil was weighed and put in a beaker. Then, 50 mL of
calcium chloride was added to extract nitrates and phosphates. Next, the beaker was shaken
gently for 2 h and allowed to settle for a day and was filtered with 42-size Whatman filter
paper. pH, total dissolved solids, electrical conductivity, and temperature were measured
on the supernatant. Thereafter, nitrates and phosphates were analysed as explained earlier.
Heavy metals were analysed using APHA method [13]. A total of 3.0 g of each soil
sample was weighed and then digested with a mixture of 10 mL concentrated hydrochloric
acid (HCl) and 3.5 mL of concentrated nitric acid (HNO3 ). The mixture was left overnight
under a fume hood and the next day was heated for 2 h at 105 ◦ C. Thereafter, distilled
water was added, and the sample was filtered with Whatman filter paper. The filtrate was
topped up to 100 mL in a volumetric flask. Next, the sample was taken for analysis by
AAS machine.
For fecal coliforms, 25 g of each sample was weighed and put in 225 mL of distilled
water. Then, 1 mL from 225 mL was diluted in 9-mL test tubes with distilled water and
another 1 mL from the 9 mL was distilled further into 9 mL. Then, 1 mL of each sample
was filtered using a membrane, and 100 mL of distilled water was added and filtered. The
filtered membrane of each sample was put in 47-mm petri dishes that were first soaked
in broth; thereafter, they were put in an incubator, which was set at 37 ◦ C. The samples
were incubated for 18 to 24 h. After incubation, colonies were identified and counted. The
blue-colored colonies represented E. coli, while as the combination of blue, pink, and purple
represented total coliforms on the petri dishes. The colonies were counted three times on
each dish, and the mean value was recorded as a reading. The number obtained was then
multiplied by 100 mL then divided by the dilution factor.
2.8. Plant Heavy Metal Analysis
At the lab, the plant samples were further washed to remove any possible contami-
nants. They were then chopped into small pieces and oven dried at 60 ◦ C for 12 h. The
dried samples were then ground using a ceramic mortar.
A total of 1 g of each dried and ground sample was put in a crucible and transferred
to a furnace for 2 h to ash. Then, 5 mL of nitric acid (HNO3 ) was added to each sample and
boiled to almost dryness. Next, 10 mL of hydrochloric acid (HCL) was added and diluted
to 100 mL volume, which was then taken for analysis by AAS.
Microsoft Excel 2013 was used to come up with descriptive statistics, while as Analysis
of Variance (ANOVA) was used to compare results based on seasons and areas.
The potential health risks associated with long-term consumption of vegetables con-
taminated with heavy metals was assessed using the average daily dose (ADD) of heavy
metals [14] and target hazard quotient (THQ). Average Daily Dose (ADD) was calculated
using the formula below.
Ci × IR × ED
ADD =
BW × AT
where Ci is metal concentration in the vegetable; IR is ingestion rate (2.2 g/day); ED is
Exposure Duration (64 average life expectancy in Malawi); BW is body weight of consumer
(60 kg); and AT is average time (ED × 365 days/year) [15].
Target hazard quotient (THQ) is a ratio of the determined dose of a contaminant to
oral reference dose considered detrimental. If the ratio is greater than or equal to 1, an
exposed population is at risk [14,15]. This was calculated based on the formula below.
ADD
THQ =
Rfd
where ADD is the average daily dose, and Rfd is the reference dose. The health risk was assessed
in relation to its non-carcinogenic as well as carcinogenic effects based on the calculation of
ADD estimates and defined toxicity according to the relationships that follow [14,16].Water 2022, 14, 121 7 of 13
3. Results and Discussion
Firstly, the physicochemical parameters and microbiological issues for samples taken
in the WWTPs are presented and discussed. This is then followed by presentation and
discussion of heavy metals in water, soil, and plants. The section ends with a discussion on
the risk assessment of the heavy metal results. The results of the study are also compared to
WHO maximum permissible limits [17] and Malawi Standards (MS579:2013) [18] wherever
appropriate. This is in line with the main objective of the study, which is about heavy metal
and nutrient loads for samples from a wastewater treatment facility and the associated risks.
3.1. pH, Temperature, Electrical Conductivity, and Total Dissolved Solids in Effluent and
Soil Samples
As shown in Table 1, pH range in effluent at both Manase and Soche WWTPs was
within the WHO [17] limit and Malawi standards [18] but was high in dry season as
compared to rainy season. In effluent, pH registered a maximum mean value of 7.65 and a
minimum mean value of 6.77, as shown in Table 2. pH in soil samples was below WHO
permissible limit (6 to 9). Maximum mean value was registered as 5.5, and the minimum
mean value was 4.74, as shown in Table 1. This is an indication that the soil samples
in the study area are acidic. This pH range in soils is not conducive for the survival of
macro-organisms, like earthworms, who are irritated by low pH.
Table 2. Mean and standard deviation of heavy metals in water, soil, and plants at Manase and
Soche WWTPs.
Heavy Metals in Effluent (Water)
Rainy Season Dry Season
Cu (mg/L) Zn (mg/L) Cr (mg/L) Cd (mg/L) Cu (mg/L) Zn (mg/L) Cr (mg/L) Cd (mg/L)
Manase 0.298 ± 0.23 0.01 ± 0.009 BDL BDL 6.94 ± 0.41 0.41 ± 0.23 BDL BDL
Soche 0.236 ± 0.17 0.004 ± 0.004 BDL BDL BDL BDL BDL 0.55 ± 0.08
MW (MS
2 5 0.05 0.05 2 5 0.05 0.05
579:201)
WHO (1996) 0.017 0.2 0.05 0.05 0.017 0.2 0.05 0.05
Heavy Metals in Soil
Rainy Season Dry Season
Cu (mg/kg) Zn (mg/kg) Cr (mg/kg) Cd (mg/kg) Cu (mg/kg) Zn (mg/kg) Cr (mg/kg) Cd (mg/kg)
Manase 0.20 ± 0.2 0.159 ± 0.14 0.002 0.38 ± 0.05 0.48 ± 0.10 2.33 ± 0.75 2.32 ± 0.79 4.48 ± 0.26
Soche 0.114 ± 0.62 0.625 ± 0.47 0.0003 ± 0.0001 0.446 ± 11 0.87 ± 0.4 4.415 ± 5 0.062 ± 0.08 0.06 ± 0.07
WHO (1996) 50 36 100 0.8 50 36 100 0.8
Heavy Metals in Plants
Rainy Season Dry Season
Cu (mg/L) Zn (mg/L) Cr (mg/L) Cd (mg/L) Cu (mg/L) Zn (mg/L) Cr (mg/L) Cd (mg/L)
Manase 10 ± 6 25 ± 15 11 ± 11 12 ± 4 12 ± 7 32 ± 19 15 ± 15 14 ± 4
Soche 3±1 39 ± 13 14 ± 5 4.7 ± 4.8 0.8 ± 0.3 14 ± 5 17 ± 11 7±5
WHO (1996) 10 0.6 1.3 0.02 10 0.6 1.3 0.02
Temperature was within the range of 17 ◦ C to 25.9 ◦ C, as shown in Table 1. High
values were recorded in rainy season as compared to dry season both at Manase and Soche
WWTPs. Minimum mean value in effluent was registered at 17 ◦ C, and the maximum
mean value was 25.9 ◦ C. High values of temperature affects the values of BOD and COD
since it enhances the growth of bacteria [19].
In effluent, TDS and EC registered high mean values in dry season as compared to
rainy season, as shown in Table 1. Broad array of chemical contaminants are shown in
water through presence of TDS.
In soil, for TDS the minimum mean value was 1289 ppm, and the maximum mean
value was 1752 ppm, as shown in Table 1. There was not much difference in terms of TDS
for rainy and dry season in soil, as shown in Table 1. EC in effluent registered a maximumWater 2022, 14, 121 8 of 13
mean value of 1224 µs/cm and a minimum of 450.4 µs/cm, as shown in Table 2. EC plays
an important part in plant growth; higher values of EC mean less availability of water to
plants even if the soil is wet. The plants compete for water with ions in solution; hence,
irrigating with water containing high EC values reduces yield [20].
3.2. Fecal Coliform
On fecal coliforms, both Manase and Soche WWTPs registered high values for E. coli
and total coliforms, which were above WHO permissible limits. The high values were
noted in mostly dry season as shown in Table 1. The presence of fecal coliforms is an
indicator of potential health risk for people who are exposed to the water [21]. Data from
prospective epidemiology studies in Israel and USA on spray or sprinkler irrigation, which
used wastewater, suggest that ≤105 fecal coliform bacteria per 100 mL was safe from
causing infections transmitted through direct contact or aerosols from wastewater to the
farm workers or nearby community, but values ≥106 cause excess bacterial infection [22].
The study established that most of the values were ≥106 , which poses threat of bacterial
infections. These high values are also an indication that the wastewater treatment plants
are deteriorating; hence, they need attention because their efficiency is reducing. High
values are due to poor performance of the system, as it is failing to remove or reduce these
biological parameters.
Results also show that total coliforms in effluent were higher in dry season at Soche
and Manase WWTPs than in rainy season, as shown in Table 1. This is attributed to warm
water, which encourages multiplication of bacteria. In the soil, total coliforms concentration
was high in rainy season at Manase WWTPs as compared to dry season. According to
Hong et al. [23], external environmental factors, such as precipitation and location, affect
the concentration levels of coliforms, which could be the case at Manase and Soche WWTPs.
In rainy season, surface water run-off washes away all the dirt along its pathway and
deposits it into the system, which also contributes to high levels in the soil. The results
further showed high E. coli levels in soils as compared to water in both rainy and dry
season. Similar studies have found that apart from the human tract, E.coli can also survive
and reproduce in soil and sand in subtropical temperatures [24]. High concentration of
these bacteria is a threat to human beings, as they can cause diseases, such as dysentery,
diarrhea, urinary tract infections, and kidney failure in children.
3.3. BOD
The value of BOD upstream (Mlambalala and Mudi Rivers) was within the WHO
permissible limit of 20 mg/L at both Manase and Zingwangwa WWTPs, as shown in
Table 1. On the other hand, the BOD values in the rivers after effluent release points were
above WHO and Malawi permissible limits, as shown in Table 1. The high BOD values
in the rivers after the effluent release points are an indication that the WWTPs are not
efficient. Most of the organic matter that enters the WWTPs is leaving the systems without
being removed. This in turn increases the oxygen demand by bacteria in the receiving
waters to break down the organic matter aerobically. At the end of it all, the BOD values
of such kinds of waters is very high and in most cases exceeds the maximum permissible
limits. High levels of BOD were also recorded at Kauma WWTP in Lilongwe Malawi [25],
which potentially could negatively impact the receiving waters [2]. High values of BOD
are an indication that the water is polluted with organic matter; as such, it could indicate
incomplete treatment of sewage at the WWTPs. When the BOD is high, some organisms
that cannot survive at low oxygen levels suffer in water [25].
3.4. COD
On COD, the study found that the results exceeded both the Malawi standard per-
missible limit and the WHO maximum permissible limit, as shown in Table 1. High
concentration of COD shows that the presence of oxygen for aquatic life is at stake in
these rivers where effluent is fed, as it indicates the presence of organic compounds inWater 2022, 14, 121 9 of 13
water [26]. High COD indicates high oxidizable organic materials, which reduces oxygen
levels, hence jeopardizing aquatic life growth in streams. It is also an indication that the
rivers are polluted. Both the BOD and COD levels imply that the WWTPs efficiency has
decreased, and there is a need for maintenance to improve the system, as it poses a threat
to the environment in particular aquatic life.
3.5. Nitrate in Water Sample
The study registered high values of nitrates as shown in Table 1. This correlates with
results of BOD discussed earlier, which points to the fact that the WWTPs are not efficient.
The WWTPs are not able to remove organic matter or organic nitrogen compounds. In
an efficient system, the nitrogen compounds (in the form of ammonium compounds,
nitrites, and nitrates) are supposed to end up being released as nitrogen gas mostly to the
atmosphere. However, the non-efficient WWTPs release nitrogen compounds with no or
very little removal rate. This then translates to high nitrates and other nitrogen forms in
effluent. In effluent, high mean concentration of nitrates were observed in rainy season.
There was no significant difference in nitrate levels between the two WWTPs (p > 0.05).
High concentration of nitrates is dangerous to human health, as it causes diseases, such as
methemoglobinemia [21]. According to Grant et al. [27], ingestion of high levels of nitrates
by pregnant women could cause abortion.
Nitrate in Soil Samples
In soil samples, the results for nitrates were different from that observed in effluent.
High mean values were observed in dry season both at Manase and Soche WWTPs. During
this season (dry), farmers who cultivate close to these WWTPs (Manase and Soche) use
effluent from the treatment plants, and there is no excessive dilution, as is the case in rainy
season. The effects of nitrate at Manase WWTP are clearly seen, as some of the ponds are
covered with plants to the point that the situation calls for the deployment of workers to
remove them. This is a sign of eutrophication, which can harm aquatic ecosystems.
Nitrate in soil samples in rainy and dry season at Soche WWTP showed that there
was no significance difference (p > 0.05), while, when compared between WWTPs (Manase
and Soche), the results also showed that there was no significant difference (p > 0.05).
Nitrate in effluent samples in rainy season showed that there was a significant differ-
ence (p > 0.05) between Manase and Soche WWTPs unlike in dry season, which showed no
significance difference (p < 0.05).
3.6. Phosphates
Phosphate values in effluent were above Malawi standards and WHO maximum
permissible limit, as shown in Table 1. High levels of phosphate in effluent increase algae
and aquatic plants growth, which can choke water ways [21]. The study showed that Mudi
and Naperi River are at a high risk of eutrophication; hence, aquatic organisms could be
affected due to a potential depletion of oxygen levels arising from eutrophication since
phosphates are a limiting nutrient in that their concentration in water determines whether
there will be eutrophication or not.
The study observed that there was not much difference in phosphate values in rainy
season as well as in dry season for both Manase and Soche WWTPs, as shown in Table 1.
The mean concentration values observed exceed Malawi standard maximum permissible
limit. Phosphate in soil samples showed no significant difference between the two sites
both in rainy and dry season (p > 0.05). Similarly, in effluent the trend for phosphates was
the same.
3.7. Heavy Metals
In soil, it was observed that the mean concentration of cadmium at Manase WWTP
exceeded WHO and Malawi standard permissible limits, as shown in Table 2. The other
heavy metals were below permissible limits in both WWTPs. This was attributed to theWater 2022, 14, 121 10 of 13
source of the wastewater, which feeds this WWTP. Manase WWTP receives wastewater
from an industrial area (Makata) of the city of Blantyre.
In plants (vegetables), the study observed that the mean concentration of heavy metals
was very high in the two WWTPs in both seasons. The values were above Malawi standard
and WHO permissible limits, as shown in Table 2. The results showed that high values were
obtained in dry season as compared to rainy season, as shown in Table 2. Masona et al. [28]
and Namezi (2012), who did a similar study in Semnan, Iran, found similar observations.
According to Masona et al. [28], wastewater increases the levels of heavy metals in plants
and soil. These heavy metals are transferred to the plants when they absorb water from
the soil.
As shown in the box plots in Figure 2, median values in plants were high as compared
to those in soil and effluent in both WWTPs. Chromium Inter Quantile Range (IQR) was
also higher in plants than in soil and water. This clearly shows that plants have more
Water 2021, 13, x FOR PEER REVIEW 10 of 13
pollutants in their system than both soil and water. Zinc concentration levels in water at
Manase had a wider range, with a median of 4 mg/l, unlike at Soche WWTP, which is
almost negligible. On the other hand, zinc range in plants at Soche is wider than Manase,
withnegligible.
a median Onof the10other
andhand, zinc range in plants
13, respectively. at the
In soil, Soche is wider
range thanhigher
is also Manase,atwith
Sochea than
median of 10 and 13, respectively. In soil, the range is also higher at Soche than Manase
Manase WWTP. The median of heavy metals in water and plants was higher at Manase
WWTP. The median of heavy metals in water and plants was higher at Manase than Soche
than Soche WWTP. Overall, Manase WWTP had higher concentration of heavy metals than
WWTP. Overall, Manase WWTP had higher concentration of heavy metals than Soche
Soche
WWTP.WWTP.
This isThis is because
because the WWTP
the Manase Manase WWTP
receives 70%receives 70% of its
of its wastewater wastewater
from industries from
industries [4]. that
[4]. The fact Theheavy
fact that heavy
metals weremetals were
detected detected
in both in both
the WWTPs in the WWTPsincluding
all samples, in all samples,
including vegetables,
vegetables, poses to
poses a danger a danger to consumers.
consumers. High levels ofHigh
heavy levels of in
metals heavy
plantsmetals
found inin plants
found
this in thisare
study study are attributed
attributed mainly to mainly toeffluent
the use of the useinofirrigation.
effluent in irrigation.
Figure
Figure 2. Box plots Box plots
2. metal
of heavy of heavy
concentration metal
(mg/L) concentration
at Manase and Soche (mg/L) at Treatment
Wastewater Manase and Soche Wastewater
Plants.
Treatment Plants.
3.8. Health Risk Assessment
Average Daily Dose (ADD) and Target Hazard Quotients (THQ) were also deter-
mined in this study. The results are shown in Tables 3 and 4 below. There were no signif-
icant differences (p > 0.05) in ADD values for Manase and Soche WWTP, an indication that
the level of exposure (the dose) to heavy metals by consuming vegetables from each of theWater 2022, 14, 121 11 of 13
3.8. Health Risk Assessment
Average Daily Dose (ADD) and Target Hazard Quotients (THQ) were also determined
in this study. The results are shown in Tables 3 and 4 below. There were no significant
differences (p > 0.05) in ADD values for Manase and Soche WWTP, an indication that
the level of exposure (the dose) to heavy metals by consuming vegetables from each of
the individual sites was the same. There were also no significant differences (p > 0.05)
in THQ values between Manase and Soche WWTPs. However, the results show that at
Manase WWTP all the THQ values were greater than 1 except for chromium, while for
Soche WWTP, only the cadmium value was greater than 1. The values of THQ that are
greater than 1 are an indication that there is a high health risk to those who consume these
vegetables that are irrigated with effluent, as heavy metals are well known carcinogens. The
accumulation of heavy metals, which translates to THQ values to being greater than 1, has
also been reported by Zhou et al. [29] in China. On the other hand, vegetable accumulation
of heavy metals is also dependent on the concentrations found in soil, as reported in a
study by Sulaiman et al. [30] in Malaysia, which found low heavy metal levels, translating
to THQ values of less than 1 for vegetables grown in an agricultural area.
Table 3. Average Daily Dose (ADD) and Target Hazard Quotient (THQ) at MANASE WWTP.
Heavy Metal ADD THQ
Cu 0.16 4
Zn 0.43 1.4
Cr 0.2 0.13
Cd 0.187 187
Table 4. Average Daily Dose (ADD) and Target Hazard Quotient (THQ) at SOCHE WWTP.
Heavy Metal ADD THQ
Cu 0.01 0.27
Zn 0.19 0.62
Cr 0.23 0.15
Cd 0.09 94
4. Conclusions
This study assessed heavy metal and microbiological and physicochemical parameters
in samples from Manase and Soche WWTPs in Blantyre, Malawi. pH range in effluent
for both WWTPs was within the WHO and Malawi standard acceptable limits, and it was
higher in dry season as compared to rainy season in both WWTPs. In effluent TDS and EC
registered high mean values in dry season as compared to rainy season. In soil, for TDS the
minimum mean value was 1289 ppm, and the maximum mean value was 1752 ppm. Fecal
coliforms registered high values for E. coli and total coliforms, which were above WHO
permissible limit in both WWTPs. Furthermore, total coliforms in effluent were high in dry
season than in rainy season. The value of BOD upstream was within the WHO permissible
limit of 20 mg/L in both WWTPs. In effluent, high values of nitrates were observed in rainy
season. In soil, the results of nitrate were different from that observed in effluent, with
high mean values observed in dry season in both WWTPs. In plants (vegetables), it was
observed that the mean concentration of heavy metals was very high in the two WWTPs
in both seasons, with values above Malawi standard and WHO permissible limit. Lastly,
on healthy risk assessment, at Manase WWTP, all the THQ values were greater than 1
except for chromium, while for Soche WWTP, only the cadmium value was greater than 1.
These values designate a potential health risk to individuals who consume heavy metal
contaminated vegetables. The concentration of these parameters was also an indication of
performance of these WWTPs, i.e., they are not efficient in the treatment of heavy metals. It
is recommended that the WWTPs should be rehabilitated so as to increase their efficiency.Water 2022, 14, 121 12 of 13
Author Contributions: Writing—review and editing, R.S.M.; supervising—review and editing,
C.C.K. and H.W.T.M.; manuscript consolidation, editing, and layout, F.G.D.T. and P.C. All authors
have read and agreed to the published version of the manuscript.
Funding: There was no external funding for this research.
Institutional Review Board Statement: Not applicable.
Informed Consent Statement: Not applicable.
Data Availability Statement: Not applicable.
Acknowledgments: The authors would like to thank F. Kamwani and staff at Blantyre City Assembly
for the support that they rendered during the sampling process.
Conflicts of Interest: The authors declare no conflict of interest.
References
1. Kalulu, K.; Thole, B.; Mkandawire, T.; Kululanga, G. Application of process intensification in the treatment of pit latrine sludge
from informal settlements in Blantyre City, Malawi. Int. J. Environ. Res. Public Health 2020, 17, 3296. [CrossRef]
2. Kayira, F.; Wanda, E.M.M. Evaluation of the performance of Mzuzu Central Hospital wastewater oxidation ponds and its effect
on water quality in Lunyangwa River, Northern Malawi. Phys. Chem. Earth 2021, 123, 103015. [CrossRef]
3. Vunain, E.; Mike, P.; Mpeketula, G.; Monjerezi, M.; Etale, A. Evaluation of coagulating e ffi ciency and water borne pathogens
reduction capacity of Moringa oleifera seed powder for treatment of domestic wastewater from Zomba, Malawi. J. Environ. Chem.
Eng. 2019, 7, 103118. [CrossRef]
4. Ngoma, W.; Hoko, Z.; Misi, S.; Chidya, R.C.G. Assessment of efficiency of a decentralized wastewater treatment plant at Mzuzu
University, Mzuzu, Malawi. Phys. Chem. Earth 2020, 118–119, 102903. [CrossRef]
5. Abosede, A.; Solomon, O.; Peter, A.; Eromosele, H.; Emmanuel, A. Wastewater conservation and reuse in quality vegetable
cultivation: Overview, challenges and future prospects. Food Control 2018, 98, 489–500. [CrossRef]
6. Rizzo, L. Science of the Total Environment Best available technologies and treatment trains to address current challenges in urban
wastewater reuse for irrigation of crops in EU countries. Sci. Total Environ. 2020, 710, 136312. [CrossRef]
7. Truchado, P.; Garre, A.; Gil, M.I.; Simón-andreu, P.J.; Sánchez, G.; Allende, A. Science of the Total Environment Monitoring of
human enteric virus and coliphages throughout water reuse system of wastewater treatment plants to irrigation endpoint of leafy
greens. Sci. Total Environ. 2021, 782, 146837. [CrossRef] [PubMed]
8. Pourret, O. It’s Time to Replace the Term ‘Heavy Metals’ with ‘Potentially Toxic Elements’ when Reporting Environmental
Research. Int. J. Environ. Res. Public Health 2019, 16, 4446. [CrossRef]
9. Letshwenyo, M.W.; Sima, T.V. Phosphorus removal from secondary wastewater effluent using copper smelter slag. Heliyon 2020,
6, e04134. [CrossRef]
10. Alagha, O.; Manzar, M.S.; Zubair, M.; Anil, I. Comparative Adsorptive Removal of Phosphate and Nitrate from Wastewater
Using Biochar-MgAl LDH Nanocomposites: Coexisting Anions Effect and Mechanistic Studies. Nanomaterials 2020, 10, 336.
[CrossRef] [PubMed]
11. Al-housni, M.; Hussein, A.H.; Yeboah, D.; Al Khaddar, R. Electrochemical removal of nitrate from wastewater electrochemical
removal of nitrate from wastewater. IOP Conf. Ser. Mater. Sci. Eng. 2020, 888, 012037. [CrossRef]
12. Taghipour, H.; Mosaferi, M. Heavy Metals in the vegetables collected from production sites. Health Promot. Perspect. 2013, 3,
185–193. [CrossRef]
13. Duruibe, J.; Ogwuegbu, M.O.C.; Egwurugwu, J.N. Heavy metal pollution and human biotoxic effects. Int. J. Phys. Sci. 2007,
2, 112–118.
14. APHA. Standard Methods for the Examination of Water and Wastewater, 16th ed.; American Public Health Association: New York,
NY, USA, 1985.
15. Ametepey, S.T.; Samuel, J.C.; Felix, J.A.; Abudu, B.D.; Zita, N.A. Health risk assessment and heavy metal contamination levels in
vegetables from Tamale Metropolis, Ghana. Int. J. Food Contam. 2018, 5, 1–8. [CrossRef]
16. Usepa, I.R.I.S. Integrated Risk Information System; Environmental Protection Agency Region I: Washington, DC, USA, 2011.
17. WHO. Guidelines for Drinking-Water Quality; World Health Organization: Geneva, Switzerland, 2011; Volume 216, pp. 303–304.
18. Malawi Bureau of Standards (MBS). Malawi Standard, Drinking Water—Specification; MS 214:2005, ICS 13.030.40 (First Revision);
Malawi Standards Board: Blantyre, Malawi, 2005.
19. Balkhair, K.S. Microbial contamination of vegetable crop and soil profile in arid regions under controlled application of domestic
wastewater. Saudi J. Biol. Sci. 2016, 23, S83–S92. [CrossRef] [PubMed]
20. Bauder, T.A.; Waskom, R.M.; Davis, J.G. Irrigation Water Quality Criteria; Fact Sheet No 0.506; Colorado State University,
Cooperative Extension: Fort Collins, CO, USA, 2004.
21. Kumar, M.; Avinash, P. A review of permissible limits of drinking water. Indian J. Occup. Environ. Med. 2012, 16, 40–44.
[CrossRef] [PubMed]Water 2022, 14, 121 13 of 13
22. Blumenthal, U.J.; Duncan, D.M.; Anne, P.; Guillermo, R.P.; Rebecca, S. Guidelines for the microbiological quality of treated
wastewater used in agriculture: Recommendations for revising WHO guidelines. Bull. World Health Organ. 2000, 78, 1104–1116.
23. Hong, H.; Qiu, J.; Yan, L. Environmental factors influencing the distribution of total and fecal coliform bacteria in six water
storage reservoirs in the Pearl River Delta Region, China. J. Environ. Sci. 2010, 22, 663–668. [CrossRef]
24. Ishii, S.; Michael, J.S. Escherichia coli in the environment: Implications for water quality and human health. Microbes Environ.
2008, 23, 101–108. [CrossRef]
25. Mtethiwa, A.H.; Munyenyembe, A.; Jere, W.; Nyali, E. Efficiency of oxidation ponds in wastewater treatment. Int. J. Environ. Res.
2008, 2, 149–152.
26. Ekhator, O.C.; Udowelle, N.A.; Igbiri, S.; Asomugha, R.N.; Igweze, Z.N.; Orisakwe, O.E. Safety evaluation of potential toxic
metals exposure from street foods consumed in mid-west Nigeria. J. Environ. Public Health 2017, 2017, 8458057. [CrossRef]
27. Grant, W.; Steele, G.; Isiorho, S.A. Spontaneous abortion possibly related to ingestion of nitrate-contaminated well water—
LaGrange County, Indiana, 1991–1994. MMWR Morb. Mortal. Wkly. Rep. 1996, 45, 569-572.
28. Masona, C.; Loveness, M.; Stenly, M.; Revai, M. Assessment of heavy metal accumulation in wastewater irrigated soil and uptake
by maize plants (Zea mays L.) at Firle Farm in Harare. J. Sustain. Dev. 2011, 4, 132. [CrossRef]
29. Zhou, H.; Yang, W.; Zhou, X.; Liu, L.; Gu, J.; Wang, W.; Zou, J.; Tian, T.; Peng, P.; Liao, B. Accumulation of heavy metals in
vegetable species planted in contaminated soils and the health risk assessment. Int. J. Environ. Res. Public Health 2016, 13, 289.
[CrossRef] [PubMed]
30. Sulaiman, F.R.; Ibrahim, N.H.; Ismail, S.N.S. Heavy metal (As, Cd, and Pb) concentration in selected leafy vegetables from Jengka,
Malaysia, and potential health risks. SN Appl. Sci. 2020, 2, 1430. [CrossRef]You can also read