HCN/HNC chemistry in shocks: a study of L1157-B1 with ASAI
←
→
Page content transcription
If your browser does not render page correctly, please read the page content below
MNRAS 000, 1–?? (2021)                                Preprint 23 July 2021               Compiled using MNRAS LATEX style file v3.0

                                               HCN/HNC chemistry in shocks: a study of L1157-B1 with ASAI
                                                B. Lefloch1 , G. Busquet1,2,3 , S. Viti4,5 , C. Vastel6 , E. Mendoza7 , M. Benedettini8 , C. Codella9,1 ,
                                               L. Podio 9 , A. Schutzer1 , P.R. Rivera-Ortiz1 , J.R.D. Lépine7 , R. Bachiller10
                                               1 Univ.  Grenoble Alpes, CNRS, IPAG, F-38000 Grenoble, France
                                               2 Institut de Ciències de l’Espai (ICE, CSIC), Can Magrans, s/n, 08193 Cerdanyola del Vallès, Catalonia, Spain
                                               3 Institut d’Estudis Espacials de Catalunya (IEEC), 08034 Barcelona, Catalonia, Spain
arXiv:2107.10596v1 [astro-ph.GA] 22 Jul 2021

                                               4 Leiden Observatory, Leiden University, PO Box 9513, NL-2300 RA Leiden, the Netherlands
                                               5 Department of Physics and Astronomy, University College London, Gower Street, London, WC1E 6BT, England
                                               6 IRAP, Université de Toulouse, CNRS, UPS, CNES, 31400 Toulouse, France
                                               7 Instituto de Astronomia, Geofı́sica e Ciências Atmosféricas, Universidade de São Paulo, São Paulo 05508-090, SP, Brazil
                                               8 INAF, Istituto di Astrofisica e Planetologia Spaziali, via Fosso del Cavaliere 100, 00133 Roma, Italy
                                               9 INAF, Osservatorio Astrofisico di Arcetri, Largo Enrico Fermi 5, I-50125 Firenze, Italy
                                               10 IGN, Observatorio Astronómico Nacional, Calle Alfonso XII, 3 E-28004 Madrid, Spain

                                               Accepted 2021 July 13. Received 2021 June 14; in original form 2021 April 14.

                                               ABSTRACT
                                               HCN and its isomer HNC play an important role in molecular cloud chemistry and the formation of more complex
                                               molecules. We investigate here the impact of protostellar shocks on the HCN and HNC abundances from high-
                                               sensitivity IRAM 30m observations of the prototypical shock region L1157-B1 and the envelope of the associated Class
                                               0 protostar, as a proxy for the pre-shock gas. The isotopologues H12 CN, HN12 C, H13 CN, HN13 C, HC15 N, H15 NC,
                                               DCN and DNC were all detected towards both regions. Abundances and excitation conditions were obtained from
                                               radiative transfer analysis of molecular line emission under the assumption of Local Thermodynamical Equilibrium.
                                               In the pre-shock gas, the abundances of the HCN and HNC isotopologues are similar to those encountered in dark
                                               clouds, with a HCN/HNC abundance ratio ≈ 1 for all isotopologues. A strong D-enrichment (D/H≈ 0.06) is measured
                                               in the pre-shock gas. There is no evidence of 15 N fractionation neither in the quiescent nor in the shocked gas. At
                                               the passage of the shock, the HCN and HNC abundances increase in the gas phase in different manners so that the
                                               HCN/HNC relative abundance ratio increases by a factor 20. The gas-grain chemical and shock model UCLCHEM
                                               allows us to reproduce the observed trends for a C-type shock with pre-shock density n(H)= 105 cm−3 and shock
                                               velocity Vs = 40 km s−1 . We conclude that the HCN/HNC variations across the shock are mainly caused by the
                                               sputtering of the grain mantle material in relation with the history of the grain ices.
                                               Key words: astrochemistry – methods: observational – ISM: jets and outflow – ISM: molecules – ISM: abundances

                                               1 INTRODUCTION                                                        tostellar cores have shown the HNC/HCN ratio to be close
                                                                                                                     to unity (see e.g., Irvine & Schloerb 1984; Hirota et al. 1998;
                                               Hydrogen cyanide (HCN) is one of the most simple interstel-           Hily-Blant et al. 2010). No difference is observed between the
                                               lar molecules. Thanks to its large dipole moment (2.99 De-            values measured in prestellar and protostellar cores, imply-
                                               bye; Bhattacharya & Gordy 1960), its rotation transitions are         ing that the evaporation of HCN and HNC from dust grains
                                               good probe of dense molecular gas in Galactic and extragalac-         does not contribute significantly to the observed emission in
                                               tic environments. HCN and its isomer hydrogen isocyanide              the cold envelope. On the contrary, towards the high-mass
                                               HNC are thought to play an important role in the formation            star forming region OMC-1 in Orion, the HNC/HCN ratio
                                               of more complex molecules, like cyanopolyynes HC2n+1 N, ei-           displays strong variations with especially low values ≈ 0.01
                                               ther in dark cloud cores (Suzuki et al. 1992) or in more ener-        towards the hot core regions while it is of the order of 0.2
                                               getic regions, like protostellar shocks (Mendoza et al. 2018).        in adjacent ridge positions. While the abundance of HCN is
                                               Since HCN and HNC have similar energy spectra and dipole              similar to that of dark cloud cores, the HNC abundance is 2
                                               moments, their differences in spatial distribution is mainly          orders of magnitude lower in the high-temperature gas of the
                                               related to the gas chemical conditions. For this reason, they         hot core (Schilke et al. 1992). A somewhat similar behaviour
                                               have often been used as probes of gas chemical evolution              is observed towards IRAS16293−2422 when looking at the
                                               in both dense cores and star-forming regions (Schilke et al.          high-excitation lines of HCN and HNC (van Dishoeck et al.
                                               1992; Ungerechts et al. 1997; Daniel et al. 2013).                    1995). Recently, Hacar et al. (2020) demonstrated the high
                                                  Many systematic studies of dark clouds and low-mass pro-

                                               © 2021 The Authors
2
sensitivity of the HCN/HNC J=1–0 line intensity ratio to 2 THE SOURCE
the gas kinetic temperature.
The GAIA mission has led to a revision of the distance
In his pioneering work on outflow shock chemistry to L1157 by several groups Dzib et al. (2018) and ?, who
Bachiller & Pérez-Gutiérrez (1997) brought the first hints of found (360 ± 32) pc and (340 ± 21) pc, respectively. In this
HCN abundance enhancement in protostellar shock region. work, we will adopt the value of (352 ± 19) pc derived by
At that time, only a low number of molecular transitions was Zucker et al. (2019), in agreement with Benedettini et al.
observed with the IRAM 30m telescope, hence preventing (2021). Gueth, Guilloteau, & Bachiller (1996, 1998) have
an accurate determination of the excitation conditions and studied at high-angular resolution (≈ 3′′ ) the structure and
molecular abundances. From a theoretical point of view, both dynamics of the southern lobe of the outflow driven by the
the dependence of the HCN/HNC ratio to the temperature protostar L1157-mm from the emission of the CO J=1–0
and the sputtering of dust grains are two processes which and SiO J=2–1 lines observed with the IRAM Plateau de
could a priori alter molecular gas abundances of HCN and Bure interferometer. These authors showed that the south-
HNC across a shock. ern lobe of this molecular outflow consists of two cavi-
ties, likely created by the propagation of large bow shocks
Many subsequent observational studies on the physical
due to episodic events in a precessing, highly collimated,
and chemical characterization of L1157-B1 have been car-
high-velocity jet. This jet was detected by Tafalla et al.
ried out both with (sub)millimeter single-dish and inter-
(2015) and imaged by Podio et al. (2016). Based on higher-
ferometers, which led to a rather detailed, consistent pic-
angular and high-sensitivity CO observations with NOEMA
ture of the outflow shock while unveiling its chemical rich-
at 0.3′′ , Podio et al. (2016) refined the jet precession mod-
ness (see e.g. Codella et al. (2010, 2017); Viti et al. (2011);
elling by Gueth, Guilloteau, & Bachiller (1996) and esti-
Lefloch et al. (2012, 2016, 2017); Busquet et al. (2014);
mated an age of ≈ 1500 yr for B1 (and 2500 yr for B2),
Mendoza et al. (2014, 2018); Podio et al. (2014, 2016, 2017);
adopting the new distance of 352 pc. Located at the apex
Gómez-Ruiz et al. (2015)). The spatial distribution of the
of the more recent cavity, the bright bow shock region B1
HCN emission in the L1157 southern outflow lobe was ob-
displays a peculiar molecular complexity (e.g., Codella et al.
tained at ≈ 5′′ scale for the first time by Benedettini et al.
2010; Benedettini et al. 2012), which makes it a benchmark
(2007) with the IRAM Plateau de Bure interferometer. The
for magnetized shock models (e.g., Gusdorf et al. 2008a,b;
emission of the rare 13 C, D and 15 N isotopologues was
Viti et al. 2011). Multi-transition analysis of the emission
investigated a few years later at a few arcsec resolution
of tracers such as CO (Lefloch et al. 2010, 2012), H2 O
with the IRAM NOEMA interferometer (Busquet et al. 2017;
(Busquet et al. 2014) and CS (Gómez-Ruiz et al. 2015) has
Benedettini et al. 2021). In particular, the distribution of
allowed to elucidate a coherent scenario where the molecular
DCN was shown to result from a combination of gas-phase
emission appears to arise from four physically distinct com-
chemistry that produces the widespread DCN emission, dom-
ponents, with specific excitation conditions:
inating especially in the head of the bow-shock, and sputter-
ing from grain mantles toward the jet impact region. • Component g1 : Lefloch et al. (2012) and
Benedettini et al. (2012) evidenced a region of high excita-
These results incited us to revisit the emission of the HCN tion of ≈ 10′′ size, with a kinetic temperature Tkin ≈ 200 K
and HNC isotopologues in L1157-B1 in a more comprehensive and gas density n(H2 ) ≃ 106 cm−3 . This region is associated
and accurate way than was possible before. This study ben- with the impact of the jet against the L1157-B1 bow shock.
efits from the unbiased and high-sensitivity millimeter spec- • Component g2 is tracing the outflow cavity associated
tral line survey of the shock region carried out as part of the with L1157-B1, for which a kinetic temperature Tkin ≈ 60 K
IRAM 30m Large Program ASAI (”Astrochemical Surveys and a gas density n(H2 ) ≃ (1–10)×105 cm−3 were estimated.
At IRAM”, Lefloch et al. (2018)). In order to better under- • Component g3 is tracing the late outflow cavity associ-
stand and constrain more precisely the impact of the shock ated with L1157-B2, for which have been estimated Tkin ≈
on the chemistry of HCN and HNC, we have also investigated 20 K and n(H2 ) ≃ 105 cm−3
the properties of their isotopologue emission in the envelope • A hot (Tkin ≃ 1000 K) and tenuous gas component
of the Class 0 protostar L1157-mm, at about 1 arcmin away, (n(H2 ) ≃ 103 − 104 cm−3 ) with a size of 2′′ -
which we took as a proxy of the initial gas composition before
the arrival of the shock. The origin of the molecular emission
was then derived from comparison of our observational results
3 OBSERVATIONS
with the predictions of the time-dependent gas-grain chemi-
cal and shock model UCLCHEM (Holdship et al. 2017). 3.1 ASAI
The paper has been organized as follows. In Sect. 2, we Observations of L1157-B1 and L1157-mm were carried out
summarize the main observational properties of the shock during several runs between September 2012 and March 2015
region L1157-B1. The observations are described in Sect. 3. In as part of the Large Program ASAI (Lefloch et al. 2018).
Sect. 4, we present our results on the HCN spatial distribution The source nominal positions are αJ 2000 = 20h 39m 10.s 2
in the region and the gas properties (excitation temperature, δJ 2000 = +68◦ 01′ 10′′ for L1157-B1 and αJ 2000 = 20h 39m
column density, abundance) obtained for the HCN and HNC 06.s 3 δJ 2000 = +68◦ 02′ 15.8′′ for L1157-mm. We made use
isotopologues based on a simple radiative transfer analysis of of the broad-band EMIR receivers connected to Fast Fourier
the line emission. We discuss in Section 5 the behaviour of Transform Spectrometers in the 200 kHz spectral resolution
HCN and HNC across the shock and we analyse the origin of mode.
the molecular emission from comparison with the results of Detailed information on the observation and the data re-
our modelling. Finally, we present our conclusions in Sect. 6. duction procedures can be found in Lefloch et al. (2018).
MNRAS 000, 1–?? (2021)HCN/HNC chemistry in L1157 3
The ASAI observations were carried out using the ”Wobbler 4 RESULTS
Switching” (WSW) mode with a throw of 3′ .
4.1 Spatial distribution
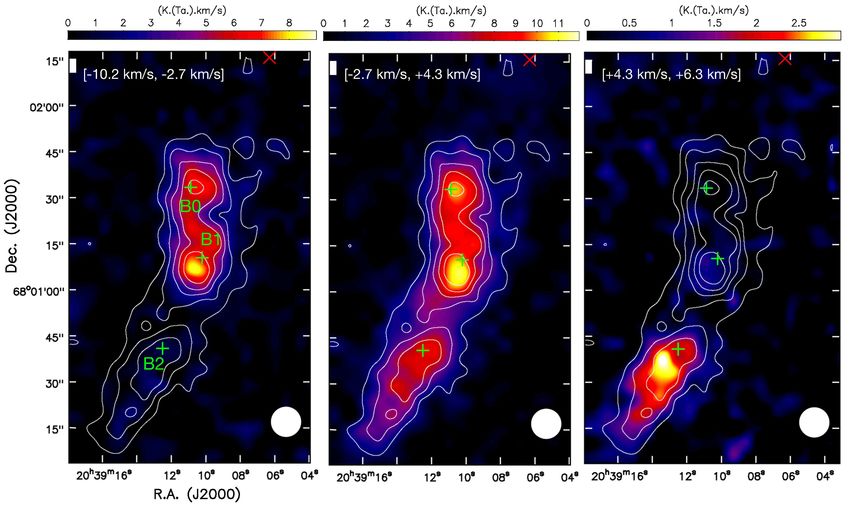
In Fig. 1, we show in white contours the spatial distribution
of the HCN J=3–2 velocity-integrated emission between −20
3.2 On-The-Fly mapping and +5 km s−1 over the southern outflow lobe. The emission
draws two extended features of different Parallatic Angles,
The ASAI dataset was complemented with a fully sampled which coincide with the two CO outflow cavities identified by
map of the HCN J= 3–2 transition in the southern lobe of Gueth, Guilloteau, & Bachiller (1996). The emission peaks at
the L1157 outflow with the IRAM 30m telescope in Decem- the nominal position of the outflow shock position B1. Sec-
ber 2013. The size of the map, 2′ × 2.5′ , is large enough to ondary emission peaks are found towards the shock positions
encompass the whole southern lobe. Observations were car- B0 and B2, at about 30′′ north and south of B1, respectively
ried out with the receiver E230 and the FTS spectrometer (Bachiller et al. 2001). Hardly any emission is detected along
in its 192 kHz resolution mode, using the On-The-Fly mode. the outflow between B0 and the protostar (located North, red
We chose a reference position offset by 10′ in right ascension cross in Fig. 1). The systemic velocity of L1157 is +2.7 km s−1
from L1157-B1, and checked to be free of emission in the (Bachiller & Pérez-Gutiérrez 1997). We show in color scale in
HCN J=3–2 line. Atmospheric calibrations were performed Fig. 1 the HCN J=3–2 emission integrated over the three
every 15 min and showed the weather to be stable, with 2.5 velocity intervals (in km s−1 ): [−10.2; −2.7], [−2.7; +4.3]
– 3.0 mm of precipitable water vapour, and system tempera- and [+4.3; +6.3], from left to right. We find that the low-
tures in the range 450 – 550 K. Pointing was monitored every velocity emission (middle panel in Fig. 1) is associated with
hour and corrections were always found lower than 3′′ . the bright shocked regions B0, B1, and B2, as well as faint
and extended emission tracing the whole outflow lobe. As
shown by Podio et al. (2016), the outflow is oriented almost
in the plane of the sky (inclination i ∼ 73◦ ). We propose that
3.3 Data reduction the HCN emission between −2.7 and +4.3 km s−1 could arise
from low-velocity shocks associated with the cavity walls of
The data reduction was performed using the
the outflow, which would explain the extended emission at
GILDAS/CLASS software1 . We have detected several
blue- and red-shifted velocities. This is consistent with the
transitions of HCN, HNC, and their rare 13 C-, D- , 15 N-
distribution of the HCN J=1–0 emission line as mapped by
isotopologues, between 72 and 272 GHz, towards the shock
Benedettini et al. (2007) at ≈ 5′′ with the Plateau de Bure
region L1157-B1 and the protostar L1157-mm. The line
Interferometer. The high-velocity blueshifted gas traces the
spectra are presented in Figs. 2–5. The resolution of the
young shocks B0 and B1 (left panel in Fig. 1), while the red-
spectrometer allowed us to resolve the hyperfine structure
shifted emission is only detected toward the oldest B2 shock
of the rotational transitions of HCN, H13 CN and DCN. The
(right panel). These maps indicate that the shocked gas in
location of the hyperfine components are indicated by red
B0 and B1 emit at a velocity distinct from that of B2. Inter-
arrows in the spectra. The line intensities are expressed
estingly, the brightest HCN J=3–2 emission coincides with
in units of antenna temperature corrected for atmospheric
the apex of the outflow cavities, consistent with the high
attenuation and rearward losses (TA∗ ).
angular resolution NOEMA images of H13 CN and HC15 N
For subsequent analysis and radiative transfer modelling,
(Busquet et al. 2017; Benedettini et al. 2021).
fluxes were expressed in main beam temperature units (Tmb ).
To summarize, HCN emission is detected throughout most
The telescope and receiver parameters (beam efficiency, Beff ;
of the southern outflow lobe, from B0 to the tip of the out-
forward efficiency, Feff ; Half Power beam Width, HPBW)
flow at position B2, and the brightest emission regions are
were taken from the IRAM webpage2 . The calibration un-
associated with outflow shocks. This is consistent with the
certainties are typically 10, 15, 20% at 3 mm, 2 mm, 1.3 mm,
distribution of the HCN J=1–0 emission line as mapped by
respectively.
Benedettini et al. (2007) at ≈ 5′′ with the Plateau de Bure
The spectroscopic properties and the observational pa-
Interferometer.
rameters of all the detected transitions are summarized in
Tables 1–2, for L1157-B1 and L1157-mm, respectively. We
extracted the observational properties of the line profiles
(velocity-integrated flux, Full Width at Half Maximum, emis- 4.2 L1157-B1
sion peak velocity) performing a simple gaussian fitting us-
All the transitions of the HCN isotopologues and most of the
ing CLASS whenever possible. The only exceptions concern
transitions of the HNC isotopologues present in the spectral
HCN and H13 CN in L1157-B1, where the presence of several
range of ASAI, between 72 and 272 GHz, were detected to-
components prevents from disentangling the emission of the
wards the shock region (see Table 1). Due to instrumental
hyperfine satellites. In that case, the total flux (in TA∗ km s−1 )
(spectral bandwidth) and observational (rms noise) limita-
was obtained from integrating over the whole velocity range
tions, only the ground state transitions of HN13 C and H15 NC
of emission.
were detected with a SNR > 3. The profiles of the transi-
tions display broad linewidths (up to ≈ 10 km s−1 ). All the
line profiles peak at Vlsr ≈ 0 km s−1 and trace blueshifted
gas, in agreement with the other molecular tracers reported
1 https://www.iram.fr/IRAMFR/GILDAS/ in previous works (Lefloch et al. 2012; Codella et al. 2012;
2 http://publicwiki.iram.es/Iram30mEfficiencies/ Gómez-Ruiz et al. 2015).
MNRAS 000, 1–?? (2021)4
Figure 1. HCN J=3–2 velocity-integrated emission in the southern lobe of the L1157 outflow. The emission is integrated over the velocity
range indicated in each panel (colour scale) to illustrate the separation of the emitting gas into the B0 and B1 shocks and the B2 shock.
The emission in the central panel between −2.7 and +4.3 km s−1 encompasses the emission from the ambient gas at Vlsr = +2.7 km s−1 .
White contours represent the total velocity-integrated emission of the HCN J=3–2 line. Contour levels range from 3σ to 15σ in steps of
of 3σ, where σ = 1.07 K km s−1 is the rms noise of the map. In each panel, green crosses mark the nominal position of shocks B0, B1, and
B2; a red cross marks the nominal position of protostar L1157-mm (Gueth et al. 1997). The size (HPBW) of the telescope main beam is
draw by the white circle in the bottom right corner of each panel.
Table 1. Spectroscopic and observational parameters of the transitions of the HCN and HNC and their rare D, 13 C and 15 N isotopologues
detected towards the protostellar shock L1157-B1. Note that the flux uncertainties reported here contain only the statistical rms noise.
TAG is a 5-digit code which indicates the spectroscopic database used for CASSIS line identification and modelling.
R ∗ dv
Species TAG Transition Frequency Eu Aul HPBW ηmb TA FWHM Vlsr
MHz K 10−5 s−1 ′′ K km s−1 km s−1 km s−1
HCN 27501 1 – 0 88631.602 4.3 2.4 27.8 0.85 31.2(1.5) 4 .7(1) -0.2(1.0)
3 – 2 265886.434 25.5 83.6 9.3 0.59 29.9(1.0) 9.5(2) -1.3(.7)
DCN 28509 1 – 0 72414.905 3.5 1.33 34.0 0.86 0.12(.03) 7.9(.5) -0.2 (.1)
2 – 1 144828.001 10.4 12.7 17.0 0.79 0.19(.01) 7.0(.3) -0.3(.2)
3 – 2 217238.538 20.9 46.0 11.3 0.65 0.10(.01) 6.5(.6) -0.1(.3)
H13 CN 28501 1 – 0 86340.184 4.1 2.23 28.5 0.85 1.76(.03) 4.8(1) -0.4(.2)
2 – 1 172677.851 12.4 21.4 14.3 0.75 1.20(.01) 7.2(4) -0.3 (1)
3 – 2 259011.798 24.9 77.3 9.5 0.60 0.73(.02) 6.2(1) -0.34(.3)
HC15 N 28506 1 – 0 86054.961 4.1 2.2 28.6 0.86 0.35(.01) 6.1(.1) -1.0(.1)
2 – 1 172107.956 12.4 21.1 14.3 0.75 0.27(.01) 5.6(.6) -0.3(.3)
3 – 2 258157.100 24.8 76.5 9.5 0.60 0.13(.01) 6.2(.7) -0.1(.3)
HNC 27502 1 – 0 90663.568 4.4 2.69 27.1 0.85 4.26(.02) 4.5 (1) 0.3(.1)
3 – 2 271981.142 26.1 93.4 9.0 0.58 2.36(.04) 3.7(1) 1.5(.3)
DNC 28508 1 – 0 76305.701 3.7 1.60 32.2 0.86 0.010(.004) 1.4(.6) 0.3(.3)
2 – 1 152609.746 11.0 15.4 16.1 0.77 0.04(.02) 1.7(.6) 0.6(.4)
3 – 2 228910.481 22.0 55.7 10.7 0.64 0.012(.003) 2.7(.7) 2.1(.3)
HN13 C 28515 1 – 0 87090.825 4.2 2.38 28.3 0.85 0.093(.005) 5.2(.3) 0.8(1)
H15 NC 28006 1 – 0 88865.715 4.3 2.53 27.8 0.85 0.025(.008) 3.4(.3) 1.8(.1)
MNRAS 000, 1–?? (2021)HCN/HNC chemistry in L1157 5
Table 2. Spectroscopic properties and observational parameters of the transitions of the HCN and HNC and their rare D, 13 C and 15 N
isotopologues detected towards the protostar L1157-mm. Note that the flux uncertainties reported here contain only the statistical rms
noise. TAG is a 5-digit code which indicates the spectroscopic database used for CASSIS line identification and modelling.
R ∗ dv
Species TAG Transition Frequency Eu Aul HPBW ηmb TA FWHM Vlsr
MHz K 10−5 s−1 ′′ K km s−1 km s−1 km s−1
HCN 27501 1 – 0 88631.602 4.3 2.4 27.8 0.85 3.40(.01) 1.4(.1) 2.2 (.1)
3 – 2 265886.434 25.5 83.6 9.3 0.59 1.86(.20) 0.8(.1) 2.2 (.1)
DCN 28509 1 – 0 72414.905 3.5 1.3 34.0 0.86 0.49(.02) 1.5(.2) 2.4(.1)
2 – 1 144828.001 10.4 12.7 17.0 0.79 0.32(.01) 1.0(.1) 2.5(.1)
3 – 2 217238.538 20.9 46.0 11.3 0.65 0.10(.01) 0.96(.04) 2.8(.1)
H13 CN 28501 1 – 0 86340.184 4.1 2.2 28.5 0.85 0.27 (.02) 1.3(.1) 2.7(.1)
2 – 1 172677.851 12.4 21.4 14.3 0.75 0.10(.02) 1.4(.3) 2.4(.1)
3 – 2 259011.798 24.9 77.3 9.5 0.60 0.08(.01) 1.3(.1) 2.7(.1)
HC15 N 28506 1 – 0 86054.961 4.1 2.2 28.6 0.86 0.09(.02) 1.5(.2) 2.6(.1)
2 – 1 172107.956 12.4 21.1 14.3 0.75 0.06(.01) 1.8(.4) 2.0(.2)
3 – 2 258157.100 24.8 76.5 9.5 0.60 0.04(.01) 1.5(.2) 2.6(.1)
HNC 27502 1 – 0 90663.568 4.4 2.7 27.1 0.85 3.1(.1) 1.8(.1) 2.4(.1)
3 – 2 271981.142 26.1 93.4 9.0 0.58 1.3(.1) 0.99(.1) 2.5(.1)
DNC 28508 1 – 0 76305.701 3.7 1.60 32.2 0.86 0.90(.01) 1.7(.1) 2.7(.1)
2 – 1 152609.746 11.0 15.4 16.1 0.77 0.69(.01) 1.0(.1) 2.6(.1)
3 – 2 228910.489 22.0 55.7 10.7 0.64 0.26(.01) 0.8(.1) 2.7(.1)
HN13 C 28515 1 – 0 87090.825 4.2 2.4 28.3 0.85 0.29(.01) 1.4(.1) 2.4 (.1)
3 – 2 261263.310 25.1 82.8 9.4 0.60 0.079(.004) 0.8(.1) 2.3(.1)
H15 NC 28006 1 – 0 88865.715 4.3 2.5 27.8 0.85 0.063(.004) 1.4(.1) 2.7(.1)
3 – 2 266587.800 25.6 87.9 9.2 0.59 0.026(.005) 1.5(.4) 2.9(.2)
The excellent rms of the data permits detection of emission profile. This is probably due to the overlap between the con-
up to VLSR ≈ −20 km s−1 in the different transitions of HCN. tributions of the different hyperfine satellites. Another possi-
Several transitions of DCN, H13 CN and HC15 N were also de- bility would be the presence of spatial gradients of emission
tected towards L1157-B1 and their profiles display similar across the telescope beam (Benedettini et al. 2013).
broad linewidths, confirming the shock association (Fig. 2). The spectral slope V0 of the HCN line profiles is very similar
The detection of bright deuterated emission suggests that to that found for the CO emission from the L1157-B1 outflow
despite shock processing, the gas has preserved part of the cavity (component g2 ) by (Lefloch et al. 2012), as indicated
initial chemical conditions, an effect already pointed out by by the similarity of the fits and the derived exponent values
Codella et al. (2012) and Fontani et al. (2014), who reported (V0 = 4.4 km s−1 ). This implies that in the velocity range
the detection of singly deuterated isotopologues of H2 CO, between −20 and −5 km s−1 , both species are probing the
CH3 OH, NH3 . A small systematic velocity shift (less than same gas component. This is consistent with the analysis of
0.5 km s−1 ) is measured between the emission peaks of the the HCN J=3–2 spatial distribution obtained with the IRAM
HCN and HNC line profiles, suggesting they are tracing dif- 30m telescope at 9.3′′ (Sect. 4.1) and the HCN J=1–0 and
ferent regions inside the shock. H13 CN J=2–1 with the IRAM interferometer at a few arcsec
We note that the HNC isotopologues (HN12 C, HN13 C, resolution (Benedettini et al. 2007; Busquet et al. 2017). As
H15 NC) display much weaker lines intensities than the HCN can be seen in Fig. 6, the HNC line profiles look very different
isotopologues. Line intensities and fluxes of the ground state from those of HCN in a linear-logarithmic scale. The velocity
transitions are weaker by one order of magnitude. There is range of the emission is narrower and stops at −10 km s−1 ,
however one exception, which is the case of deuterated iso- whereas the emission of HCN extends up to −30 km s−1 .
topologues DNC and DCN, whose peak intensities are similar Quantitatively, the HNC line profiles are well fitted by an
within a factor of 2. exponential function exp(−V /V0 ) with V0 = 2.1 km s−1 , i.e. a
Following the approach presented in Lefloch et al. (2012), value of V0 half the value obtained for HCN. This supports
we have fitted the line profiles by an exponential law of the the idea that HNC and HCN are tracing different regions. We
type exp(−V /V0 ), a procedure which is obviously limited by note that the V0 value obtained for HNC is actually similar
the SNR of the data. In practice, we considered the lower-J to that found for the CO component g3 (V0 = 2.5 km s−1 ),
transitions of HCN, H13 CN and HNC. The results are dis- which Lefloch et al. (2012) showed to be associated with the
played in Fig. 6, where the spectra are displayed in a linear- L1157-B2 outflow cavity.
logarithmic scale. The spectral slope of the HCN (H13 CN) In L1157-B1, the HCN line profiles follow an exponential
line profiles considered can be fitted by an exponential law of signature exp(−V /V0 ), with the same V0 value for the rota-
the type exp(−V /V0 ), with V0 = 3.8 km s−1 (V0 = 4.5 km s−1 ; tional transitions J= 1–0 and J= 3–2, so that the HCN line
Fig 6). The similar values obtained for V0 indicate that we intensity ratio J= 3–2/J=1–0 is almost constant for velocities
are indeed probing the same gas in the different transitions of beyond −6 km s−1 (see Fig. 6). Hence, the HCN excitation
the same molecular species. A small deviation with respect to conditions are essentially independent of velocity, at least in
the fit is observed at V < −10 km s−1 in the HCN J=1–0 line this velocity range. Similar results were previously reported
MNRAS 000, 1–?? (2021)6
Figure 3. Montage of line profiles of HNC and its rare isotopologues
(HN13 C, DNC, H15 NC), as observed with ASAI towards L1157-
B1. Dashed-dotted lines indicate the baseline and rest velocity,
Vlsr = +2.7 km s−1 . All the spectra are smoothed to a resolution
of 1 km s−1 . The best fits obtained from the LTE analysis with
CASSIS are displayed in red. The velocity axis is associated to
the reference frequency given in Table 2. Red arrows mark the
location of the hyperfine satellites on the velocity axis, based on
the frequencies given in the CASSIS database.
Figure 2. Montage of line profiles of HCN and its rare isotopologues under the assumption of a standard elemental abundance ra-
(H13 CN, DCN, HC15 N), as observed with ASAI towards L1157- tio.
B1. Dashed-dotted lines indicate the baseline and rest velocity,
Vlsr = +2.7 km s−1 . All the spectra are smoothed to a resolution
of 1 km s−1 . The best fits obtained from the LTE analysis with 4.3 L1157-mm
CASSIS are displayed in red. The velocity axis is associated to
the reference frequency given in Table 2. Red arrows mark the Emission from the HCN and HNC isotopologues was detected
location of the hyperfine satellites on the velocity axis, based on towards the protostellar envelope of L1157-mm. All the de-
the frequencies given in the CASSIS database. tected molecular transitions display narrow linewidths be-
tween 0.8 and 1.8 km s−1 , as expected for cold and quiescent
protostellar gas (Figs. 4–5). This permits identification of the
for CO (Lefloch et al. 2012). The similarity of the spectral hyperfine satellites, whose emission was hidden otherwise in
slopes of HCN and CO between −20 and −5 km s−1 implies the outflowing gas at position B1. The signature of the proto-
that the HCN/CO line flux ratio is constant, and since the stellar outflow is detected in the HCN and HNC J=1–0 lines,
excitation conditions of both species are independent of ve- as a broad, low intensity component with a typical linewidth
locity in this interval, it means that the relative abundance of 5 km s−1 .
ratio is also independent of velocity in this velocity range. Overall, comparison of the HCN and HNC isotopologues
The HCN/H13 CN total line flux ratio is ≈ 19 and 42 for the emission shows that the transitions from same rotational lev-
J=1–0 and J=3–2 transitions, respectively. Assuming similar els display similar similar intensities for each pair of isomers,
excitation conditions for both isotopologues and an elemen- as can be seen in Figs. 4-5 (see also Table 4). Since the corre-
tal abundance ratio 12 C/13 C equal to 66 (see below), close to sponding line intensity ratios are only weakly dependent on
the local ISM value (Milam et al. 2005), we then derive line the excitation temperature, this suggests that both isomers
opacities τ10 ≃ 3 and τ32 ≃ 0.8 for the J=1–0 and J=3–2, and their rare isotopologues should have similar abundances.
respectively, i.e. the gas is moderately optically thick. The Note that the situation differs very much from L1157-B1,
HNC/HN13 C takes lower values, ≈ 11 and 16 for the J=1–0 where much brighter emission is detected in the HCN iso-
and J=3–2 transitions, respectively, which implies opacities topologues.
of about 5 and 4 for the main isotopologue, respectively, still The HCN/H13 CN (HNC/HN13 C) line flux ratio is 11
MNRAS 000, 1–?? (2021)HCN/HNC chemistry in L1157 7
Figure 4. Montage of line profiles of HCN and its rare isotopologues
(H13 CN, DCN, HC15 N), as observed with ASAI towards L1157- Figure 5. Montage of line profiles of HNC and its rare isotopologues
mm. Dashed-dotted lines indicate the baseline and rest velocity, (HN13 C, DNC, H15 NC), as observed with ASAI towards L1157-
Vlsr = +2.7 km s−1 . The best fits obtained from the LTE analysis mm. Dashed-dotted lines indicate the baseline and rest velocity,
with CASSIS are displayed in red. The velocity axis is associated Vlsr = +2.7 km s−1 . The best fit obtained from the LTE analysis
to the reference frequency given in Table 2. Red arrows mark the with CASSIS are displayed in red. The velocity axis is associated
location of the hyperfine satellites on the velocity axis, based on to the reference frequency given in Table 2. Red arrows mark the
the frequencies given in the CASSIS database. location of the hyperfine satellites on the velocity axis, based on
the frequencies given in the CASSIS database.
and 16 (12 and 23) for the J=1–0 and 3–2 transitions, re-
spectively. Adopting a standard elemental abundance ratio 4.4 Line excitation
12
C/13 C = 66, we then derive HCN line optical depths τ10 ≃
5.5 and τ32 ≃ 2.3, for the J=1–0 and J=3–2 transitions, re- The above analysis of the line profiles shows hints of chem-
spectively. Similar results are obtained for HNC. Hence, both ical evolution in the passage of the shock. In order to gain
the HCN and HNC emissions are optically thick. Therefore, more insight on the shock impact on nitrile chemistry, we
we have used the 13 C isotopologues to determine the total have first determined the excitation conditions of the different
gas column density of HCN and HNC. molecular species (excitation temperature, column density).
To summarize, a simple comparison of the line intensi- The detection of the rare isotopologues offers an opportunity
ties of the HCN and HNC isotopologues measured towards to constrain directly the evolution of isotopic fractionation
L1157-mm suggests that both isomers are present in the pre- through the passage of a protostellar shock. In the case of
shock phase with similar abundances. The pre-shock gas dis- L1157-mm, rather than a detailed physical and chemical de-
plays hints of isotopic fractionation enrichment, in particular scription of the structure of the envelope, our goal here is to
deuteration, which is partially preserved through the shock. A determine the relative abundances of these various species,
strong differentiation is observed in the shock between HCN which we take as representative of the chemical composition
and HNC with the emission of the former strongly enhanced of the pre-shock gas in the L1157-B1 region.
over the latter. Analysis of the spectral signature suggests In order to follow a systematic approach in the molecular
that both isomers are tracing different regions in the shock abundance determination, we decided to model the line pro-
region. files in the approximation of Local Thermodynamical Equi-
MNRAS 000, 1–?? (2021)8
librium (LTE) using CASSIS3 (Vastel et al. 2015). In the case
only one transition was detected (HC15 N, HN13 C in L1157-
B1), an excitation temperature of 7 K was adopted, in good
agreement with the other rare isotopologues. Line profiles to-
wards L1157-B1 could usually be reproduced with one single
Gaussian component, of Full Width at Half Power (FWHP)
consistent with our determination of the line parameters (see
Table 1). In order to reproduce as accurately as possible the
observed line profiles, we made use of the CASSIS private
database which takes into account the hyperfine spectroscopic
properties of HCN isotopologues. Towards L1157-mm, it was
necessary to introduce a second component of broad linewidth
(5 km s−1 ) and low intensity in order to reproduce the outflow
signature (see Sect. 4.3).
We have adopted a size of 60′′ for the envelope of L1157-
mm, a value in good agreement with the size of the enve-
lope observed in N2 H+ (Tobin et al. 2013). In practice, this
value allowed us to best simultaneously reproduce the emis-
sion of the various transitions of a given molecular species
under the assumption of one single excitation temperature.
We have adopted a total gas column density of 2×1022 cm−2 ,
based on the H2 column density maps of the region obtained
in the Herschel Gould Belt Survey (HGBS) of nearby star-
forming molecular clouds (Di Francesco et al. 2020). We note
that this H2 column density is about a factor of 3 higher
than the determination obtained by Mendoza et al. (2018).
The latter value (6 × 1021 cm−2 ) was derived from the 13 CO
J=1–0 line in the ASAI spectrum of the protostar, adopting
a canonical abundance of 1.6 × 10⁻⁶ . As a matter of fact,
the low gas kinetic temperature (∼ 10 K) and the relatively
high gas density (∼ a few 104 cm−3 ) of the envelope are such
that CO is most likely depleted at large scale in the envelope
by a factor of a few, as is commonly measured in cold cores
(see e.g., Bacmann et al. 2002). Both column density values
can be reconciled if CO is moderately depleted by a factor of
about 3–4 over the envelope. We have adopted a linewidth
of ∼ 1 km s−1 for the line profile modelling in L1157-mm, in
agreement with the results of our gaussian fits to the line
spectra (see Figs. 4–5 and Table 2).
In the case of L1157-B1, previous observational work
showed that the molecular gas emission arises from a re-
gion with a typical gaussian size (FWHM) in the range 20′′
– 25′′ (Gueth, Guilloteau, & Bachiller 1996; Lefloch et al.
2012; Benedettini et al. 2013). This is consistent with the dis-
tribution of the HCN J=3–2 emission (Fig. 1), which appears
extended between the protostar and the B1 shock position.
The high-J transitions of the HCN and HNC isotopologues lie
in a frequency range for which the main-beam of the telescope
is comparable to or smaller than the size of the shock region,
as estimated from interferometric observations (see Tables 1–
2). For these transitions, the emission can be considered as
extended and the main-beam temperature becomes a satisfy-
ing approximation to the molecular line brightness temper-
ature. The case of the ground state transitions of the HCN
and HNC isotopologues is more complicated for two reasons:
first, the telescope beamwidth (HPBW) is comparable to the
Figure 6. Montage of emission line profiles observed towards L1157-
B1 displayed in linear-logarithmic scale, from top to bottom: HNC molecular emission size; second, the typical physical condi-
J = 3 − 2, J = 1 − 0, H13 CN J = 2 − 1, J = 1 − 0, HCN J = 3 − 2, tions (n(H2 ) ∼ 105 cm−3 ; Tkin = 60 K–90 K) are such than
J = 1 − 0. In each panel, we have superposed in red (blue) a fit to the rotational transitions present in the millimeter bands are
the spectral slope of the type T (v) ∝ exp(−V /V0 ) with V0 ≃ 2.0
(4.0) km s−1 , associated with the component g3 (g2 ) of the outflow.
The exponent v0 is given for each transitions in the corresponding 3 http://cassis.irap.omp.eu/
panel.
MNRAS 000, 1–?? (2021)HCN/HNC chemistry in L1157 9
subthermally excited. The J=1–0 excitation temperature is same quantum numbers of the different 13 C isotopologues
higher than that of the J=3–2 line, as can be checked by a are very close in frequency, separated by a few GHz at most.
simple calculation using a radiative transfer code in the Large These different transitions were observed simultaneously in
Velocity Gradient approximation, like Madex (Cernicharo et the ASAI survey, with the advantage of minimizing the cal-
al. 2012). In the LTE approximation, the Tex of the J=1– ibration uncertainty, which is then dominated by the rms
0 line is underestimated by the fitting procedure, and the noise of the spectrum. Mendoza et al. (2018) showed that
approximation is no longer very satisfying. However, the ap- the emission of all the HC3 N isotopologues detected in the
proximation of extended, or main-beam averaged, emission millimeter range is optically thin. Hence, the line flux ratio
compensates for the previous effect, which mainly affects the of the 12 C to the sum of the 13 C isotopologues is equal to
ground state transitions, as explained above. We found that three times the elemental abundance ratio 12 C/13 C. For the
this approximation yields much better quality LTE fits. The J=10–9 and J=12–11 transitions, we found 12 C/13 C= 66±6.
source-averaged column density is then obtained by correct- For the J=11-10, we discarded the H13 CCCN line whose in-
ing the fitted (main-beam averaged) column density for the tensity is almost twice as bright as the lines of HC13 CCN
main-beam filling factor. and HCC13 CN, a dissymmetry which is observed only in this
The results of our LTE analysis (source-averaged column transition and not in the J=10–9 and J=12–11. It then comes
12
density N , excitation temperature Tex ) and the correspond- C/13 C= 70±10, in agreement with the determinations from
ing molecular abundances are summarised in Table 3. Due to the J=10–9 and J=12–11. This direct observational determi-
the uncertainties in the derivation of the HCN column densi- nation of the 12 C/13 C ratio in the L1157 star forming region
ties from the 12 C isotopologue, we have reported for HCN and is actually very close to the elemental abundance ratio in
HNC the values obtained from the rare 13 C isotopologues, the local ISM, equal to 68, (Lucas & Liszt 1998; Milam et al.
adopting an elemental abundance ratio 12 C/13 C = 66 (see 2005) and the value assumed in our previous works (see Sect.
below Sect. 5.1). They are indicated with a (*) in Table 3. 2).
The best fits to the individual line profiles obtained with Both the HCN/H13 CN and HNC/HN13 C column den-
CASSIS are superimposed in red on the spectra in Figs. 2–5. sity ratios display values well below the canonical 12 C/13 C
The error bars on Trot and N were estimated from LTE fits elemental abundance ratio in the ISM, equal to 68
to the line profiles taking into account the absolute flux cal- (Lucas & Liszt 1998; Milam et al. 2005). In particular, a low
12
ibration uncertainties (see Sect. 3.3) and the statistical rms C/13 C ratio of ≈ 11 ± 4 is measured towards towards the
noise. Our column density determinations for HCN and HNC cold protostellar core L1157-mm. We first note that models
towards L1157-mm and L1157-B1 are in good agreement of 13 C isotopic fractionation in cold cores lead to an oppo-
with those of Bachiller & Pérez-Gutiérrez (1997). Recently, site effect, i.e. a H12 CN/H13 CN (HN12 C/HN13 C) ratio higher
Benedettini et al. (2021) observed the H13 CN and HC15 N than the 12 C/13 C elemental abundance ratio (Langer et al.
J=1–0 line emission at 4′′ resolution toward L1157-B1 us- 1984; Roueff et al. 2015). A similar effect was reported by
ing NOEMA, as part of the Large Program SOLIS. Their citetDaniel2013 in their detailed study of nitrogen hydrides
radiative transfer modelling of both lines yielded N (H13 CN) and nitriles in the Class 0 protostellar core Barnard 1. The
∼ 7 × 1012 cm−2 and N (HC15 N) ∼ 2 × 1012 cm−2 . Our ob- authors concluded that the apparently low H12 CN/H13 CN
servational determinations are in satisfying agreement with ratio was most likely a bias caused by the simple hypothesis
these values (see Table 3). made in the radiative transfer modelling of the line excitation
and the geometry of the astrophysical source. In particular,
the excitation of the HCN and HNC ground-state transitions
5 DISCUSSION also depends on the extended, low-density gas surrounding
the dense core, so that a detailed multi-dimensional radia-
In this section, we discuss the properties of the HCN and tive transfer model of the source taking into account the full
HNC isotopologues in the pre-shock gas, based on the L1157- density and velocity fields is needed in order to properly re-
mm envelope properties, and their evolution across the produce the line profiles .
shock in L1157-B1. The molecular abundances and line ra- From what precedes, we conclude that there is no convinc-
tios of interest derived towards L1157-B1 and L1157-mm ing evidence for 12 C/13 C fractionation of HCN/HNC in the
are presented in Table 4. Using the time dependent gas- star-forming region. Because of the high optical depth of the
grain chemical and parametrised shock model UCLCHEM HCN and HNC lines, which cast some uncertainties on the
(Holdship et al. 2017) we simulate the pre-shock abundances determation of the HCN and HNC total column densities,
for the gas and the solid phase, before the arrival of the shock, these were obtained from the column densities of their op-
as well as during and after the shock has passed. We discuss tically thin 13 C isotopologues and taking into account our
the modelling findings with an emphasis of the behaviour of estimate of the elemental abundance 12 C/13 C= 66 ± 6.
HCN and HNC.
5.2 Isomers
12
5.1 C/13 C elemental abundance ratio
In the pre-shock gas, we find similar molecular abundances of
We have used the detected transitions of HC3 N and its rare HCN and HNC, close to 2 × 10⁻⁹ , and a a relative abundance
13
C isotopologues observed towards L1157-B1 to estimate the ratio HCN/HNC= H13 CN/HN13 C= 1.1 ± 0.4. These values
elemental abundance ratio 12 C/13 C in the L1157 star-forming were derived from a direct to the L1157-mm line profiles with
region. The transitions of the rare isotopologues J=10–9, CASSIS, taking into account the line optical depths. Simi-
J=11–10, J=12–11 of H13 CCCN, HC13 CCN and HCC13 CN lar results were obtained when considering the rare isotopo-
were presented in Mendoza et al. (2018). The transitions of logues ratios DCN/DNC (= 1.1 ± 0.4) and HC15 N/H15 NC
MNRAS 000, 1–?? (2021)10
Table 3. Excitation conditions (source-averaged column density N , rotational temperature Trot , abundance X) of the HCN and HNC
isotopologues detected towards L1157-B1 and L1157-mm. Emission sizes of 60′′ and 20′′ were adopted for L1157-mm and L1157-B1,
respectively. A total H2 column density of 2 × 1022 cm−2 and 2 × 1021 cm−2 was adopted for L1157-mm and L1157-B1, respectively
(Lefloch et al. 2012; Di Francesco et al. 2020), in order to compute the molecular abundances. We follow the convention a(b) = a × 10b .
The HCN and HNC parameters are marked with a * to indicate that they were obtained from the 13 C isotopologue, adopting an abundance
ratio 12 C/13 C= 66 (see Sect. 5.1).
L1157-mm L1157-B1
Species Trot N X Trot N X
( K) ( cm−2 ) ( K) ( cm−2 )
Main Body
HCN(*) 6.7+0.7
−0.5 4.6+0.6
−0.6 (13) 2.3+0.3
−0.3 (-9) 7.2+0.6
−1.0 6.6+1.1
−0.6 (14) 3.3+0.6
−0.3 (-7)
H13 CN 6.7+0.7
−0.5 7.0+1.0
−1.0 (11) 3.5+0.5
−0.5 (-11) 7.2+0.6
−1.0 1.0+0.4
−0.1 (13) 5.0+2.0
−1.0 (-9)
DCN 4.9+0.2
−0.2 2.8+0.5
−0.3 (12) 1.4+0.3
−0.2 (-10) 6.5+0.5
−0.5 2.1+0.5
−0.5 (12) 1.1+0.2
−0.3 (-9)
HC15 N 7.7+0.5
−0.4 1.2+0.3
−0.2 (11) 0.7+0.1
−0.1 (-11) 6.8+0.4
−0.5 2.0+0.5
−0.3 (12) 1.0+0.3
−0.2 (-9)
HNC(*) 6.8+0.3
−0.3 4.2+0.8
−0.5 (13) 2.1+0.4
−0.3 (-9) 7.0+1.3
−1.5 3.5+0.3
−0.6 (13) 1.7+0.2
−0.2 (-8)
HN13 C 6.8+0.3
−0.3 6.3+1.2
−0.7 (11) 3.2+0.6
−0.4 (-11) 7.0+3.0
−1.7 5.3+0.6
−0.6 (11) 2.6+0.3
−0.2 (-10)
DNC 5.7+0.3
−0.2 2.5+0.5
−0.3 (12) 1.3+0.2
−0.2 (-10) 6.0+2.0
−2.0 3.2+1.8
−1.4 (11) 1.6+0.9
−0.7 (-10)
H15 NC 7.7+0.5
−0.6 1.3+0.3
−0.4 (11) 0.7+0.1
−0.3 (-11) 7.0+3.0
−1.5 1.8+0.7
−0.6 (11) 8.5+3.5
−2.5 (-11)
Outflow component
HCN 5.0 4.0(12) 2.4(-8) - - -
HNC 5.0 1.5(12) 0.9(-8) - - -
Table 4. Isomer and isotopic abundance ratios of HCN and HNC in of the prestellar phase. Hirota et al. (1998) pointed out that
L1157-mm and L1157-B1. For each source, the ratios are computed since no difference is observed between the values measured
adopting a canonical elemental 12 C/13 C abundance ratio of 66 (see in prestellar and protostellar cores, the evaporation of HCN
also Sect. 5.1). and HNC from dust grains does not contribute significantly
to the observed emission in the cold gas.
L1157-mm L1157-B1 Comparison of the molecular abundances of L1157-mm
HCN/H 1.2+0.2 1.7+0.4
(pre-shock gas) and the shocked region L1157-B1 (see Ta-
−0.2 (-9) −0.2 (-7)
HCN/H13 CN 66 66 ble 3) shows that the HCN and HNC isomers behave differ-
HCN/HC15 N 383 ± 145 330 ± 110 ently across the shock. First, we observe an increase in the
HCN/DCN 16 ± 5 314 ± 110 abundance of all the HCN isotopologues. The rare H13 CN
H13 CN/HC15 N 5.8 ± 2.2 5.0 ± 2.5 and HC15 N (and HCN) abundances increase by a similar fac-
tor of 140 while the DCN abundance increases much less, by
HNC/HN13 C 66 66
a factor ≈ 8. Unlike HCN, the abundances of all the HNC iso-
HNC/H15 NC 323 ± 160 194 ± 100
HNC/DNC 17 ± 7 109 ± 70 topologues vary by a much smaller factor of a few (≈ 8–12).
HN13 C/H15 NC 4.8 ± 2.4 3.0 ± 1.5 The abundance DNC remains almost unchanged. Overall, the
abundances of the HNC isotopologues seem barely affected by
HCN/HNC 1.1 ± 0.4 19 ± 6 the passage of the shock. From a ratio HCN/HNC with an
H13 CN/HN13 C 1.1 ± 0.4 19 ± 8 initial value of 1 in the quiescent gas, it is now 19 ± 6 in
HC15 N/H15 NC 0.9 ± 0.5 11 ± 6
the post-shocked gas. The isomer ratio displays values in the
DCN/DNC 1.1 ± 0.4 6±5
range 11–19 which are consistent, within the uncertainties,
for H13 CN/HN13 C and HC15 N/H15 NC. The deuterated iso-
mers seem to behave differently with a much lower increase
(= 0.9 ± 0.5). The consistency between these values deter- of the DCN/DNC ratio.
mined independently, makes us confident about the relia- In the protostellar outflow near L1157-mm, the high sensi-
bility of our method. The molecular abundances of HCN tivity of the ASAI data has permitted detection of the emis-
and HNC are similar to those reported in previous surveys sion of the ground state transition of HCN and HNC. This
of dark cloud cores and low-mass star forming cores (e.g., emission can be modelled as a broad component of ≈ 5 km s−1
Hirota et al. 1998; Hily-Blant et al. 2010; Daniel et al. 2013), and low excitation (Table 3). Interestingly, the HCN/HNC
suggesting that the envelope of L1157-mm has kept memory abundance (column density) ratio is close to 3, suggesting
MNRAS 000, 1–?? (2021)HCN/HNC chemistry in L1157 11
that the relative abundance of HCN with respect to HNC is Marty et al. 2011). Towards L1157-B1, the H13 CN/HC15 N
enhanced in the formation of the outflow. is almost unchanged (5.0 ± 2.5) whereas the HN13 C/H15 NC
takes a lower value (3.0 ± 1.5), but still in rough agreement
with the canonical value.
5.3 Isotopic fractionation At the passage of the shock, the rare 15 N isotopologues dis-
5.3.1 Deuterium play the same behaviour as HCN and HNC, as can be seen in
Table 3. The H13 CN and HC15 N abundances in L1157-B1 in-
It is well established that strong Deuterium enrichment crease by a factor of 140 with respect to the values measured
takes place in molecular material of cold, dark and prestel- towards L1157-mm. By comparison, HN13 C and H15 NC in-
lar cores (Caselli & Ceccarelli 2012). The first evidence crease by a factor (∼ 8). Overall, these variations remain
of molecular deuteration in L1157-mm were brought by very modest. Therefore, our analysis brings direct observa-
Bachiller & Pérez-Gutiérrez (1997), with the detection of the tional evidence that the 14 N/15 N elemental abundance ratio
deuterated forms of HCN and HCO+ , and a molecular D/H is not affected by the passage of the shock.
ratio of 0.018 in the cold envelope. Our own determinations, Recently, Benedettini et al. (2021) have investigated the
which are based on the modelling of a larger number of 14
N/15 N fractionation of HCN in the two shocked clumps, B1
rotational transitions, yield a somewhat higher D/H ratio and B0, of the L1157 outflow using the NOEMA interferom-
0.06 ± 0.02 for both HCN and HNC, in rough agreement with eter at ∼ 3′′ resolution, and obtained 14 N/15 N= 340 ± 70, in
Bachiller & Pérez-Gutiérrez (1997). good agreement with our determination (see Table 4). Based
At the passage of the shock, the DCN abundance increases on the chemical shock modelling, Benedettini et al. (2021)
by a factor 7 whereas DNC remains unchanged. Overall, the conclude that the rich gas chemistry activated by the passage
magnitude of these variations remain small in front of those of the shock does not affect the 14 N/15 N ratio with respect to
affecting the main isotopologues and indicate that, at first the local ISM value. This conclusion is observationally con-
order, the abundances of these deuterated species are only firmed by our results.
moderately affected by the passage of the shock, with a dif-
ferent behaviour for DCN and DNC. As for L1157-B1, pre-
vious estimates of the DCN/HCN ratio were obtained by 5.4 Chemical modelling
Codella et al. (2012), based on a reduced number of tran- As discussed in the previous section, a simple qualitative anal-
sitions of H13 CN and DCN. Our present determination of ysis of the spectral line signature shows evidence for the shock
(3.1 ± 1.0) × 10−3 is consistent with their previous estimate impact on Nitrile gas composition. The HCN isotopologue
D/H = (0.5–3)×10−3 . More recently, Busquet et al. (2017) abundances have been deeply affected in the shock, increas-
reported similar deuterium fractionation ratios (≈ 4.0×10⁻³ ) ing by more than one order of magnitude, whereas the HNC
in the small-scale structures detected in the bow-shock, with isotopologues seem to have barely noticed its presence.
no significant spatial variation. Our unbiased analysis of the Our goal is to identify the chemical processes responsible
deuterated isomers confirms that the molecular D/H ratio for the HCN and HNC gas phase abundances in L1157-B1,
decreases across the shock and it allows us to quantify the before and during the passage of the shock. The different
magnitude of the effect: a factor 26 and 8 for HCN and HNC, studies of H2 O, NH3 , CH3 OH, H2 CO, HC3 N, H2 S, NO,
respectively. PN, PO by our group (Viti et al. 2011; Lefloch et al.
The behaviour of DCN/HCN in the B1 shock position has 2016; Holdship et al. 2017; Benedettini et al. 2013;
already been studied in detail by Busquet et al. (2017) based Mendoza et al. 2018; Benedettini et al. 2013; Busquet et al.
on high-angular resolution observations of H13 CN J=2–1 and 2017; Codella et al. 2018; Benedettini et al. 2021) have led to
DCN J=2–1 combined with the UCLCHEM code and adopt- a coherent picture of L1157-B1, in which the detected molec-
ing the deuterated network of Esplugues et al. (2013). The ular emission is accounted for by a C-type shock propagating
results from the model show that the DCN/HCN abundance into a pre-shock medium of density n(H2 ) ≃ 5 × 104 cm−3
ratio varies with the passage of the shock. The observed and shock velocity Vs in the range 20 − 40 km s−1 . We have
DCN/HCN ratio is well reproduced by the model in the post- adopted the same methodological approach as in our previous
shock gas material, around t ∼ 1000 yr, when the gas has studies, and have used the public time dependent gas-grain
cooled down to ∼ 80 K. The morphology of DCN together chemical and parametrised shock model UCLCHEM code
with the shock model suggests that gas-phase chemistry is the (Holdship et al. 2017) to follow the evolution of the gas
dominant mechanism producing the widespread DCN emis- phase composition across a protostellar shock, adopting
sion, which dominates in the head of the bow-shock. a cosmic ray ionization rate of ζ = 1.3 × 10⁻¹⁶ s−1 , in
agreement with Podio et al. (2014). We refer the reader to
the release paper of UCLCHEM for a detailed description of
5.3.2 Nitrogen
this public code (Holdship et al. 2017). Briefly, the code is
We do not find any evidence of 15 N isotopic fractionation. run in two phases, where Phase I forms a dense core out of
Towards L1157-mm, we obtain 13 C/15 N ratios of 5.8±2.2 and a diffuse, essentially atomic medium. An initial density of
4.8 ± 2.4 for HCN and HNC, respectively. Both values agree 100 cm−3 is adopted here, for the diffuse medium. During
within the uncertainties, and they are also consistent with the this phase, gas-phase chemistry, freezing on to dust particles
canonical elemental abundance ratio of 6.5 in the local ISM and subsequent surface processing, occurs.
(Milam et al. 2005; Marty et al. 2011). This translates into We have considered two cases, depending on the duration
elemental abundance ratios HC14 N/HC15 N of 380 ± 145 and on the pre-shock phase. In the first case (”short” duration),
H14 NC/H15 NC ≈ 320 ± 160 towards L1157-mm. Both values one considers the extreme case where the jet impacts the
are consistent with the solar value in the local ISM (440; cloud as soon as the latter is formed; in the second case
MNRAS 000, 1–?? (2021)12
Figure 7. Time-dependent fractional abundances (with respect to the number of hydrogen nuclei) of HCN and HNC across a protostellar
shock propagating at V = 20 km s−1 (top) and V = 40 km s−1 (bottom), respectively. (left)”Long” pre-shock phase. (right) ”Short” pre-
shock phase. The abundances of HCN (black) and HNC (magenta) in the gas phase and on the dust grains are indicated by the solid and
the dashed curve, respectively. The temperature profile across the shock is drawn with the red dash-dot curve. The fractional abundances
measured towards L1157-B1 and their uncertainties are indicated by the blue rectangles. The vertical dotted line at t = 1500 yr indicates
the estimated age of the shock by Podio et al. (2016).
(long” duration), one begins with a situation where 5 mil- 10−9 and 1.1 × 10⁻⁹ for HCN and HNC, respectively, relative
lion years pass after the cloud is formed and before the shock to H. The key observational constraint here is that the abun-
arrives. The density at the end of Phase I is a free parameter, dances of HCN and HNC in the gas phase are similar. As
called from now on the pre-shock density. The second phase can be seen in Fig. 7, our chemical modelling succeeds in re-
computes the time-dependent chemical evolution of the gas producing similar gas phase abundances for HCN and HNC
and dust during the passage of a magnetized (C-type) shock in the pre-shock phase. The HCN/HNC ratio barely varies
whose structure is at steady-state. between the long duration (∼ 1) and the short duration sce-
Figure 7 presents the variations of the HCN and HNC nario (∼ 2). Both scenarios also predict correct gas phase
molecular abundances relative to the number of H nuclei as abundances relative to H, of the order of 10−9 (Table 3).
a function of time through the shock, as predicted by our The short duration scenario predicts gas phase abundances
model for the shock velocities Vs = 20 km s−1 (top) and in slightly better agreement with our observational determi-
Vs = 40 km s−1 (bottom) and for the durations of the pre- nations, within the observational uncertainties. The ”long”
shock phase, long (left) and short (right). The HCN (HNC) duration scenario predicts abundances higher by a factor of
abundance in the gas and the solid phase are drawn in solid 3. The gas phase abundances of the rare isotopologues are
and dotted black (magenta), respectively. In this figure, the also in good agreement with our observational determina-
shock is propagating to the left. Since the shock is propa- tions and with the absence of 13 C and 15 N fractionation, as
gating at steady state, the time variations of the different discussed above in Sect. 5.3.
physical or chemical parameters (temperature, density, abun- In the gas phase, HNC and HCN are efficiently produced
dances) can simply be converted into space variations, via by the dissociative recombination (DR) of HCNH+ with a
the relation z= Vs × t, hence giving access to the shock struc- branching ratio ≈ 1 (Herbst et al. 2000; Mendes et al. 2012):
ture itself. The observational determinations of the gas phase
HCNH+ + e− → HNC + H, HNC + H.
abundances of HCN and HNC and their uncertainties are in-
dicated by the dark blue rectangles. Several other routes involving neutral-neutral reactions can
substantially contribute to the formation of HCN, especially
at higher densities (and hence at later times). The dominant
route of ”destruction” for both species is freeze-out on the
5.4.1 Pre-shock phase
dust grains.
Our modelling of the pre-shock phase is consistent with the We show in Fig. 7 (in magenta dashed) the abundances of
physical and chemical conditions in the envelope of L1157- HCN and HNC on the dust grains (respectively s-HCN and
mm, i.e., cold gas at 10 K of moderate density (n(H2 ) = s-HNC). The main difference between the short and the long
105 cm−3 ), for which we determined an abundance of 1.2 × duration Phase 1 models lies in fact in the solid HCN/HNC
MNRAS 000, 1–?? (2021)You can also read