Half-year report 2021 - Statnett
←
→
Page content transcription
If your browser does not render page correctly, please read the page content below
Half-year report 2021

Table of contents
    3   Highligts
    4   Key figures and alternative performance measures
    5   Operating and market information
    6   Sustainability and safety
    9   Investments and projects
   12   Financial results
   14   Outlook
   15   Financial reporting
Statnett Group H1 2021                                                                                                       3

Highlights

In the first half of 2021, Statnett processed as many             In the first half of 2021, the Statnett Group posted an
connection requests as in the whole of 2020. ”Going               underlying profit after tax of NOK 862 million (NOK 1,209
green faster” is a reality, and the name of Statnett’s            million). The consolidated profit after tax for the reporting
new strategy adopted by the Board of Directors in                 period closed on NOK 590 million (NOK 1,121 million).
June. Statnett will deliver a security of supply of               Statnett’s lower revenue balance increased by NOK 349
electrical power and facilitate sustainable value                 million during the first half-year.
creation on the way to a zero-emission society. The
pace of the energy transition is accelerating, and                Other key events
Statnett must plan, a power system that takes into                •   The NordLink subsea interconnector between
account power consumption of up to 220 TWh by                         Norway and Germany went into ordinary operation
2050, compared with 140 TWh today.
                                                                      in March and was officially opened on 27 May. The
                                                                      623-kilometre cable has a capacity of 1,400 MW.
The operational situation was satisfactory throughout the
                                                                  •   The work on laying the North Sea Link subsea
first half of 2021, with stable system and infrastructure
                                                                      interconnector between Norway and the UK was
operations throughout Norway. The power situation was
normal throughout the period. While the first two months of           completed on 15 June and testing has been
the year were cold, with relatively little precipitation, there       underway throughout the summer. Trial operations
was slightly more precipitation than normal in the                    are due to start on 1 October 2021. At 720
Norwegian power plant reservoirs in the period as a whole.            kilometres, the interconnector is the world’s longest
At the start of the year, the hydrological balance in Norway          subsea power cable and has a capacity of 1400
was in deficit by around 3 TWh.                                       MW.
                                                                  •   In the Western Corridor, the last of eight new 420
New power consumption records were set several times in               kV substations went into operation in Suldal
Norway during the first half of the year. January also saw            Municipality on 27 May. The final 420 kV power line
record-high power production. Cold weather, higher gas                section between Hyland and Saurdal is due to be
prices in continental Europe, and a higher carbon cost also           energised in the autumn.
pushed the power price to a record-high level throughout          •   Statnett has reduced the grid rental for 2021 to its
much of the period. Total Norwegian power production and              direct customers by 24 per cent compared with
consumption resulted in a net export of around 7 TWh, up
                                                                      2020 to help alleviate the financial consequences
from 6 TWh in the first six months of 2020. Trading capacity
                                                                      of the Covid-19 pandemic on Norwegian
with international markets was affected by several long-
                                                                      consumers and industry.
term incidents. Despite this, capacity was significantly
                                                                  •   On 14 April, the RME published a report outlining
higher than in the same period in 2020, partly due to the
                                                                      changes in the calculation of Statnett’s cost norm
NordLink interconnector to Germany entering operation.
                                                                      and revenue cap – i.e. how much grid rental
                                                                      Statnett can collect. The changes will not have a
                                                                      major impact on the revenue cap in 2021.
                                                                  •   Hilde Tonne replaced Auke Lont as Statnett’s CEO
                                                                      on 15 March 2021.

Profit after tax
Statnett Group H1 2021                                                                                                                              4

Key figures and alternative
performance measures*
                                                                                                                   H1                        Year
Key figures (Amounts in NOK million)                                                                  2021               2020                2020

Accounting profit
Operating revenue                                                                                    5 279               4 776             10 761

Depreciation and amortisation      1)                                                               -1 471              -1 365             -2 820

Operating profit                                                                                     1 039               1 604              3 868

Profit for the period                                                                                  590               1 121              2 697

Adjustments
Change in higher/lower (+/-) revenue befor tax                                                         349                 113               -874

Change in higher/lower (+/-) revenue after tax                                                         272                  88               -682

Accumulated higher/lower (+/-) revenue                                                                 290                 845                 -60

Underlying profit (adjusted for change in higher/lower revenue)2)
Underlying operating profit                                                                          1 388               1 717              2 994

Underlying profit for the period                                                                       862               1 209              2 015

Key figures balance sheet
Investments (additions, facilities under construction and purchased grid                             3 231               3 351              7 298
infrastructure)
Equity adjusted for higher/lower revenue after tax                                                  18 890              17 858             18 896

Total assets                                                                                        83 694              84 997             82 885

Capital employed   3)                                                                               68 669              65 196             68 382
Equity ratio after tax, adjusted for higher/lower revenue   4)                                     22,6 %               21,0 %             22,8 %

Key figures, Operations
Number of full-time equivalents                                                                      1 632               1 556              1 576

Sickness absence %                                                                                   2,5 %               3,0 %              2,8 %

Lost-time injuries, own employees                                                                         3                  3                      4

Lost-time injuries, including suppliers/contractors                                                       8                  7                  17
1)Depreciation, amortisation and impairments per statement of total comprehensive income less impairments disclosed in Note 4, Facilities
under construction.
2) The underlying profit is based on regulated permitted revenue, while the accounting result will vary depending on established tariffs, charges
and congestion revenue. The difference is known as higher/lower revenue (see Note 2).
3) Capital employed = Property, plant and equipment + Facilities under construction + Trade and other current receivables + Trade and other

current payables
4)Return on equity after tax, adjusted for higher/lower revenue = Equity adjusted for higher/lower revenue / total assets.
* To provide a better understanding of Statnett’s underlying result we also present a number of alternative performance measures. Alternative
performance measures are defined in ESMA’s guidelines as a financial measure of historical or future financial performance, financial position,
or cash flows, other than a financial measure defined or specified in the applicable financial reporting framework. Statnett’s alternative
performance measures are adjusted for higher/lower revenue, and supplement the figures in the IFRS financial statements. Reported
accumulated higher/lower revenue also includes applied interest and any prior-year adjustments.
Changes in selected key financial and operational ratios used by management to monitor alternative performance measures over time are also
shown.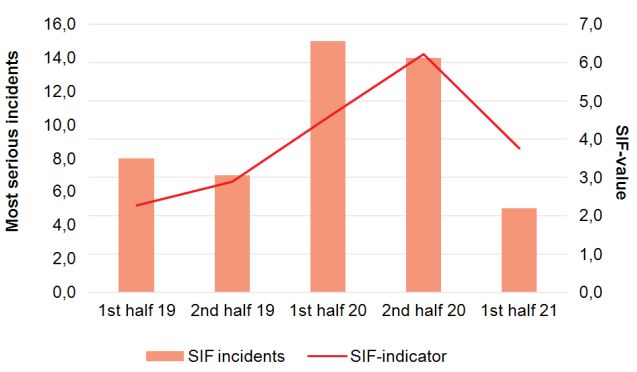
Statnett Group H1 2021                                                                                                     5

Operating and market information

The power situation was normal throughout the first half of      Svenske kraftnät (Svk) reduced the export capacity for
2021. While the first two months of the year were cold, with     NO1->SE3 on grounds of operational safety in Sweden
relatively little precipitation, there was slightly more         throughout the period. From week commencing 1 March,
precipitation than normal in the period as a whole.              Svk also reduced the import capacity for SE3->NO1 due to
Although the situation was generally good throughout the         restrictions the east-west flow in Sweden and lower
first half-year, several localities experienced reduced          nuclear power production. In addition, Statnett has recently
flexibility during the spring due to depleted local reservoir    limited the export capacity to Sweden in order to avoid
levels. The local challenges were compounded by a                overloading the transmission grid in Østfold.
relatively late start to the snowmelt.
                                                                 The start of the period was characterised by cold weather,
At the start of the year, reservoir levels were at 82.2 per      high power prices, and new records for both consumption
cent of capacity, 14.3 percentage points above the median.       and production. Towards the end of the period, warm
At the end of June, reservoir levels were at 65.5 per cent       weather in Eastern Norway necessitated significant system
of capacity, 3 percentage points above the median. At the        (down-) regulation as the heat resulted in low transmission
same date, the hydrological balance in Norway was in             limits on the 132 and 300 kV power lines. The grid
deficit by around 3 TWh. Norwegian power production and          restrictions created significant price differences between
consumption for the first six months of the year totalled 80     South and North Norway.
TWh and 73 TWh, respectively. This resulted in a net
export of 7 TWh.                                                 There was only one extreme weather alert during the
                                                                 winter. Storm “Frank” disrupted several of Statnett’s power
Trading capacity with international markets was also             lines in both North and South Norway, but no incidents
affected by several long-term incidents during the reporting     resulted in extensive blackouts. However, some end users
period. The NordLink subsea interconnector between               were impacted by outages in various distribution grids.
Norway and Germany went into commercial operation on
9 December 2020. Statnett has generally operated with full       The period featured many days with abnormally high
trading capacity since January, although TenneT’s trading        imbalances and forecast deviations, which resulted in
capacity has been reduced due to conditions in the               correspondingly large regulation requirements. A new
German grid. The interconnector experienced multiple             market to secure sufficient down-regulation reserves,
outages, primarily due to faults at transformation               market for contracting mFRR (direction down), was
substations, all of which were of relatively short duration.     opened in week commencing 19 April.
The NordNed power line was out of operation due to cable
faults on the Dutch side from 18 January to 30 March, while      Duty rosters, staffing levels and shift rotas continued
import capacity on the Skagerrak interconnector is still         normally during the period despite the coronavirus
impaired due to faults on the land cable in Denmark in           situation.
2019.

Reservoir levels Norway                                          Production and consumption Norway

                                            Unit              2021
                                                     Ambition level           H1 2021            H1 2020                2020
Non-Delivered Energy (NDE)                 MWh               1,250                183                263               1,381
Frequency variances                      Minutes            10,000
                                                            Target              5,497              7,287               9,693
Statnett Group H1 2021                                                                                                         6

Sustainability and safety

Statnett will conduct itself in a sustainable, ethical and        New strategy to reinforce our sustainability
socially responsible manner. The Group has taken
several measures to strengthen and systematise our
                                                                  framework
sustainability efforts, and our new strategy will further         Statnett adopted a new strategy in June 2021, with a key
reinforce our work in this area as well as within                 focus on sustainability work. Reinforcing follow-up of our
personal safety.                                                  sustainability efforts along the supply chain and increasing
                                                                  diversity in our own organisation will be the main elements
Statnett uses the UN’s Sustainable Development Goals as           of the new strategy. We will systematically strive to meet
a framework to systematise its sustainability work. We            the upcoming requirements and expectations of ESG1 and
contribute to seven of the UN’s Sustainable Development           TCFD2 reporting. We will reinforce our environmental
Goals through our social and corporate social                     efforts by focusing in particular on preserving biodiversity
responsibility mandates. We have formalised our                   and landscapes. We have also set a target of reducing
commitment to work for the realisation of these goals by          greenhouse gas emissions by 25 per cent by 2025 and by
joining the UN’s sustainable business initiative: the UN          50 per cent 2030, with an ultimate goal of achieving a zero-
Global Compact.                                                   emission power system by 2050.

Statnett has three participants in the Young Sustainable          Qualification of suppliers and requirements incorporated in
Development Goals Innovators Program (YSIP) through               supplier contracts play an important role in promoting
the UN Global Contact. The programme is intended to               social and environmental considerations. In the first half of
encourage employees of UN Global Compact member                   2021, we clarified our requirements around pay and
businesses to learn about the sustainable development             working conditions at our suppliers. In addition, the Group
goals and how to meet sustainability challenges in their          has revised its Supplier Code of Conduct. This means that
own company.                                                      suppliers who are listed on the Government Pension Fund
                                                                  Global’s (Oil Fund) exclusion list or the World Bank’s
                                                                  debarment list may be prohibited from participating.

 1 ESG stands for Environmental, Social and Governance. It is a term used primarily by investors, fund managers and the financial
 sector.
 2 TCFD stands for Task Force on Climate-Related Financial Disclosures.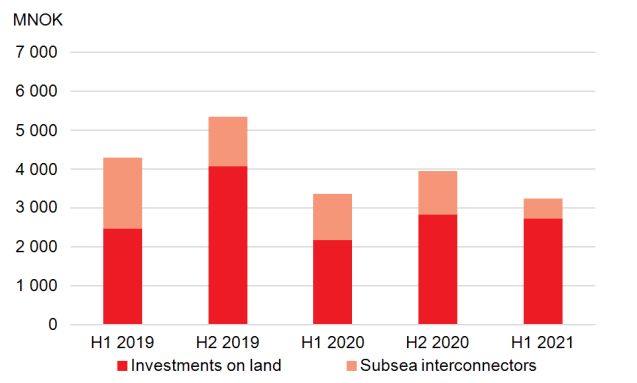
Statnett Group H1 2021 7
There were two environmental incidents in the first half of Statnett reports the LTIF indicator (work-related lost-time
2021. One incident involved a diesel leakage from an injuries), the TRIF indicator (total recorded injuries
emergency generator room at one of our substations, frequency) and the SIF (serious incident frequency
where around 300 litres of diesel seeped into the ground, incidents with actual or potentially serious consequences).
close to water and watercourses. The other incident was a
major SF6 discharge during the installation of a new 420 Having reached a low figures in 2020, the LTIF indicator
kV GIS facility at Sogn transformer substation. The for own employees continued to fall in the first half of 2021
reported discharge of 271 kg SF6 gas occurred while gas and the indicator has been improving since 2019.
containers were being refilled before the site was taken However, the total number of personal injuries has
over by Statnett. The discharge was reported to the increased compared to the first six months of the year
authorities by the contractor who installed the system, who 2020. The internal LTIF and TRIF indicators have fallen by
has since carried out an investigation. respectively 48 per cent and 19 per cent over the last 12
months.
Green financing
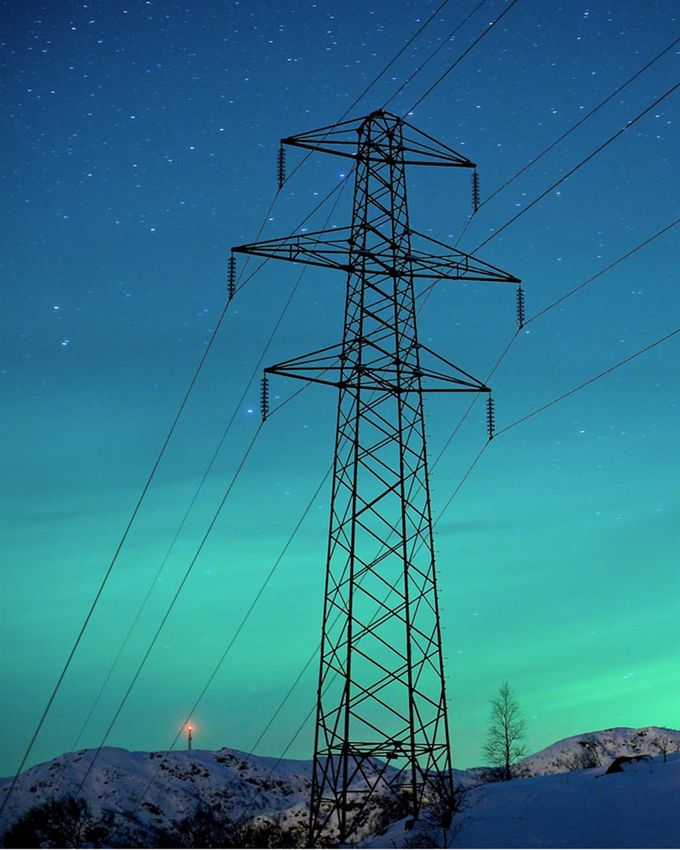
In recent years, Statnett has focused on improving and From a high level at the end of 2020, the SIF indicator has
publishing information on Statnett’s work on sustainability. steadily fallen in the first half of 2021 as a result of
The information has in particular been aimed at the systematic work on measures relating to HSE culture and
external market for Green bonds, which are used to monitoring, including a dedicated safety climate survey.
finance construction projects with a positive climate Three internal SIF incidents have been recorded so far in
impact. Statnett has been certified by CICERO (The 2021, the lowest number for some time.
Centre for International Climate Research), gaining the
highest-possible climate rating of “dark green”. In 2020, The number of electrical safety incidents in projects has
Statnett took out its first green bonds with a combined fallen in 2021. This is partly attributable to the completion
value of NOK 3.6 billion, followed by a further NOK 1.4 of one of our largest power line projects (the Western
billion in the first half of 2021. Corridor) around the end of the year, as well as sharper
focus on electrical safety in some of our largest power line
Statnett reports annually on sustainability in accordance projects and close monitoring of suppliers, including at
with the international Global Reporting Initiative. See overarching level.
www.statnett.no and Statnett’s 2020 Annual Report.
Statnett is experiencing increasing levels of potentially
hazardous activity close to live installations, in particular
A safe workplace
under power lines. Such activities are routinely recorded
Despite the ongoing coronavirus pandemic, Statnett’s
and appropriate measures are taken, and there is an
personal safety indicators for projects and operations have
ongoing need to raise awareness among businesses and
been satisfactory in 2021.
the public about the risk of such activities.
SIF-value 12 months rolling average Group LTIF-value rolling 12 month and lost-time injuries Group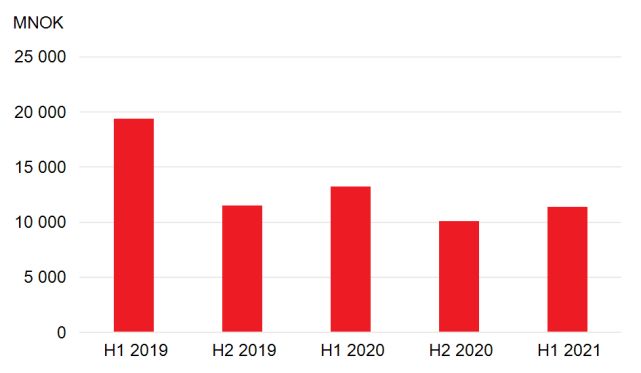
Statnett Group H1 2021                                                                                                    8

In the first half of the year, we conducted three surveys and   Covid-19 has continued to strongly impact
one investigation of incidents and hazardous conditions
                                                                daily life in 2021
affecting the SIF indicator. Two of these involved the use
                                                                The coronavirus situation is still affecting people’s daily
of snow scooters and two related to personal safety at
                                                                and working lives. The majority of Statnett’s employees
electrical installations (electrical safety.)
                                                                continued to work from home in 2021. Through working
                                                                environment surveys and close dialogue with Statnett’s
Selected other improvement measures in 2021:
                                                                various resource pools, we have closely monitored the
                                                                working environment and implemented targeted measures
• Extensive training on the use of potentially hazardous
                                                                where necessary. We have prioritised effective measures
  work equipment
                                                                for young and new employees, while always safeguarding
• E-learning to increase awareness around work in               our critical functions. At the start of the pandemic, the
  electromagnetic fields (EMFs)                                 measures largely related to practical matters such as
• Preparation of traffic safety training for everyone who       ergonomics and technical equipment, while psychosocial
  uses vehicles on company business, which will be              measures have become more important the longer the
  implemented next winter.                                      pandemic has gone on.
• Statnett has taken a number of measures to record
  suppliers’ willingness to report incidents and                The pandemic has made us realise that it is possible to
  improvement proposals in projects.                            deliver our projects despite having limited opportunities to
• We have continued our efforts to encourage suppliers          meet in person. We will take these experiences on board
  to take responsibility for HSE and electrical safety.         when our staff start returning to the physical workplace. We
                                                                are looking forward to being able to meet in person to
                                                                strengthen the working environment and sense of
                                                                community, and facilitate collaboration and competence
                                                                sharing.

                                                                The coronavirus pandemic is placing an increasing strain
                                                                on work schedules and finances in several of our projects
                                                                due to reduced efficiency of work operations. Much of this
                                                                is attributable to travel restrictions for foreign workers.
Statnett Group H1 2021 9
Investments and projects
Investments Environment, Transport and Construction plan is yet
In the first half of 2021, Statnett made total investments of to be approved.
NOK 3,231 million, compared with NOK 3,351 million in the Planned investments
first six months of 2020. These include investments related • Solution approved for the following projects:
to commissioned grid projects, projects under construction, Lebesby–Seidafjellet, Bærheim new substation,
ICT and other investments, as well as acquisitions of grid Tegneby (Langerud) substation, Fana and Litle Sotra
infrastructure from other grid owners. Total investments for increased transformation, Cable Kollsnes–Lille Sotra
2021 are expected to come in at around NOK 6.8 billion.
(Øygards cable), Frogner Refurbishment control
The largest projects are shown in the table on the following
gear and switchgear, Sima–Samnanger
page.
reinforcement and Stølaheia new transformer
Important project-related events substation (Krossberg).
Completed • Investment decision approved for the following
• NordLink (inerconnector to Germany): The subsea projects: Vinnelys new substation, Lindås –
power cable between Norway and Germany, as well increased transformation capacity, Songa
as the converter stations on the Norwegian and refurbishment control gear and Increased
German sides, went into ordinary commercial Transformer Capacity Moskog.
operation.
• Dale new substation (Dalekvam transformer
• Western Corridor: Hylen substation was substation): A licence application was submitted to
commissioned in May (last of eight 8 new 420 kV the NVE in January, and the investment decision was
substation installations in the project). As a result of approved in April.
the commissioning, the 420 kV Sauda–Hylen and the
• Licence application submitted to the NVE for the
Hylen–Saurdal power lines were energised. following projects: Orkdal – Transformer substation,
• Kristiansand Reinvestment 300 kV: The project was Tokke refurbishment substation and Aurland I
completed in June. substation reinvestment
• Hofstad – increased transformation capacity: The Digital development
project was completed in January.
• New Nordic Balancing Model (NBM): Several
Under construction building blocks for automation of the balancing
• North Sea Link (cable to the UK): Work to lay the system have been developed. Exchange of reserves
subsea power cable between Norway and the UK between the Nordic TSOs started.
was completed in June. • IFS10: Upgraded version of Statnett’s ERP system
• Sogn – Ulven new cable connection and Klæbu new rolled out in May.
infrastructure centre: Decision taken to start • Operations-critical data grid: Reinvestment decision
execution phase. approved.
• Hadselfjorden – refurbishment of cable installation:
Licence granted by the NVE in January, but the A list of projects with a total cost of more than NOK 500
million is presented on the following page.
Development investments Development plants and construction
Unit Target for 2021 H1 2021 H1 2020 2020
Finished power lines Km 158 76 103 225
Commissioned field circuit breakers Number 97 30 24 67Statnett Group H1 2021 10
List of investment projects with a total cost of more than NOK 500 million*)
See www.statnett.no for more information about the projects.
Expected investment
Project Location (MNOK)
Completed
Cable to Germany (NordLink)
Under construction
Western Corridor, voltage upgrade South 6,400–6,500
Balsfjord–Skaidi, 420 kV power line North 4,090–4,230
Sogn–Ulven, new 420 kV cable installation East 2,020–2,520
2)
Lyse–Fagrafjell, new power line and substation South 2,020–2,080
Smestad–Sogn substation and cable installation East 1,530–1,570
Hamang, new transformer substation East 900–960
Rød, refurbishment of control gear and switchgear equipment and increased
East 750–780
transformation capacity
Sogn, transformer substation reinvestment East 560–570
Kvandal–Kanstadbotn refurbishment North 620–650
Salten, new substation solution North 545–575
Sylling, reinvestment East 545–565
Cable to UK (North Sea Link) 1) MEUR 750–850
Final licences granted
Åfjord–Snilldal, new 420 kV power line and cable installation Central 1,900–2,700
3)
Aurland–Sogndal, voltage upgrade West 940–1,050
Aura/Viklandet–Surna, voltage upgrade Central 500–700
Planned investments and licences pending
Skaidi–Hammerfest 420 kV power line North 1,800–2,300
Skaidi–Lebesby (Adamselv), new 420 kV power line North 1,550–1,740
Haugalandet grid reinforcement West 1,150–1,350
Krossberg new substation (Støleheia) West 585–640
Liåsen new substation East 565–635
Vinnelys new substation North 500–555
Karmøy reinvestment / new substation West 530–640
4)
Hamang–Bærum–Smestad 420 kV power line and Bærum substation East 240–320 / 1120–1370
Digital development
Roll-out of operations-critical grid 528–565
New Nordic Balancing Model (NBM) 520–620
1)
Statnett’s share Exposure mainly in EUR, including for agreements with partners in the UK.
2)
Cost range does not include clearance of the Stokkeland substation.
3)
The crossing over Sogndalsfjorden is under appeal at the Ministry of Petroleum and Energy (OED).
4)
Cost range relates to overhead/underground cable solution, where the underground cable solution includes costs for accelerated completion of the
Bærum substation.
*) Total value of ongoing projects over NOK 500 million amounts to approximately NOK 32- 36 billion, in addition to this NSL in EUR in the table above.
The amounts in the table show the expected interval for project costs.
All costs for “Projects under construction” are shown at the current exchange rate, other projects are shown at 2021 rates, excl. interest on construction
loans and currency hedgingStatnett Group H1 2021 11
Financial results
Operating revenue interest rates. Permitted revenue also increases in line
In the first half of 2021, Statnett’s consolidated with higher power prices. A higher revenue base due to
operating revenue were NOK 5,279 million (NOK 4,776 expenses that are included in permitted revenue with a
million). Operating revenue from regulated activities two-year time lag also increase permitted revenues.
accounted for NOK 5,145 million (NOK 4,631 million),
while other operating revenue totalled NOK 134 million If actual revenues from grid operations deviate from
(NOK 146 million). permitted revenue in a year, this gives rise to higher or
• Statnett has decided to decrease tariff revenue lower revenue. In the first half of 2021, Statnett
from the fixed tariff component, to alleviate the recorded lower revenue (see Note 2) of NOK 349 million
effects of the coronavirus pandemic. This has (NOK 113 million). At the end of June, accumulated
reduced total tariff revenue by NOK 567 million. lower revenue amounted to NOK 290 million. The lower
This has among other been offset by a NOK 419 revenue is mainly attributable to reduced tariff revenue
million increase in the energy component due to following the decision to reduce the fixed tariff
significantly higher power prices in 2021. components for 2021, as well as higher permitted
Consequently, tariff revenue as a whole increased revenue. High congestion revenue is partially offsetting
by a modest NOK 7 million in the first half of 2021. the increase in lower revenue. The lower revenue has
• Congestion revenue in the first half of 2021 was not been recognised in the balance sheet.
NOK 446 million higher than the same period last
year. The increase primarily follows from Operating costs
differences in power prices between Norway and In the first half of 2021, total consolidated operating
respectively Sweden, Denmark, Netherlands and costs amounted to NOK 4,240 million (NOK 3,173
Germany. In addition the commissioning of million).
NordLink gave rise to increased transmission • Higher costs for system services of NOK 314
capacity with international markets. The increase is million are primarily due to an increase in reserve
also attributable to long-term outages on NordNed power following a long period of cold winter weather
in 2020, while the operations was stable in 2021. and occasionally extremely high prices in the
Reduced transmission capacity within Norway due capacity market. In addition, the upgrading of the
to maintenance work is contributing to high prices Western Corridor has increased the need for
in South Norway and low prices in North Norway, system regulation.
and consequently high congestion revenue. • Transmission losses rose by NOK 494 million on
the back of higher power prices and a higher
The Group’s operating revenues are primarily regulated volume.
through a cap for permitted revenue established by the • Personnel costs increased by NOK 20 million. The
RME. In the first half of 2021, permitted revenue increase follows from a higher headcount which
amounted to NOK 5,492 million (NOK 4,741 million). was largely offset by higher hourly sales from
The higher permitted revenue is attributable to a higher investment projects.
revenue base following the completion of new
installations, which has been offset by a slightly lower
regulated rate of return as a result of lower market
Total operating revenue Higher/ lower revenueStatnett Group H1 2021 12
• Amortisation and impairments were up NOK 94 Cash flow
million due to completed installations and a higher The net cash flow for the period amounted to NOK
level of capitalisation towards the end of 2020, 1,455 million (NOK 2,371 million).
including for the North Sea Link, Balsfjord–Skaidi • The consolidated cash flow from operating
and the Western Corridor. activities closed the first half of the year on NOK
• The increase in other operating costs of NOK 148 1,791 million (NOK 2,684 million).
million relates to higher activities in digitalisation • The net cash flow from investing activities came in
projects, development of IT systems for balance at NOK -2,950 million (NOK -4,562 million).
settlement and market coupling, and the roll-out of • Total loan repayments of NOK 7,108 million were
a new ERP system. In addition, costs of operation,
made, while new loans of NOK 11,700 million were
maintenance and emergency preparedness
taken out.
agreements are increasing due to the purchase of
• At reporting date, consolidated cash and cash
infrastructure as a result of the EU’s third electricity
equivalents and market-based securities totalled
market package. Insurance premiums have
NOK 3,914 million (NOK 4,792 million).
increased due to the putting into operation of
• Total consolidated unused drawing rights
NordLink and damage to offshore interconnectors.
amounted to NOK 8,000 million.
Property tax increased by NOK 43 million.
Income statement Balance sheet
Statnett posted a consolidated operating profit of NOK At the end of June, the Group had total assets of NOK
1,039 million in the first half of 2021 (NOK 1,604 83,694 million (NOK 84,997 million).
million). The decrease is mainly due to extremely high • Interest-bearing liabilities totalled NOK 56,473
power prices so far this year, compared with historically million (NOK 58,668 million), and included
low power prices in 2020. guarantees under the CSA scheme of NOK 4,329
million (NOK 7,836 million). The market value of
Consolidated net financial items closed on NOK -289 recognised interest and currency swaps (fair value
million (NOK -204 million). hedges) relating to interest-bearing liabilities
• The decrease in financial income in the first half of amounted to NOK 4,728 million. Adjusted for the
2021 is attributable to a received dividend of NOK above, interest-bearing liabilities totalled NOK
129 million in 2020 due to a change in ownership of 51,745 million.
the Nord Pool Group. • Adjusted for higher/lower revenue, the equity ratio
• Average net borrowings were NOK 7.9 billion was 22.6 per cent at the end of the first half of the
higher in the first half of 2021, compared with the year (21.0 per cent). Adjusted for interest and
same period in 2020, while the borrowing interest currency swaps, the equity ratio was 23.9 per cent
rate was significantly lower (0.86 percentage (23.5 per cent).
points). This reduced financial costs by NOK 113
million.
• A reduction in the value of derivatives (NOK/SEK
interest and currency swaps (NOK 18 million) and
other securities (NOK 24 million) increased
financial costs. Balance sheet values and equity ratio
In the first half of the year, the Group posted a profit
after tax of NOK 590 million (NOK 1,121 million).
Adjusted for the change in higher/lower revenue not
recognised in the balance sheet, the underlying profit
after tax amounted to NOK 862 million (NOK 1,209
million). The reduction in the underlying profit is mainly
attributable increased costs for system services as a
result of high power prices, and other operating costsStatnett Group H1 2021 13
Outlook: Going green faster
The zero-emission society will result in increasing.
radical changes in the European and Nordic
power systems
Europe is on the way to a zero-emission society, at a
constantly accelerating pace.
• The EU has adopted significantly more ambitious
emission goals for 2030 (55 per cent decrease
compared to 1990), where the emissions trading
market has become a key tool.
• The finance sector has become an important driver Historic temperature-adjusted consumption and estimated future
Norwegian power consumption. Source: The Energy report
of the transition.
Storting no 36 (2020–2021)
• Technological and industrial developments in wind
and solar power, batteries, electrolysis and other This means that Statnett will have to maintain a
energy storage are steadily reducing costs. consistently high investment level.
The power system in Europe and the Nordic region is in At the same time, market and system solutions must
the midst of a radical transformation, with increased be developed to manage larger fluctuations in the flow
power consumption, more wind and solar power of power, more complex operations, new market
production, and the phasing out of fossil-fuel driven and instruments and European regulations. Statnett will
nuclear power stations. Offshore wind farms are a key intensify its efforts to develop system and market
element of Europe’s green shift, and a large proportion solutions at the national, Nordic and European levels in
of the new generating capacity is expected to be built in the years ahead. Statnett will also contribute to a
the North Sea. Hydrogen will play a key role in the rational development of a future-proof offshore power
power system of tomorrow, partly by exploiting periods grid in the North Sea. Grid and market solutions for
of surplus renewable power production. offshore wind power will require technological
development, new collaboration models and new
Through joint climate pledges, increased power regulations.
exchange capacity, shared regulations and market
solutions, Norway is becoming more tightly woven into Automated system operations will be essential for
the European energy system. A combination of higher maintaining security of supply in a power system
quota prices and more variable renewable power characterised by higher fluctuations and finer time
production increases price volatility in the markets and resolution. Digital solutions and increased data
improving utilisation of transmission capacity, both in exchange will also facilitate quicker processing of
Norway and abroad. connection requests and open the way for new markets
and new business models.
The green transition is happening right now
Norway offers renewable and flexible power production Statnett's sustainability goals will affect how new grid
and competitive power prices. This creates good installations are constructed and operated and will also
conditions for further electrification and commercial influence Statnett’s optimalisation of its infrastructure.
development. Statnett expects to see a substantial Statnett will therefore be part of the solution for a more
increase in both electricity production and consumption sustainable society and contribute to the fulfilment of
in Norway in the coming decades. The number of UN Sustainable Development Goals.
enquiries from new businesses seeking to be
connected to the grid is continuing to rise, and a number Statnett’s strategy, Going green faster, addresses how
of existing industry and electrification projects are under the company will adapt to the quickening pace of the
development. Statnett’s long-term market analyses energy transition, become a driving force for zero-
show that power consumption in Norway could reach emissions and maintain efficiency and Norwegian
220 TWh by 2050; however, this is by no means certain. competitiveness.
In the light of increased power demand , the importance
of a renewed and strengthened transmission grid isStatnett Group H1 2021 14
Comprehensive income statement
First half Year
(Amounts in NOK million) Note 2021 2020 2020
Operating revenue
Regulated operating revenue 2 5 145 4 631 10 522
Other operating revenue 134 146 240
Total operating revenue 5 279 4 776 10 761
Operating costs
System services 548 234 600
Transmission losses 613 119 253
Salaries and personnel costs 595 575 1 137
Depreciation, amortisation and impairment 4 1 485 1 391 2 873
Other operating costs 1 000 852 2 030
Total operating costs 4 240 3 173 6 893
Operating profit 1 039 1 604 3 868
Financial income 29 195 209
Financial costs 318 399 658
Net financial items -289 -204 -449
Profit before tax 751 1 400 3 420
Tax 161 278 723
Profit for the year 590 1 121 2 697
Other comprehensive income
Changes in fair value for cash flow hedges 130 163 -246
Tax effect -29 -36 54
Other comprehensive income to be reclassified to profit or loss in
101 127 -192
subsequent periods
Changes in estimate deviations of pension liabilities 36 - -114
Tax effect -8 - 25
Other comprehensive income not to be reclassified to profit or
28 - -89
loss in subsequent periods
Total other comprehensive income 129 127 -280
Total comprehensive income 719 1 248 2 416Statnett Group H1 2021 15 Balance sheet (Amounts in NOK million) Note 30.6.2021 30.6.2020 31.12.2020 Assets Non-current assets Intangible assets 1 046 1 030 1 133 Tangible assets 60 918 54 944 60 296 Plants under construction 4 11 400 13 222 10 103 Investment in jointly controlled company and associates 120 116 108 Pension assets 84 99 27 Other non-current financial assets 3 5 030 8 765 6 344 Total non-current assets 78 598 78 177 78 011 Current assets Trade accounts and other short-term receivables 3 929 2 028 1 927 Market-based securities 3 1 401 1 094 1 635 Assets held for sale 254 - 254 Cash and cash equivalents 3 2 513 3 698 1 058 Total current assets 5 096 6 820 4 874 Total assets 83 694 84 997 82 885 Equity and liabilities Equity Contributed capital 5 950 5 950 5 950 Other equity accrued 12 668 11 820 12 988 Total equity 18 618 17 770 18 938 Long-term liabilities Deferred tax 3 289 2 765 3 086 Pension liabilities 259 259 275 Other liabilities 474 532 501 Long-term interest-bearing debt 3 48 627 48 373 47 442 Total long-term liabilities 52 650 51 929 51 304 Current liabilities Short-term interest-bearing debt 3 7 845 10 295 8 687 Trade accounts payable and other short-term debt 3 4 578 4 998 3 944 Tax payable 4 5 12 Total current liabilities 12 426 15 298 12 644 Total equity and liabilities 83 694 84 997 82 885
Statnett Group H1 2021                                                            16

Changes in equity

                                            Other equity                 Contributed
(Amounts in NOK million)     Total equity       accrued    Other items        capital

01.01.2020                       17 783          11 801            33          5 950
Profit/loss for the period         2 696          2 696             -              -
Other comprehensive income          -280            -89          -192              -
Dividends declared                -1 261         -1 261             -              -
31.12.2020                       18 938          13 147          -159          5 950

01.01.2020                       17 783          11 801            33          5 950
Profit/loss for the period         1 121          1 121             -              -
Other comprehensive income          127               -           127              -
Dividends declared                -1 261         -1 261             -              -
30.6.2020                        17 770          11 661           159          5 950

01.01.2021                       18 938          13 147          -159          5 950
Profit/loss for the period          590             590             -              -
Other comprehensive income          129              28           101              -
Dividends declared                -1 039         -1 039             -              -
30.6.2021                        18 618          12 726           -58          5 950
Statnett Group H1 2021 17
Cash flow
First half Year
(Amounts in NOK million) Note 2021 2020 2020
Cash flow from operating activities
Profit before tax 751 1 400 3 419
Loss/gain(-) on sale of fixed assets -4 -5 -13
Depreciation, amortisation and impairment 1 485 1 391 2 873
Paid taxes -3 -3 -4
Interest recognised in the income statement 128 364 602
Interest received 5 11 22
Interest paid, excl. construction interest -294 -428 -707
Changes in trade accounts receivable/payable -1 506 561 699
Changes in other accruals 1 229 -607 -428
Net cash flow from operating activities 1 791 2 684 6 463
Cash flow from investing activities
Proceeds from sale of tangible fixed assets 14 17 49
Purchase of tangible and intangible fixed assets and plants under
4 -2 789 -4 551 -8 505
construction
Construction interest paid 4 -71 -152 -260
Changes in investment in joint ventures, associates and other companies -9 -11 -9
Changes in long term loan receivables 3 -24 - 4
Changes in short term loan receivables 3 -71 - -
Dividend received - 135 135
Net cash flow from investing activities -2 950 -4 562 -8 586
Cash flow from financing activities
Proceeds from new interest-bearing debt 3 11 700 8 554 10 254
Repayment of interest-bearing debt 3 -7 108 -7 458 -8 484
Changes in collateral under CSA (Credit Support Annex) agreements -2 280 3 151 1 923
Proceeds from sale of market-based securities 3 302 1 115 1 188
Purchase of market-based securities 3 - -1 114 -1 764
Dividend paid - - -1 261
Net cash flow from financing activities 2 614 4 249 1 856
Net cash flow for the period 1 455 2 371 -269
Cash and cash equivalents at the start of the period 1 058 1 327 1 327
Cash and cash equivalents at the close of the period 2 513 3 698 1 058Statnett Group H1 2021 18 Selected notes Note 1 – Accounting policies These interim financial statements have been prepared in accordance with International Standards for Financial Reporting (IFRSs) and interpretations issued by the International Accounting Standards Board (IASB), including IAS 34. The interim financial statements do not contain all the supplementary disclosures required in the annual financial statements and should therefore be read in conjunction with the annual financial statements for 2020. The interim financial statements have not been audited. The accounting policies applied for the interim financial statements are consistent with the accounting policies applied in the annual financial statements for 2020.
Statnett Group H1 2021                                                                                           19

Note 2 – Operating revenue

The note present Statnetts Operating revenues and an alternative performance measure regulated by the RME.

Operating revenue
(Amounts in NOK mill)
                                                                                        Year to date           Year
Operating revenue from regulated grid operations                                    2021               2020    2020
Tariff revenue                                                                     3 965           3 958       7 957
Congestion revenues                                                                1 064               618     2 408
Income from other owners in shared grids                                               -8              -119     -221
Total operating revenue from regulated grid operations                             5 021           4 457      10 145

Operating revenue from imbalance settlement                                          124               173      378

Total operating revenue from regulated activities                                  5 145           4 631      10 522

Other operating revenue                                                              134               146      240

Total operating revenue                                                            5 279           4 776      10 761

Permitted revenue regulated operations
(Amounts in NOK mill)
                                                                                        Year to date           Year
Permitted revenue grid operations                                                   2021               2020    2020
Revenue cap                                                                        4 424           3 797       7 464
Supplement to revenue cap                                                            917               835     1 821
Total permitted revenue grid operations                                            5 341           4 632       9 285

Permitted revenue imbalance settlement
Permitted revenue imbalance settlement                                               151               109      363

Total permitted revenue grid operations and imbalance settlement                   5 492           4 741       9 648

Higher/lower revenue -This year's changed and total balance
(Amounts in NOK mill)
                                                                                        Year to date           Year
Regulated grid operations                                                           2021               2020    2020
This year's higher/lower revenue (-/+), not recognized                               320               176      -859
This year's provision for interest higher/lower revenue (-/+), not recognized           -                 4       3
Higher/lower revenue adjustment (-/+), not recognized                                   -                -3      79
Statnett Group H1 2021 20
This year's changed balance for higher/lower revenue (-/+) 320 177 -777
Balance higher/lower revenue (-/+), incl. interest as at 1. Jan -110 667 667
Changed balance for higher/lower revenue (-/+), incl. interest 320 177 -777
Balance higher/lower revenue (-/+), incl. Interest, closing balance 210 844 -110
Year to date Year
Imbalance settlements 2021 2020 2020
This year's higher/lower revenue (-/+), not recognized 26 -64 -15
This year's Interest on change in balances, not recognized 3 - -
Change in balance for Imbalance settlement 29 -64 -15
Balance higher/lower revenue (-/+) 50 65 65
Changed balance for higher/lower revenue (-/+) 29 -64 -15
Balance higher/lower revenue (-/+), closing balance 79 1 50
Year to date Year
Total balance higher/lower revenue 2021 2020 2020
Balance higher/lower revenue (-/+) 01.01 -60 732 732
Change in balance for Grid operations 320 176 -859
Change in balance for Imbalance settlement 26 -64 -15
Interest on change in balances 3 4 3
Prior years' adjustments - -3 79
Total balance higher/lower revenue (-/+), closing balance 290 845 -60Statnett Group H1 2021 21
Note 3 –Financial instruments
The Note provides an overview of the carrying value and fair value of financial instruments, and how these are treated in the
financial statements. The table also shows at which level in the valuation hierarchy the various measurement methods for the
Group’s financial instruments measured at fair value are included, based on the relative objectivity of the measuring methods.
(Amounts in NOK million) Measure- 30.6.2021 30.6.2020
ment level
Assets Classification under IFRS 9 Carrying value Carrying value
Fixed assets
Long-term receivables Amortised cost na 54 49
Subord. capital in Statnett SF's pension fund Amortised cost na 75 75
Financial assets available for sale Fair value through P/L 3 3 3
Derivatives Fair value through P/L 2 4 899 8 637
Derivatives, non-interest bearing Fair value through P/L 2 - 1
Total financial fixed assets 5 030 8 765
Current assets
Trade accounts receivable Amortised cost na 139 102
Derivatives Fair value through P/L 2 - 659
Derivatives, non-interest-bearing Fair value through P/L 2 7 88
Other short-term receivables Amortised cost na 784 1 179
Total trade accounts and other short-term receivables 929 2 028
Market-based securities Fair value through P/L 1 1 401 1 094
Liquid assets Fair value through P/L 1 2 513 3 698
Other liabilities
Derivatives, non-interest-bearing Fair value through P/L 2 1 6
Other liabilities Amortised cost na 473 526
Total other liabilities 474 532
Liabilities
Other long-term interest-bearing debt Amortised cost 2 48 432 47 878
Lease liability Amortised cost na 195 184
Derivatives Fair value through P/L 2 - 311
Total long-term interest-bearing debt 48 627 48 373
Other short-term interest-bearing debt Amortised cost 2 7 801 10 264
Lease liability Amortised cost na 35 31
Total short-term interest-bearing debt 7 845 10 295
Trade accounts payable and other short term debt
Trade accounts payable and other short term debt Amortised cost na 4 517 4 946
Derivatives, non-interest-bearing Fair value through P/L 2 60 52
Total trade accounts payable and other short-term debt 4 578 4 998Statnett Group H1 2021 22
Fair value of Other interest bearing debt recognised at amortised cost 30.6.2021 30.6.2020
Fair value Fair value
Other long-term interest-bearing debt 47 794 49 196
Other short-term interest-bearing debt 3 002 10 264
Total Other interest bearing debt 50 796 59 460
30.6.2021 30.6.2020
Total measurement levels Carrying value Carrying value
Level 1 1 401 1 094
Level 2 -51 398 -49 126
Level 3 78 78
There has not been any transfers between the measurement levels during the period.
Fair value
The fair value of forward exchange contracts is established using the forward rate at the balance sheet date. The fair value of
currency and interest swaps is calculated as the present value of future cash flows. Fair values are mainly confirmed by the
financial institutions with which Statnett has entered an agreement. The fair value of financial assets, trade payables and other
current and interest-bearing liabilities are measured at amortized cost using the effective interest method.
Due to their short-term nature, the carrying value of financial instruments such as available-for-sale financial assets, trade and
other current receivables, cash and cash equivalents, trade and other current payables is deemed to be a fair estimate of fair
value.
Measurement of financial instruments
The Group applies the following hierarchy to measure and present the fair value of financial instruments:
Level 1: Fair value is measured using listed prices from active markets for identical financial instruments. No adjustment is made
for these prices.
Level 2: Fair value is measured using other observable inputs than those used at level 1, either directly (prices) or indirectly
(derived from prices).
Level 3: Fair value is measured using input that is not based on observable market data.
Listed shares, money market and interest funds, bonds and certificates are deemed to be Level 1 since the securities are listed
on a stock market and freely tradable and are measured at the most recent quoted price. Non-listed shares and shareholdings
are valued based on the company’s financial statements and are therefore deemed to be Level 3.
Derivatives are deemed to be Level 2. The currency element of forward exchange rates is measured at observable market prices
using rates from Norges Bank. The fair value of forward exchange contracts also takes account of the interest element inheren t
in the individual contract.Statnett Group H1 2021 23 Note 4 Plants under construction (Amounts in NOK million) 2021 2020 Acquisition cost at 1 January 10 081 11 505 Additions 2 730 3 199 Capitalised construction interest 71 152 Transferred to tangible and other intangible fixed assets -1 496 -1 588 Write-offs -14 -26 Acquisition cost at 30 June 11 372 13 241 Hedge accounting effects 27 -20 Plants under construction at 30 June 11 400 13 222 Contractual obligations Total contractual commitments as of 30 June 2021 amounted to NOK 4.9 billion. The total relates to development projects where future contractual commitments are greater than NOK 50 million.
Statnett Group H1 2021                                                                                               24

Declaration from the Board of Directors and CEO
We confirm that, to the best of our knowledge, the interim financial statements for the period 1 January to 30 June
2021 have been prepared in accordance with IFRSs and that the disclosures in the financial statements fairly present
the company’s and the Group’s assets, liabilities, financial position and performance as a whole. We further declare,
to the best of our knowledge, that the information contained in the Interim Report from the Board of Directors for the
first six months of 2021 fairly presents the performance, results and position of the company and the Group, together
with a description of the key risk and uncertainty factors facing the enterprise.

                                               Oslo, 27 August 2021
                                         Statnett SF’s Board of Directors

    Jan Fredrik Baksaas             Tove Pettersen               Maria Sandsmark                Egil Gjesteland
           Chair                    Board member                  Board member                  Board member

      Wenche Teigland              Christian Reusch             Ingeborg Ligaarden           Ole Bjørn Kirstihagen
       Board member                 Board member                  Board member                  Board member

                                  Steinar Jøråndstad                Hilde Tonne
                                    Board member                        CEO
Statnett SF Postal address: PO BOX 4904 Nydalen NO-0423 Oslo Norway Office address: Nydalen Allé 33 NO-0484 Oslo Tel: +47 23 90 30 00 Fax: +47 23 90 30 01 E-mail: firmapost@statnett.no statnett.no
You can also read