H1 FY22 INVESTOR PRESENTATION - ABN 37 068 516 665 Ainsworth Game Technology Limited
←
→
Page content transcription
If your browser does not render page correctly, please read the page content below
H1 FY22
     INVESTOR
     PRESENTATION

Ainsworth Game Technology Limited
       ABN 37 068 516 665
          ASX Code: AGI

        23 February 2022
Disclaimer

IMPORTANT NOTICE
This presentation has been prepared by Ainsworth Game Technology Limited ACN 068 516 665 (AGT) in good faith. No express or implied warranty is given as to the
accuracy or completeness of the information in this document or the accompanying presentation. All statutory representations and warranties are excluded, and any
liability in negligence is excluded, in both cases to the fullest extent permitted by law. No responsibility is assumed for any reliance by any person on this document or
the accompanying presentation.

Summary information
The information contained in this presentation is a summary overview of the current activities of AGT. This presentation does not purport to be all inclusive or to contain
all the information that a prospective investor may require in evaluating a possible investment. This presentation is for general information purposes and is not intended
to be and does not constitute a prospectus, product disclosure statement, pathfinder document or other disclosure document for the purposes of the Corporations Act
and has not been, and is not required to be, lodged with the Australian Securities & Investments Commission. This presentation should be read in conjunction with all
other periodic and continuous disclosure announcements lodged by AGT with the Australian Securities Exchange, available at www.asx.com.au.

Not financial product advice
The material contained in this presentation is not, and should not be considered as, financial product or investment advice. This presentation is not an offer, invitation or
recommendation to acquire New Shares, and does not take into account the investment objectives, financial situation or particular needs of any particular investor. You
must make your own independent assessment and review of AGT, and the information contained, or referred to, in this presentation, including its financial condition,
assets and liabilities, financial position, profits and losses, prospects and business affairs, including the merits and risks involved. Nothing in this presentation constitutes
investment, legal, tax or other advice. You should seek legal, financial, tax and other advice appropriate for your jurisdiction.

Past and future performance
This presentation contains information as to past performance of AGT. Such information is given for illustrative purposes only, and is not – and should not be relied upon
as – an indication of future performance of AGT. The historical information in this presentation is, or is based upon, information contained in previous announcements
made by AGT to the market. These announcements are available at www.asx.com.au.
This presentation contains certain “forward looking statements”. Forward looking words such as “expect”, “should”, “could”, “may”, “will”, “believe”, “forecast”, “estimate”
and other similar expressions are intended to identify forward-looking statements. Such statements are subject to various known and unknown risks, uncertainties and
other factors that are in some cases beyond AGT's control. These risks, uncertainties and factors may cause actual results, performance or achievements to differ
materially from those expressed or implied by the forward-looking statements and from past results, performance or achievements. AGT cannot give any assurance or
guarantee that the assumptions upon which management based its forward-looking statements will prove to be correct or exhaustive beyond the date of its making, or
that AGT's business and operations will not be affected by other factors not currently foreseeable by management or beyond its control. Such forward-looking
statements only speak as at the date of this announcement and AGT assumes no obligation to update such information.

                                                    CONFIDENTIAL INFORMATION - AINSWORTH GAME TECHNOLOGY LIMITED                                                                    2
AGENDA
1.   Results Summary
2.   Consolidated Results
3.   Segment Performance
4.   Land Based Gaming Products
5.   Online
6.   Outlook

RESULTS
SUMMARY

Results Summary
• Improved performance compared to H1 FY21 and H2 FY21.

                                                                                             Current period             Current period
                                                                 H1 FY22        H1 FY21           vs          H2 FY21        vs
 In millions of AUD                                                                            H1 FY21                    H2 FY21

 Revenue                                                           100.7           72.1           28.6         87.4          13.3

 Underlying EBITDA                                                 20.7            1.1            19.6         14.4          6.3

 Impairment losses (before tax)                                       -           (29.2)          29.2         (12.5)        12.5
 Profit / (Loss) before tax excluding currency and one-off
                                                                   10.0           (18.7)          28.7          1.6          8.4
 items
 Reported Profit / (Loss) after tax                                 9.1           (50.1)          59.2         (3.3)         12.4

• Net cash position of $32.2m with closing cash balance of $46.3m, an improvement on the net debt position of $15.5m at pcp,
  and net cash position of $5.1m at the prior half.

• North America segment contributed 54% of total revenue. HHR products continue to perform.

• Signs of recovery in Latin America region contributing to the Group’s improved results.

• Dividend continues to be suspended to ensure strong liquidity is maintained while markets continues to recover from the effects
  of COVID-19.

                                                             AINSWORTH GAME TECHNOLOGY LIMITED                                           5
Gaming Operations and International Sales Contribution

                            AINSWORTH GAME TECHNOLOGY LIMITED   6
CONSOLIDATED
  RESULTS

Profit & Loss Summary
                                                                            Current period                Current period
                                               H1 FY22          H1 FY21          vs            H2 FY21         vs
              In millions of AUD                                              H1 FY21                       H2 FY21
              Domestic revenue                  16.7              19.2           (2.5)           19.8          (3.1)
              International revenue             84.0              52.9            31.1           67.6           16.4
              Total revenue                     100.7             72.1            28.6           87.4           13.3
              Gross profit                      63.0              37.8            25.2           51.8           11.2
              EBITDA                            24.6             (36.8)           61.4           10.2           14.4
              EBITDA Margin %                   24%              (51%)           75%             12%            12%
              Profit / (Loss) Before Tax        13.9             (56.6)           70.5           (2.6)          16.5
              Income tax (expense) / benefit    (4.8)              6.5           (11.3)          (0.7)         (4.1)
              Profit / (Loss) After Tax          9.1             (50.1)           59.2           (3.3)          12.4
              R&D (% of revenue)                18%               23%            (5%)            19%           (1%)
              EPS (diluted) (A$)                0.03             (0.15)          0.18           (0.01)         0.04

•   Increased revenue due to strong product performance in North America and re-opening of the LATAM market.
•   Decreased domestic revenue compared to pcp and prior half due to extended lockdowns in New South Wales and other states
    within Australia.
•   Profit before tax (excluding currency impact) is $10.4m, compared to $43.2m loss in pcp and $4.5m loss in the prior half.
•   EBITDA of $24.6m includes $3.5m currency translation gains.
•   Increased international revenue of $31.1m compared to pcp, and $16.4m compared to the prior half. International revenue
    accounted for 83% of group revenues in this period.

•   R&D/Revenue at 18% reflects continuation of R&D initiatives.

                                                       AINSWORTH GAME TECHNOLOGY LIMITED                                        8
Results Adjusted For Currency Movement and One-off Items
                                                                                                                Current period                           Current period
                                                                            H1 FY22             H1 FY21              vs                   H2 FY21             vs
 In millions of AUD                                                                                               H1 FY21                                  H2 FY21
 Profit / (Loss) Before Tax                                                    13.9               (56.6)              70.5                  (2.6)               16.5
 Currency (gains) / losses                                                     (3.5)               13.4              (16.9)                 (1.9)               (1.6)
 Impairment losses                                                                -                29.2              (29.2)                 12.5               (12.5)
 JobKeeper subsidies                                                              -                (4.2)               4.2                     -                   -
 Gain on LV parcel of land sale                                                   -                   -                  -                  (3.3)                3.3
 US Employment Retention Tax Credit (ERTC)                                        -                   -                  -                  (3.1)                3.1
 Rent concessions                                                              (0.4)               (0.5)               0.1                     -                (0.4)
 Adjusted For Currency and One-off Items
                                                                               10.0               (18.7)                 28.7                1.6                 8.4
 Profit / (Loss) Before Tax

                                                                                                                Current period                            Current period
                                                                            H1 FY22             H1 FY21              vs                   H2 FY21              vs
 In millions of AUD                                                                                               H1 FY21                                   H2 FY21
 Profit / (Loss) After Tax                                                      9.1               (50.1)                  59.2              (3.3)               12.4
 Currency (gains) / losses(1)                                                  (2.7)               10.9                  (13.6)             (1.7)               (1.0)
 Impairment losses                                                                -                25.7                  (25.7)              9.2                (9.2)
 JobKeeper subsidies                                                              -                (2.9)                   2.9                 -                   -
 Gain on LV parcel of land sale                                                   -                   -                      -              (2.6)                2.6
 US Employment Retention Tax Credit (ERTC)                                        -                   -                      -              (2.4)                2.4
 Rent concessions(2)                                                           (0.3)               (0.4)                  0.1                   -               (0.3)
 Adjusted For Currency and One-off Items
                                                                                6.1               (16.8)                 22.9               (0.8)                6.9
 Profit / (Loss) After Tax

   (1)No tax effect on $1.0m currency gains in H1 FY22 (H1 FY21: $4.9m currency losses, H2 FY21: $0.8m currency gains).
   Calculation of currency (gains) / losses after tax: H1 FY22: (-$1.0m + (-$2.4m x 0.7) = $2.7m gains), H1 FY21: ($4.9m + ($8.5m x 0.7) = $10.9m losses), H2 FY21: (-$0.8m +
   (-$1.3m x 0.7) = $1.7m gains). These net currency gains and losses predominantly relate to balance sheet translation originated from investment in the Americas.

   (2)Calculation   of Rent concessions after tax: H1 FY22: (-$0.4m x 0.7 = -$0.3m), H1 FY21: (-$0.5m x 0.7 = -$0.4m).

                                                                      AINSWORTH GAME TECHNOLOGY LIMITED                                                                         9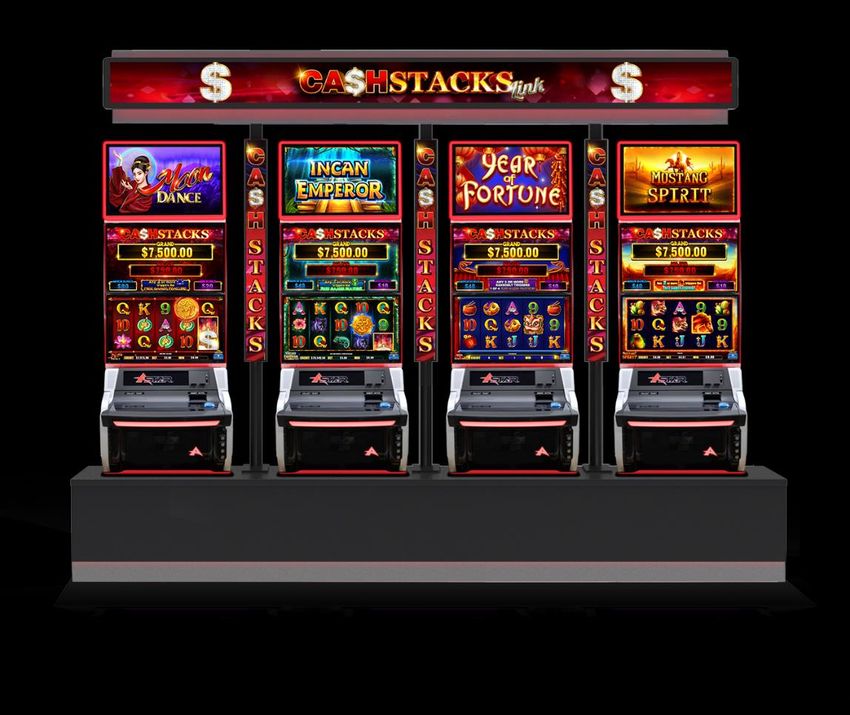
Reconciliation: Profit / (Loss) Before Tax to EBITDA & Underlying EBITDA

                                                                             Current period             Current period
                                                 H1 FY22        H1 FY21           vs          H2 FY21        vs
  In millions of AUD                                                           H1 FY21                    H2 FY21

  Profit / (Loss) Before Tax                       13.9           (56.6)            70.5       (2.6)         16.5
  Net interest (income) / expense                  (0.1)           0.7              (0.8)       0.6         (0.7)
  Depreciation and amortisation                    10.8            19.1             (8.3)      12.2         (1.4)
  Reported EBITDA                                  24.6           (36.8)            61.4       10.2          14.4
  Foreign currency (gains) / losses                (3.5)           13.4             (16.9)     (1.9)        (1.6)
  Impairment losses (LATAM CGU)                       -            23.2             (23.2)      1.5         (1.5)
  Impairment losses (Australia and Other CGU)         -              -                 -        8.0         (8.0)
  Impairment losses (Receivables)                     -            6.0              (6.0)       3.0         (3.0)
  JobKeeper subsidies                                 -           (4.2)              4.2          -            -
  Gain on LV parcel of land sale                      -              -                 -       (3.3)         3.3
  US employment retention tax credit (ERTC)           -              -                 -       (3.1)         3.1
  Rent concessions                                 (0.4)          (0.5)              0.1          -         (0.4)
  Underlying EBITDA                                20.7            1.1              19.6       14.4          6.3

                                                AINSWORTH GAME TECHNOLOGY LIMITED                                        10
Operating Costs
H1 FY22 Current period H1 FY22 Current period
H1 FY22 H1 FY21 at pcp currency vs H2 FY21 at prior half Vs
In millions of AUD basis H1 FY21 currency basis H2 FY21
COGS 37.7 34.3 38.0 3.4 35.7 37.2 2.0
Sales, service and
25.0 25.9 25.3 (0.9) 20.3 24.6 4.7
marketing ('SSM')
R&D 18.0 16.6 18.1 1.4 16.8 17.8 1.2
Administration 10.9 9.3 11.0 1.6 9.5 10.8 1.4
Total Operating costs 91.6 86.1 92.4 5.5 82.3 90.4 9.3
COGS
• Increase in costs attributable due to increased sales compared to the pcp and the prior half.
• Favourable translation impact $0.3m at pcp currency basis and adverse translation impact of $0.5m at prior half currency basis.
SSM Costs
• Decrease in costs compared to the pcp mainly associated with reduced depreciation expenses on impaired assets.
• Increase in costs compared to the prior half due to decrease in COVID-19 related government subsidies, increase in trade show
related expenses, commissions and royalties payable.
• Favourable translation impact of $0.3m at pcp currency basis and adverse translation impact of $0.4m at prior half currency basis.
R&D Costs
• Increase in personnel costs compared to the pcp and prior half as a result of a decrease in COVID-19 related government
subsidies, increase in computer software support and evaluation and testing costs.
• Favourable translation impact of $0.1m at pcp currency basis and adverse translation impact of $0.2m at prior half currency basis.
Administration Costs
• Increase in personnel costs compared to the pcp and prior half as a result of a decrease in COVID-19 related government
subsidies.
• Favourable translation impact of $0.1m at pcp currency basis and adverse translation impact of $0.1m at prior half currency basis.
AINSWORTH GAME TECHNOLOGY LIMITED 11Staff Headcount
# Staff 31-Dec-21 31-Dec-20 30-Jun-21
Australia and Rest of the World
Sales 31 31 33
Service 48 59 56
Production 28 28 28
Administration 24 26 30
R&D 99 115 110
Total Staff Numbers - Australia & Rest of the
235 259 257
World
Americas
Sales 29 28 28
Service 51 47 49
Production 38 36 36
Administration 64 60 61
R&D 55 46 48
Total Staff Numbers - North and Latin America 237 217 222
Total Staff Numbers - Consolidated AGT 471 476 479
AINSWORTH GAME TECHNOLOGY LIMITED 12Net Profit Bridge - H1FY22 vs H1FY21
• Revenue increased due to market recovery in Latin America and strong performance from North America.
• $10.5m increase in in overheads in line with revenue increase and no COVID-19 government subsidies recorded in this period.
• $29.2m decrease in other expenses relates to non-cash impairment charges of trade receivables and write-down of assets for LATAM CGUs in pcp.
• $6.4m currency adjusted profit after tax in H1 FY22 (versus $39.2m loss pcp), excludes $2.7m after tax currency gains (versus $10.9m after tax currency losses pcp)(1).
(1)No tax effect on $1.0m currency gains in H1 FY22 (H1 FY21: $4.9m currency losses).
Calculation of currency (gains) / losses after tax: H1 FY22: (-$1.0m + (-$2.4m x 0.7) = $2.7m gains), H1 FY21: ($4.9m + ($8.5m x 0.7) = $10.9m losses). These net currency gains and
losses predominantly relate to balance sheet translation originated from investment in the Americas.
AINSWORTH GAME TECHNOLOGY LIMITED 13Net Profit Bridge - H1FY22 vs H2FY21
• Revenue increased due to recovery in Latin America and strong performance from North America.
• $8.8m increase in overheads in line with revenue increase and no COVID-19 related government subsidies recorded in this period.
• $12.5m decrease in other expenses relates to non-cash impairment charges of trade receivables and write-down of assets for Australia and Other CGU and LATAM CGU in
H2 FY21.
• $6.4m currency adjusted profit after tax in H1 FY22 (versus $5.0m loss in the prior half), excludes $2.7m after tax currency gains (versus $1.7m after tax currency gains in the
prior half)(1).
(1)No tax effect on $1.0m currency gains in H1 FY22 (H2 FY21: $0.8m currency gains).
Calculation of currency gains after tax: H1 FY22: (-$1.0m + (-$2.4m x 0.7) = $2.7m gains), H2 FY21: (-$0.8m + (-$1.3m x 0.7) = $1.7m gains). These net currency gains predominantly
relate to balance sheet translation originated from investment in the Americas.
AINSWORTH GAME TECHNOLOGY LIMITED 14Balance Sheet
31-Dec-21 31-Dec-20 30-Jun-21
In millions of AUD
Total assets 381.4 389.4 393.1
Net assets 301.7 289.2 287.9
Total debt 14.1 39.5 37.3
Net cash / (debt) 32.2 (15.5) 5.1
Debt Ratios 31-Dec-21 31-Dec-20 30-Jun-21
Debt Ratio (Total Liabilities/Total Assets) 20.90% 25.73% 26.76%
Debt to Equity Ratio (Total Liabilities/Total Equity) 26.42% 34.65% 36.54%
Cash Flow to Debt ratio - (Cash Flow from Operating
38.90% 2.40% 21.14%
Activities/Total Liabilities)
• Receivables closing balance of $103.5m (30 June 21: $116.4m, 31 Dec 20: $107.7m) resulted from increased cash
receipts from customers.
• Inventory closing balance of $55.7m (30 June 21: $56.1m, 31 Dec 20: $64.0m).
• Total debt reduced resulted from $24.4m (US$18.0m) repayment of bank facility made during this current period and
strong cash position resulted to improved cash flow to debt ratio in the current period.
AINSWORTH GAME TECHNOLOGY LIMITED 15Cash Flow Statement
• Strong cash flows, along with effective management of operational expenses, resulted in cash held at the reporting date, an
increase of 93% compared to the pcp, and 9% increase compared to the prior half.
Current period Current period
H1 FY22 H1 FY21 vs H2 FY21 Vs
H1 FY21 H2 FY21
In millions of AUD
Net cash from operating activities 31.0 2.4 28.6 19.8 11.2
Proceeds from sale of property, plant and equipment - 0.1 (0.1) 5.4 (5.4)
Acquisitions of property, plant and equipment (0.8) (0.7) (0.1) (1.5) 0.7
Development expenditure (2.4) (1.1) (1.3) (1.2) (1.2)
Net cash from / (used) in investing activities (3.2) (1.7) (1.5) 2.7 (5.9)
Borrowing costs paid (1.0) (0.9) (0.1) (1.3) 0.3
Proceeds from borrowings 0.3 0.4 (0.1) 36.2 (35.9)
Repayment of borrowings (24.5) (0.1) (24.4) (39.1) 14.6
Proceeds from finance lease 0.4 0.2 0.2 0.9 (0.5)
Payment of lease liabilities (0.6) (0.6) - (1.2) 0.6
Net cash used in financing activities (25.4) (1.0) (24.4) (4.5) (20.9)
Net increase / (decrease) in cash and cash equivalents 2.4 (0.3) 2.7 18.0 (15.6)
Opening cash and cash equivalents 42.4 26.5 15.9 24.0 18.4
Effect of exchange rate fluctuations on cash held 1.5 (2.2) 3.7 0.4 1.1
Cash and cash equivalents 46.3 24.0 22.3 42.4 3.9
AINSWORTH GAME TECHNOLOGY LIMITED 16SEGMENT PERFORMANCE
North America
                                                                                      Current period                 Current period
                                                            H1 FY22       H1 FY21          vs           H2 FY21           vs
    In millions of AUD                                                                  H1 FY21                        H2 FY21
    Revenue                                                  54.6           41.0            13.6              47.5        7.1
    Gross Profit                                             36.8           26.1            10.7              34.0        2.8
    Segment EBITDA                                           28.4           18.6            9.8               32.2       (3.8)
    Segment Profit                                           23.1           12.3            10.8              26.8       (3.7)
    Segment Profit (%)                                       42%            30%             12%               56%        (14%)
    Unit Volume (no.)                                        1,175           876            299               827         348
    ASP (US$’000’s)*                                         18.0           16.7            1.3               17.2        0.8
    Game Operations – Class II Installed Base
                                                             1,453          1,759          (306)          1,731          (278)
    (Including HHR)

    Game Operations – Class III Installed Base                952            963            (11)              981         (29)

    Average Fee per Day (US$)                                 32             32                -              37          (5)
      *Excludes distributor sales, reworks and on-charges

•     Increased profit margin by 12% compared to the pcp as market continues to recover from the pandemic, delivering improved revenue.

•     Strong growth with $54.6m revenue in H1 FY22 increased 33% compared to the $41.0m revenue in the pcp and increased 15% compared to
      H2 FY21.

•     Participation & lease revenue of $16.4m and contributing 30% of the current period’s segment revenue.

•     Maintained average yield on units under Gaming Operation during the period compared to the pcp.

•     Additional opportunities are being pursed for AGT’s leading Historical Horse Racing (HHR) products in current established markets and new
      jurisdictions:
          ✓ Rules have been established in New Hampshire and we have executed orders with a couple initial operators. Anticipate installs to
                begin in May 2022.
          ✓ Initial game orders for Louisiana HHR were shipped in late January (85 units).
          ✓ The Mint in Kentucky expanded an additional new facility in Bowling Green, Kentucky and AGT provided 180 units. An additional new
                facility is anticipated before the end of FY22.

                                                                AINSWORTH GAME TECHNOLOGY LIMITED                                                 18
MTD Gaming
• Commencement of field test for Gamblers Gold in
Nevada at the end of January, anticipating approval
by the end of May 2022.
• MTD products continue to perform well in South
Dakota, with anticipation of an additional 100 units to
be sold in H2 FY22.
• Increased sales in Louisiana where we have
reorganized our commercial arrangements. AGT is
now the licensed manufacturer and Modern Gaming
is the distributer.
AINSWORTH GAME TECHNOLOGY LIMITED 19Latin America
Current period Current period
H1 FY22 H1 FY21 vs H2 FY21 vs
In millions of AUD H1 FY21 H2 FY21
Revenue 22.2 4.8 17.4 13.5 8.7
Gross Profit 15.0 2.6 12.4 8.5 6.5
Segment EBITDA 9.3 (5.4) 14.7 1.1 8.2
Segment Profit / (Loss) 10.0 (10.2) 20.2 1.6 8.4
Segment Profit / (Loss) (%) 45% (213%) 258% 12% 33%
Unit Volume (no.) 889 111 778 514 375
ASP (US$’000’s)* 14.3 16.6 (2.3) 16.7 (2.4)
Game Operations – Installed Base 4,091 4,279 (188) 4,340 (249)
Average Fee per Day (US$) 11 8 3 10 1
*Excludes distributor sales, reworks and on-charges
• Revenue increase of 363% compared to pcp and 64% compared to the prior half as the market recovers from the pandemic which drove
the segment profit to $10.0m, an increase of $20.2m on pcp and $8.4m over the prior half.
• Of the 889 machines AGT sold in the period, 39% were reconditioned units. As vaccination rates increase in these markets, it is expected
that Government restrictions will also be further eased within FY22 and further revenue opportunities can be expected as previously
deferred purchasing decisions are progressed across the region.
• At 31 December 2021, 3,275 units from Game Operations were operating. As the markets continue to recover, additional units are
expected to return to operation.
• Demand continues to grow for the new A-STARTM range of cabinets. Game themes such as Pan Chang, Fiesta Grande, Rio Grande Los
Toritos, and Multi Win Games are top performers.
AINSWORTH GAME TECHNOLOGY LIMITED 20Australia
Current period Current period
H1 FY22 H1 FY21 vs H2 FY21 vs
In millions of AUD H1 FY21 H2 FY21
Revenue 16.7 19.2 (2.5) 19.8 (3.1)
Gross Profit 6.6 5.3 1.3 5.3 1.3
Segment EBITDA 3.8 3.3 0.5 2.1 1.7
Segment Profit 3.3 1.6 1.7 0.8 2.5
Segment Profit (%) 20% 8% 12% 4% 16%
Unit Volume (no.) 591 568 23 597 (6)
ASP (ex rebuilds) ($A’000’s) 21.7 22.7 (1.0) 22.4 (0.7)
Service Revenue 2.0 2.8 (0.8) 3.2 (1.2)
• Extended lockdowns across New South Wales and other states within Australia resulted in decreased revenue compared to the pcp and
the prior half :
✓ Venues in NSW and VIC were closed from 1 July to mid October 2021.
✓ The Omicron wave has also affected business and consumer confidence, impacting customers’ capital expenditures.
✓ Drop in service revenue impacted by government restrictions and closures during the first quarter.
• ASP included corporate orders for 111 units sold, driving ASP down. Excluding this sale, ASP was consistent with pcp.
• Product performance of Cash Stacks Link in QLD has been approximately 1.5 of the house average and remains steady.
• Improvement in segment EBITDA of $3.8 million, compared to $2.1m EBITDA in the prior half and $3.3m in the pcp, driven by better
margin achieved through improved production recoveries in the current period.
AINSWORTH GAME TECHNOLOGY LIMITED 21Rest of the World
Current period Current period
H1 FY22 H1 FY21 vs H2 FY21 vs
In millions of AUD H1 FY21 H2 FY21
Revenue 7.2 7.1 0.1 6.6 0.6
Gross Profit 4.7 3.8 0.9 4.0 0.7
Segment EBITDA 4.1 3.5 0.6 3.6 0.5
Segment Profit 4.0 3.2 0.8 3.4 0.6
Segment Profit (%) 56% 45% 11% 52% 4%
Unit Volume (no.) 63 165 (102) 159 (96)
Online Revenue 3.7 3.0 0.7 2.9 0.8
• Increased revenue, EBITDA, and segment profit compared to pcp and the prior half.
• Continuous challenging times within the Asian region due to COVID-19/OMICRON and border
closures.
• New Zealand was in lockdown between August and December 2021 which had an impact on the
decreased number of units sold.
• Online revenue $3.7m contributed 51% of the segment’s revenue, an increase of 23% from the pcp
of $3.0m and 28% from the prior half of $2.9m.
AINSWORTH GAME TECHNOLOGY LIMITED 22LAND BASED GAMING PRODUCTS
Key Market Highlights
North America

•   HHR growth continues – 400 units sold to Kentucky Downs in the current period, installed base expected to
    increase in new and existing markets.

•   High-Denom continues to be a pinnacle – regularly 5 of the Top 25 games in industry performance charts.

•   A-STARTM Curve XL premium cabinet launched in North America.

•   MTD Acquisition: the company is now manufacturing games for Louisiana market.

•   Gambler’s GoldTM Multigame Keno/Poker game under field trial in Nevada.

Latin America

•   Demand continues to grow for the new A-STARTM cabinets.

•   Pan Chang, Fiesta Grande, Rio Grande Los Toritos and
    Multi Win games remain top-performing products.

Australasia

•   Strong installs backed by solid performance of Cash Stacks
    in multiple markets - in excess of 450 units.

                                              AINSWORTH GAME TECHNOLOGY LIMITED                                 24
H2 FY22
North America
• A-STARTM Slant Top cabinet slated to debut with focus on new and pre-existing High-Denom content.
• HHR Opportunities: Louisiana HHR market approved, New Hampshire progressing.
• NIGA Tradeshow scheduled for April with focus on A-STARTM Curve XL premium content.
• Planned release for key titles including Lucky StarsTM Link, new High-Denom concepts and additional key offerings for
XL cabinet.
Latin America
• Cash Stacks and Treasure SpiritsTM game series launch.
• Expanding opportunities for the A-STARTM Curve XL.
Australasia
• Planned launches of Treasure SpiritsTM and Ultra ShotTM brands
with 8 new titles.
• Additional new game releases in the Cash Stacks series.
AINSWORTH GAME TECHNOLOGY LIMITED 25ONLINE
B2B Real Money Gaming (RMG) USA

•   Ainsworth Interactive remote gaming server (RGS) is certified in all 3 of the major i-gaming states which
    include New Jersey, Michigan and Pennsylvania.

•   We have 88 games approved in New Jersey and 50 approved games in Michigan and Pennsylvania with all
    the major online casino operators.

•   Ainsworth has met the launch requirements for the US$30m exclusive digital distribution deal with Game
    Account Network (GAN) in the US market.
      •   We are on track to deliver 25 games on an annual basis.
      •   GAN began distributing Ainsworth content to new casino operators as part of the US distribution deal
          which included the Michigan launch of Churchill Downs Interactive.

                                            AINSWORTH GAME TECHNOLOGY LIMITED                                    27
B2B Real Money Gaming (RMG) Rest of the World & Social Casinos
• Aspire Global’s Pariplay Ltd, a leading aggregator and content provider, has
joined forces with Ainsworth to distribute its online content in Latin America.
• The new commercial partnership forms an important part of both Ainsworth
and Pariplay’s strategic growth plan for Latin America.
• Ainsworth Interactive launched with BetPlay into the Colombian online
gaming market.
• BetPlay is one of the leading sports betting and online slot providers in
Colombia. Ainsworth's slot content is now available to BetPlay’s player
database and further expanding our online presence into Latin America.
SOCIAL CASINO
• Ainsworth’s ongoing partnership with Zynga continues to strengthen with 6 new slot game titles being developed on an
annual basis and launched on the Hit It Rich Social Casino App.
AINSWORTH GAME TECHNOLOGY LIMITED 28OUTLOOK
Outlook / Conclusion

•   AGT enters the second half of FY22 with good momentum and expects to sustain profitability. Inherent
    uncertainties surrounding COVID-19 continue to present challenges, primarily relating to global supply chain
    shortages.

•   AGT expects to provide a market update later within H2 FY22 once these uncertainties are determined.

•   Trading conditions in both domestic and international markets are expected to progressively improve through
    calendar year 2022.

•   AGT’s North American business continues to make progress in both Class II and Class III markets. Opportunities
    are continually being pursued for existing and new HHR markets.

•   Despite more volatile market conditions in Latin America, the Group expects to remain profitable in this region in
    H2 FY22.

•   Domestic market is expected to recover as restrictions are progressively being lifted.

•   With its strong balance sheet and refreshed commitment to product innovation, AGT is well placed to deliver
    improved performance.

                                               AINSWORTH GAME TECHNOLOGY LIMITED                                         30
AINSWORTH
GAME TECHNOLOGY
10 Holker St, Newington NSW
www.agtslots.comYou can also read