Graphical evidence for the solar coronal structure during the Maunder minimum: comparative study of the total eclipse drawings in 1706 and 1715 ...
←
→
Page content transcription
If your browser does not render page correctly, please read the page content below
Graphical evidence for the solar coronal
structure during the Maunder minimum:
comparative study of the total eclipse
drawings in 1706 and 1715
Article

Published Version

Creative Commons: Attribution 4.0 (CC-BY)

Open Access

Hayakawa, H., Lockwood, M., Owens, M., Soma, M., P
Besser, B. and van Driel, L. (2021) Graphical evidence for the
solar coronal structure during the Maunder minimum:
comparative study of the total eclipse drawings in 1706 and
1715. Journal of Space Weather and Space Climate, 11. 1.
ISSN 2115-7251 doi: https://doi.org/10.1051/swsc/2020035
Available at http://centaur.reading.ac.uk/92706/

It is advisable to refer to the publisher’s version if you intend to cite from the
work. See Guidance on citing .
Published version at: http://dx.doi.org/10.1051/swsc/2020035
To link to this article DOI: http://dx.doi.org/10.1051/swsc/2020035

Publisher: EDP Sciences

All outputs in CentAUR are protected by Intellectual Property Rights law,
including copyright law. Copyright and IPR is retained by the creators or other
copyright holders. Terms and conditions for use of this material are defined in
the End User Agreement .

www.reading.ac.uk/centaur

CentAUR

Central Archive at the University of Reading
Reading’s research outputs online

J. Space Weather Space Clim. 2021, 11, 1
Ó H. Hayakawa et al., Published by EDP Sciences 2021
https://doi.org/10.1051/swsc/2020035
                                                                                                                                    Available online at:
                                                                                                                                   www.swsc-journal.org
Topical Issue - Space climate: The past and future of solar activity

    RESEARCH ARTICLE                                                                                                            OPEN          ACCESS

Graphical evidence for the solar coronal structure during
the Maunder minimum: comparative study of the total eclipse
drawings in 1706 and 1715
Hisashi Hayakawa1,2,3,4,*, Mike Lockwood5,*, Matthew J. Owens5, Mitsuru Sôma6,
Bruno P. Besser7, and Lidia van Driel – Gesztelyi8,9,10
1
  Institute for Space-Earth Environmental Research, Nagoya University, 4648601 Nagoya, Japan
2
  Institute for Advanced Researches, Nagoya University, 4648601 Nagoya, Japan
3
  Science and Technology Facilities Council, RAL Space, Rutherford Appleton Laboratory, Harwell Campus, OX11 0QX Didcot, UK
4
  Nishina Centre, Riken, 3510198 Wako, Japan
5
  Department of Meteorology, University of Reading, RG6 6BB Reading, UK
6
  National Astronomical Observatory of Japan, 1818588 Mitaka, Japan
7
  Space Research Institute, Austrian Academy of Sciences, 8042 Graz, Austria
8
  Mullard Space Science Laboratory, University College London, RH5 6NT Dorking, UK
9
  LESIA, Observatoire de Paris, Université PSL, CNRS, Sorbonne Université, Université Paris Diderot, Sorbonne Paris Cité,
  92195 Meudon, France
10
   Konkoly Observatory, Hungarian Academy of Sciences, 1121 Budapest, Hungary

             Received 18 October 2019 / Accepted 29 June 2020

             Abstract – We discuss the significant implications of three eye-witness drawings of the total solar eclipse
             on 1706 May 12 in comparison with two on 1715 May 3, for our understanding of space climate change.
             These events took place just after what has been termed the “deep Maunder Minimum” but fall within the
             “extended Maunder Minimum” being in an interval when the sunspot numbers start to recover. Maria Clara
             Eimmert’s image in 1706 is particularly important because she was both a highly accomplished astronom-
             ical observer and an excellent artist: it was thought lost and was only re-discovered in 2012. Being the
             earliest coronal drawings of observational value yet identified, these drawings corroborate verbal accounts
             a corona without significant streamers, seen at totality of this and another eclipse event in 1652 during the
             Maunder Minimum. The graphical evidence implies that the coronal solar magnetic field was not lost but
             significantly weakened and the lack of coronal structure means there was little discernable open flux (either
             polar or at lower latitudes) even during the recovery phase of the Maunder Minimum. These observations
             provide evidence for a different state of oscillation of the solar dynamo, and hence behaviour of the Sun, in
             comparison with that during normal solar cycle minima (when a streamer belt between two polar coronal
             holes is visible) or near normal sunspot maxima (when coronal structure is caused by coronal holes at all
             latitudes) even to observers without a telescope.

1 Introduction                                                                   Barnard et al., 2011; Upton & Hathaway, 2018). Thus, it is
                                                                                 important to investigate what actually happened during the pre-
    In addition to the regular Schwabe cycles of 11 years                       vious grand minima. Studies of cosmogenic radionuclides argu-
duration, solar activity has a longer-term and wider variability                 ably suggest that the last 400 years, an interval that includes
between the grand minima and grand maxima (Steinhilber                           both the Maunder Minimum and the recent grand maximum
et al., 2010; Hathaway, 2015; Usoskin, 2017). Some predictions                   (Lockwood et al., 2009) cover almost the full range of solar-
put non-zero probability (~10%) on the arrival of the next grand                 terrestrial activity levels (Usoskin, 2017). From understanding
minimum within one or two cycles (e.g., Abreu et al., 2008;                      solar conditions during the Maunder Minimum (hereafter,
                                                                                 MM), we can make deductions about solar-terrestrial effects,
*
 Corresponding authors: hisashi@nagoya-u.jp;                                     which will enable us to start to construct a climatology of space
hisashi.hayakawa@stfc.ac.uk;                                                     weather phenomena that covers all possible activity ranges (e.g.,
m.lockwood@reading.ac.uk                                                         Schröder, 1992; Silverman, 1992; Usoskin et al., 2007, 2015;

    This is an Open Access article distributed under the terms of the Creative Commons Attribution License (https://creativecommons.org/licenses/by/4.0),
                 which permits unrestricted use, distribution, and reproduction in any medium, provided the original work is properly cited.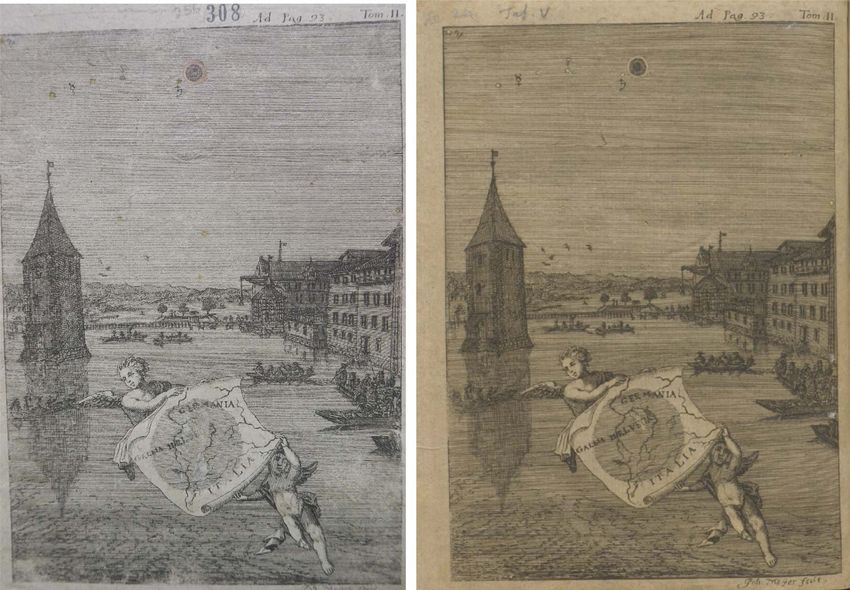
H. Hayakawa et al.: J. Space Weather Space Clim. 2021, 11, 1

Fig. 1. Eclipse images from solar cycles 14 and 24. Panels a, b, and c show images of eclipses at the end, maximum, and start of cycle 24 that
have been processed by Miloslav Druckmüller of Brno University of Technology and are reproduced here with his kind permission: a is
the eclipse of 2019 July 2 observed from Tres Cruses, Chile; b is the eclipse of 2013 November 3 observed from Pokwero, Uganda; and c is the
eclipse of 2009 July 22 observed from Enewetak Atoll, Marshall Islands. Further details of observers and equipment used are available from
http://www.zam.fme.vutbr.cz/~druck/eclipse/. Panels d, e, and f show images of eclipses at the end, maximum and start of cycle 14 that were
recorded onto photographic plates and then transcribed onto paper by William Henry Wesley and Miss A. Crommelin to enable reproduction. d is
the eclipse of 1914 August 21 observed from Minsk, Russian Empire; e is the eclipse of 1905 August 30 observed from Sfax, Tunisia; and f is the
eclipse of 1901 May 18 observed from Pamplemousses, Mauritius. Details of the observers and the equipment used are given in Dyson (1927).
The bottom three panels show variations of the (revised) International Sunspot Number (Clette & Lefèvre, 2016), the northern hemisphere aaH
index, aaHN, and the southern hemisphere aaH index, aaHS (Lockwood et al., 2018a, 2018b) in each panel the paler-coloured thin line shows
monthly mean values and the deeper-coloured thick line the annual means. The vertical lines mark the times of the eclipses shown.

Lockwood et al., 2017a, Isobe et al., 2019; Hayakawa et al.,             the normal cycle minima that have been detected since the end
2020b; 2018c). This could be used with probability estimates             of the MM (e.g., Eddy, 1976; Cliver & Ling, 2011; Riley et al.,
of future grand minima (Barnard et al., 2011) to aid the design          2015), partially on the basis of the coronal structure of the MM
of operational systems that will be needed in the future.                as an indicator. The solar corona becomes visible during the
    So far, there have been two clear minima within the cover-           total eclipses with mixture of structured K-corona as electron-
age of telescopic observations. Of these, the MM (ca., 1645–             scattered light and structureless F-corona as dust-scattered light.
1715) is considered a grand minimum, whereas the other min-              Due to their nature, structured K-corona is dependent on the
imum, i.e., the Dalton Minimum (ca., 1797–1827; hereafter                amplitude of solar activity unlike structureless F-corona. The
DM), is generally understood as a lesser, secular minimum                solar corona during total eclipses at solar cycle maxima
(Eddy, 1976; Usoskin et al., 2015; Usoskin, 2017; Hayakawa               becomes radial with numerous streamers, whereas that at solar
et al., 2020a). During these periods, the amplitude of the solar         cycle minima has symmetric extension of streamers only around
cycles was significantly suppressed and considerably fewer sun-           the solar equator, as illustrated by Figure 1.
spots had been reported, while solar cycles were still confirmed
(e.g., Owens et al., 2012; Usoskin et al., 2015; Vaquero et al.,
2015a; Muñoz-Jaramillo & Vaquero, 2019). The “extended”
                                                                         2 Background
MM has been split into three phases by Vaquero & Trigo
(2015): a “decay phase” (1618–1645), a “deep Minimum”                    2.1 Variations of coronal structure seen during
phase (1645–1700) and a “recovery phase” (1700–1723) and                     eclipses
we here investigate two total eclipses of the Sun during the
recovery phase.                                                              During eclipses around the sunspot minimum, solar streamer
    In this context, it has been discussed to what extent the Sun        belt(s) are seen at lower heliographic latitudes separated by dis-
kept its magnetic structure during the MM in comparison with             tinct dark polar coronal holes. The latitudinal width of those

                                                                Page 2 of 28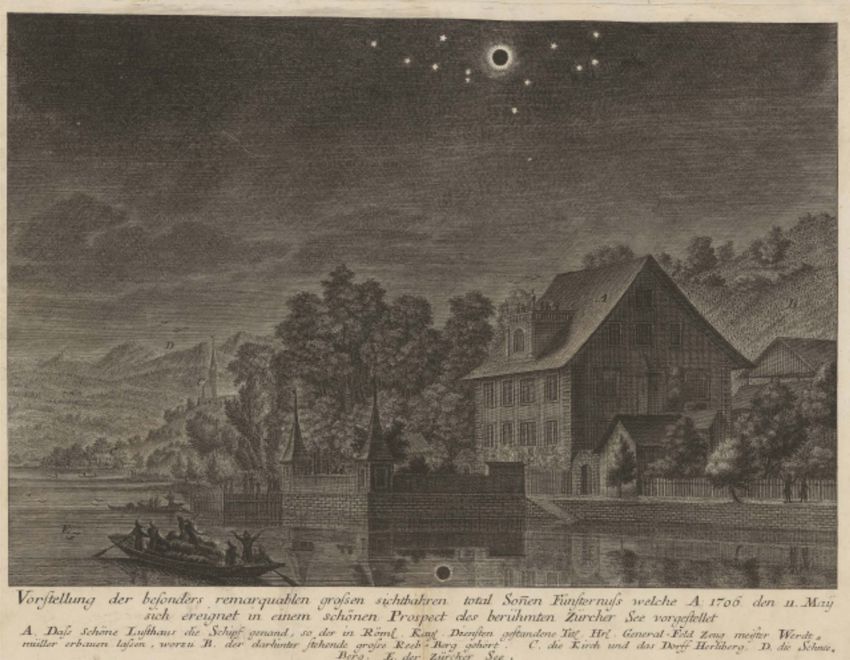
H. Hayakawa et al.: J. Space Weather Space Clim. 2021, 11, 1

eclipse streamers was shown by Owens et al. (2017) to vary with      which the aaH indices are lower. This reflects the basis for
the long-term variation in open solar flux, consistent with numer-    one of the precursor methods of prediction of solar-cycle ampli-
ical modelling based on sunspot numbers (Lockwood & Owens,           tude in Schatten et al. (1978), as greater streamer widths at cycle
2014). On the other hand, at sunspot maximum, streamer belts         minima are considered to reflect weaker polar fields that imply
and a structured K-corona are seen at all latitudes (Koutchmy        weaker toroidal (sunspot) fields for the following maximum.
et al., 1974; Loucif & Koutchmy, 1989; Pasachoff, 2017).             Both solar polar field strength and geomagnetic activity at solar
     Figure 1 contrasts eclipses seen during two relatively weak     minimum have been shown to be useful indicators of the ampli-
sunspot cycles more than a century apart. Cycle 24 is the most       tude of the subsequent cycle (Svalgaard et al., 2005; Petrovay,
recent cycle and is similar in many ways to Cycle 14 at the start    2010; Schatten & Pesnell, 2012; Cameron et al., 2013, 2014;
of the twentieth century. Images a, b, and c were recorded close     Muñoz-Jaramillo et al., 2013). However, it must be noted that
to the minimum at the end, the maximum and the minimum at            this cannot be the only mechanism: if it were, upward or down-
the start of Cycle 24. These are images from various eclipse         ward trends in solar activity would never reverse in direction
campaigns after application of the superb image processing           and although we do see intervals when several successive cycles
techniques of Miloslav Druckmüller of Brno University of             show the same trend, we also see reversals in those trends
Technology (Druckmüller et al., 2006). Images f, e, and d were,      associated with the unexpected polarity of magnetic flux emerg-
correspondingly, recorded close to the minimum at the start, the     ing in a given solar hemisphere (Cameron et al., 2013, 2014;
maximum and the minimum at the end of Cycle 14, again                Lockwood et al., 2017b). The consistency between the varia-
during various observing campaigns (Dyson, 1927).                    tions of sunspot cycles and of open solar flux throughout the
     The Cycle 14 images have also been subject to a form of         interval was shown by Owens et al. (2017) and was demon-
image processing in that they were recorded photographically         strated in the modeling of Lockwood & Owens (2014). This
but then copied as drawings to enable reproduction. William          means that there is information in eclipse observations that
Henry Wesley and Miss Crommelin carried out this copying             can help reconstructing and understanding terrestrial space
(Dyson, 1927, p. 363). Wesley was, as an engraver, artist,           climate in the past, and this is a major motivating factor for
astronomer, and assistant secretary to the Royal Astronomical        the current article.
Society, present at some of the eclipses and reproduced the pho-         A feature to note about all the images in Figure 1, for both
tographic plates with great attention to detail. Combining short-    sunspot minimum and sunspot maximum, is that structure is
exposure photographs for inner corona and longer-exposure            seen only because there is a mix of dark coronal hole magnetic
photographs for outer corona at least in his early career (see       flux (on which is frozen-in plasma of lower density that there-
e.g., Pang, 2002, p. 115), his “image processing” should have        fore scatters less light) and bright streamer magnetic flux (on
involved more subjective choices than the modern computerised        which is frozen-in plasma of higher density that therefore
processing used for the Cycle 24 images: nevertheless there are      scatters more light). This contrast in the scattered light intensi-
similarities as all image processing involves subjective decision    ties is vital to observing streamers. At sunspot minimum the
as to which features to enhance and emphasize. Comparison of         open flux is gathered into polar coronal holes but there is more
the upper and lower images in Figure 1 underlines how consis-        open flux, distributed at all solar latitudes especially at  1 where

                                                             Page 3 of 28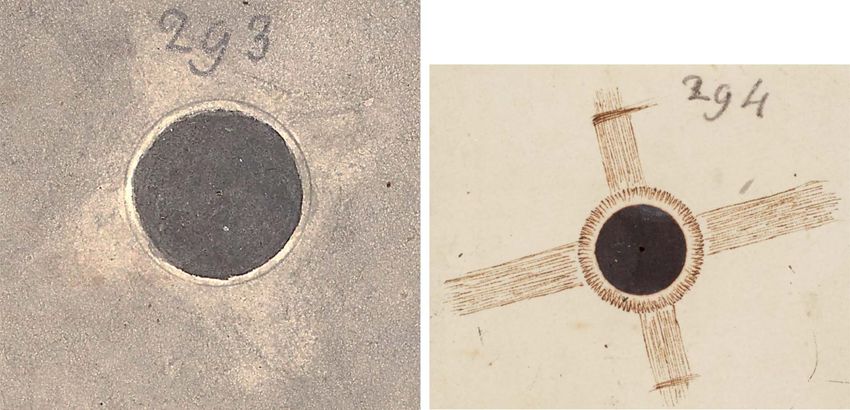
H. Hayakawa et al.: J. Space Weather Space Clim. 2021, 11, 1

Fig. 2. Comparison of streamer belt extremal latitudes (at heliographic latitudes KH = KSB, where in each hemisphere the average value for east
and west limbs is used) from eclipse images (pale blue dots), magnetograph observations (colour pixels) and modelling (blue line) based on
sunspot numbers and flux continuity equations (Lockwood & Owens, 2014). The colored pixels give the annual means of the occurrence
frequency (in %) of streamers (PDS and PSS are the occurrence probabilities of dipolar streamers and pseudostreamers, respectively) from
Potential Field Source Surface modeling of the corona based on magnetograms recorded the Wilcox Solar Observatory as a function of sin(KH)
and time.

dSPH is the separation of a pair of field lines in the photosphere        1715 May 3. While Eddy (1976) mentions two more eclipses
and dSSS is their separation at the coronal source surface               in 1698 and 1708 with coronal descriptions, we could not locate
(Owens et al., 2013, 2014).                                              them in our investigations, partially because their totality passed
    In making this comparison, it must be remembered that the            little-populated area at that time: Nicaragua and Costa Rica for
eclipse observations are recorded over a short interval of time          the 1698 eclipse and Lapland and Siberia for the 1708 eclipse
(a few minutes): however, because the observer sees integrated           (see Supplementary Data B). Given factors such as cloud cover
light scattered by the corona along a line of sight, the streamer        and the limited numbers of observers with the ability and
belt imaged is broader than that at just the Carrington longitude        inclination to objectively record all of what they saw (and the
of the solar limb. In addition, by averaging the east and west           relative unlikely nature that those who did have the necessary
limbs, we are studying extended regions about two Carrington             skills could or would travel to make observations based on
longitudes 180-degrees apart. With this caveat in mind, the              predicted occurrence), the small number of detailed reports is
agreement between the eclipse values and the streamer belt               not surprising. Many of the reports that were made for the
edges defined from the magnetogram data is exceptionally                  observed eclipses concentrated on timing rather than appearance
good. Furthermore, the agreement with the streamer belt width            and often even the descriptive ones are worded in imprecise
modelling of Lockwood & Owens (2014) is exceptionally good,              language, drawing heavily on analogies (see Fig. 4).
as indeed it is over the last 300 years since the MM (Owens                   There is, however, at least one eclipse report with further
et al., 2017). As stressed in the last section, it must be remem-        details such as the account of Wing (1656) on the total eclipse
bered that, whichever method is used to view it (through                 on 1652 April 8 when totality passed over Ireland,
darkened glass, projection of a telescope image onto a screen,           Pembrokeshire in Wales, the Lake District in England, Scotland
photographic plates, or modern CCD technology), that structure           and Northern Norway: a day which became known as “Mirk
in the corona seen in eclipses is detected because of the dark           Monday” (an old-fashioned spelling of “Murk Monday”; see
regions between the bright streamers, i.e., the coronal holes.           e.g., Wright, 1970, p. 122). Wybard observed this eclipse from
Lockwood & Owens (2014) have modelled how the width of                   Carrigfergus in Ulster (N. Ireland; N54°430 , W005°480 ) with “a
the streamer belt at low sunspot activity would increase with            corona of light around the Moon, arising from some unknown
decreased open solar flux.                                                cause” and stated “it had a uniform breadth of half a digit, or
                                                                         a third of a digit at least, that it emitted a bright and radiating
2.3 Eclipse observations during the Maunder Minimum                      light, and that it appeared concentric with the Sun and moon
                                                                         when the two bodies were in conjunction” (Wing, 1656,
    However, during the MM, eclipse reports of the solar corona          pp. 98–99; Grant, 1852, p. 378; Riley et al., 2015, p. 4).
are rare (see Eddy, 1976). During the MM (1645–1715), there                   Wybard’s description contains the key element that we here
were 41 total solar eclipses and 22 hybrid eclipses worldwide            consider in other eclipse observations near the end of the MM
(see Supplementary Data B). Note that hybrid eclipses change             (in the MM “recovery” phase). That key characteristic is radi-
from annular to total as one moves along the eclipse path.               ated light in a concentric ring, with no mention of gaps that
Among them, only 8 occurred in the European sector with                  would indicate polar coronal holes, or any discussion of a radial
totality (Fig. 3). Contemporary European scientists documented           band of light on both sides of the eclipsed Sun, that would be a
at least 3 of them: those on 1652 April 8, 1706 May 12, and              description of a streamer belt. As one digit corresponds to

                                                                Page 4 of 28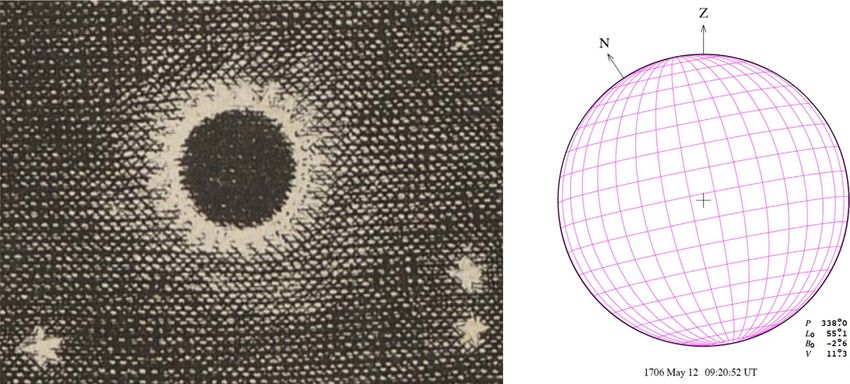
H. Hayakawa et al.: J. Space Weather Space Clim. 2021, 11, 1

Fig. 3. Path of totality in the European sector during the total and hybrid eclipses (see Supplementary Data B). Among these eclipses, three of
them (1652 April 8, 1706 May 12, and 1715 May 3) have relatively wider path of totality and go through well-populated areas.

twelfth part of solar/lunar diameter (e.g., Davidson, 1903,              An interesting historical fact about the eclipse of 1706 May
p. 258; see also Stephenson & Said, 1991), his report shows that         12 is that it took place just 11 days before the Battle of
the corona at least extended 1/12 or 1/18 of the lunar radius            Ramillies, a turning point of the War of the Spanish Succession
from the lunar limb.                                                     when Dutch, English, and Danish forces overwhelmed the
    This year, 1652, is arguably located in the beginning of             Franco-Spanish-Bavarian army. The eclipse took place slightly
“deep minimum” phase of the Maunder minimum (Vaquero                     after that the French forces were driven to lift their siege and
& Trigo, 2015; c.f., Svalgaard & Schatten, 2016). From 1646              naval blockade of Barcelona and the path of totality passed over
onward, not a single sunspot group having been reported for              the besieged city. The symbolism in relation to the eclipsing of
1646–1651 inclusive; however, this period was admittedly                 the power of the French king, Louis XIV, commonly called the
poorly covered with contemporary observations (Vaquero                   “the Sun king (Le Roi Soleil)”, was recognized immediately
et al., 2016; Arlt & Vaquero, 2020). The only reports of sun-            and the liberated city and the winning allied armies issued a
spots in the year 1652 were by Hevelius and Petitus. Both                commemorative medal depicting an eclipse.
Hevelius and Petitus confirmed the Sun was spotless on the date               Satirists were not slow to use the eclipse to mock the French
of this eclipse. Even before that, the Sun was not so active.            king. Two of several examples are presented in Figure 4. These
Hevelius reported about 2 sunspot groups just 7 days before this         drawings are from Holland and England (two nations that were
eclipse, 1 sunspot group 5 days before, but recorded the Sun as          part of the alliance against France and so had cause to mock the
spotless on April 6–7, just before this eclipse (Vaquero & Trigo,        French king) and show a uniform bright ring close to the moon
2014; Vaquero et al., 2016; Arlt & Vaquero, 2020). Hence,                and radiations of solar rays around this ring. Such simple radial
Wybard’s account is in direct contradiction of the idea that             lines were typically used for the sunshine at the time (see e.g.,
the MM was an extended period when the Sun was in a state                Fürstlich Waldecksche Hofbibliothek, Arolsen, II 230 7, 1/2, v.
similar to that during the minima between modern sunspot                 18, ff. 35–37). On the other hand, the inner uniform halo is sus-
cycles.                                                                  pected as a solar corona. Other such satirical drawings show the
    The other two eclipse events, on 1706 May 12 and 1715                same halo around the Sun without significant streamers (see
May 3, were also recorded in detail, partially because their total-      Anonymous, 1707). Nevertheless, we surmise these drawings
ity favourably passed over a well-populated area in Europe.              were probably based not on actual observations but on hearsay,

                                                                Page 5 of 28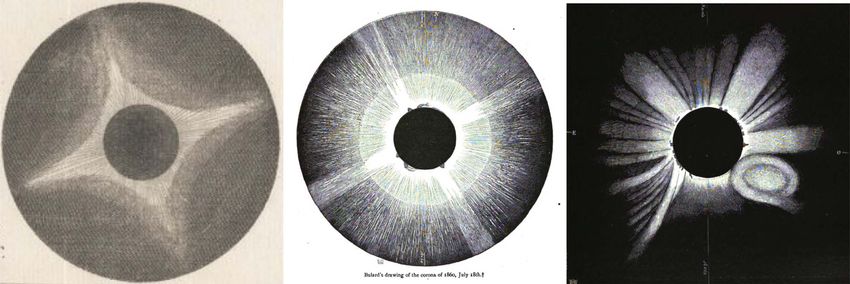
H. Hayakawa et al.: J. Space Weather Space Clim. 2021, 11, 1
Fig. 4. Satirical etching prints of the “Sun King” Louis XIV being terrified by the eclipse of 1706 May 12 near the turning point of the War of
the Spanish Succession. The left image is a British satirical print often called “Conference Between Louis XIV, Madame de Maintenon, and
Philip V of Spain” in Anonymous (1707, p. 442). This image is reproduced from BM Satire 1450, with courtesy of the Trustees of the British
Museum. The right image shows a Dutch satirical print in Arolsen Klebebände (Fürstlich Waldecksche Hofbibliothek, Arolsen, II 230 7, 1/2, v.
18, f. 107), provided with courtesy of Fürstlich Waldecksche Hofbibliothek (Arolsen) and Universitätsbibliothek Heidelberg.
as there is no known evidence that any of the artists actually apparent time (LAT), the Sun was actually in the east-south-
observed this eclipse, these satirical prints were published eastern sky (21.3° in azimuth measured southward from east
outside of the eclipse totality path (see Sect. 3.1) without clear and 48.1° in altitude). This means the eclipsed Sun was seen
indication of direct observations, and these prints often share on the seaside and the depicted visibility of the eclipsed Sun
similar solar and cloud structure despite their variation in origin and the besieged city of Barcelona in the same direction from
(see Fig. 4). the Franco-Spanish fleet was impossible. Furthermore, the
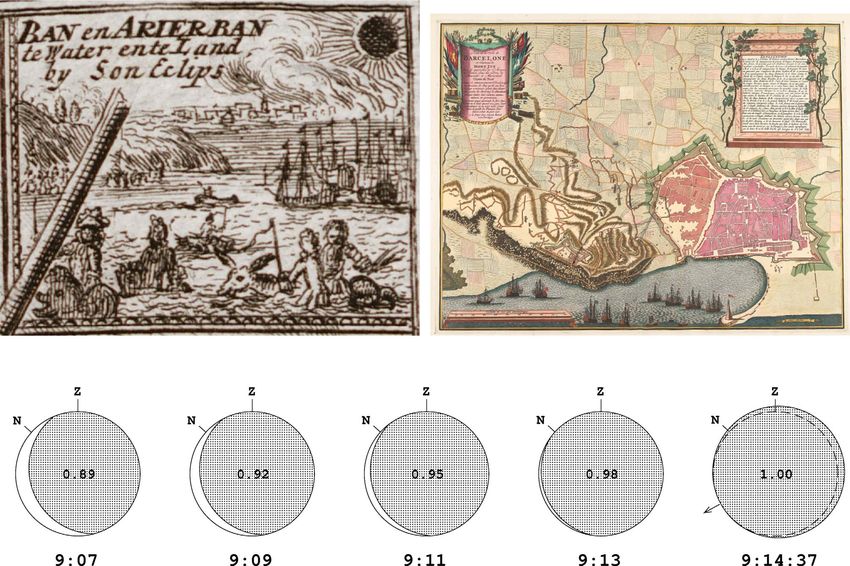
This is especially clear for the Dutch satirical print from depicted eclipse image shows the Sun was not totally hidden
Arolsen Klebebände (see Fig. 5a for its enlargement), which but its left side of 180° was visible. Taking this as a face
shows the eclipsed sun with the besieged city of Barcelona, value, this image rather looks an eclipse phase slightly before
and the French fleet. Firstly, the siege of Barcelona actually the totality around 09:11 LAT (= 08:58 UT) with its eclipse
ended in late April (e.g., Smithsonian Institution, 2016, magnitude = 0.95. With this magnitude, it was too bright to
p. 108), namely before this eclipse. Therefore, it is unrealistic see the darkened moon as depicted in Figure 5a and the visible
to see the Franco-Spanish fleet in front of Barcelona at the time part was much smaller than depicted (180°). Therefore, it is
of the eclipse (1706 May 12), as the siege was already over. most plausible that this Dutch satirical drawing was highly
Moreover, even if neglecting this chronological issue, the stylised rather than realistic and hence probably based on
eclipsed Sun is depicted the orientation of the city and the hearsay or imagination. In this regard, we need to evaluate
eclipse is incorrect. This image (see Fig. 5a) shows the eclipsed eclipse images with great philological care and ensure that
Sun, the besieged city of Barcelona, and the French fleet from images were made on the basis of the first-hand observations
the back to the front. In comparison with Pieter van Call’s illus- (see also Hayakawa et al., 2017, 2018; Uchikawa et al., 2020).
trated map of siege of Barcelona, the Franco-Spanish fleet is Similarly, some coins and medals commemorated this
placed in the eastern sea against the old city of Barcelona and event, while they do not agree very well with one another
the Fort of “Mont Iuy” (modern Montjuïc) in the west. Accord- (Negelein, 1711), suggesting they are likely stereotypical repre-
ingly, if this Dutch satirical print (Fig. 5a) were correct, the sentations and not likely actual depictions of the event. Here
eclipsed Sun would have been placed in the western to northern again, these images are unlikely to have been fashioned by indi-
sky against the fleet in the eastern sea. However, as the eclipse viduals who actually observed the event first-hand. The problem
took place at Barcelona (N41°230 , E2°110 ) at 09:17 in local with such images is that the artist will depict what he or she
Page 6 of 28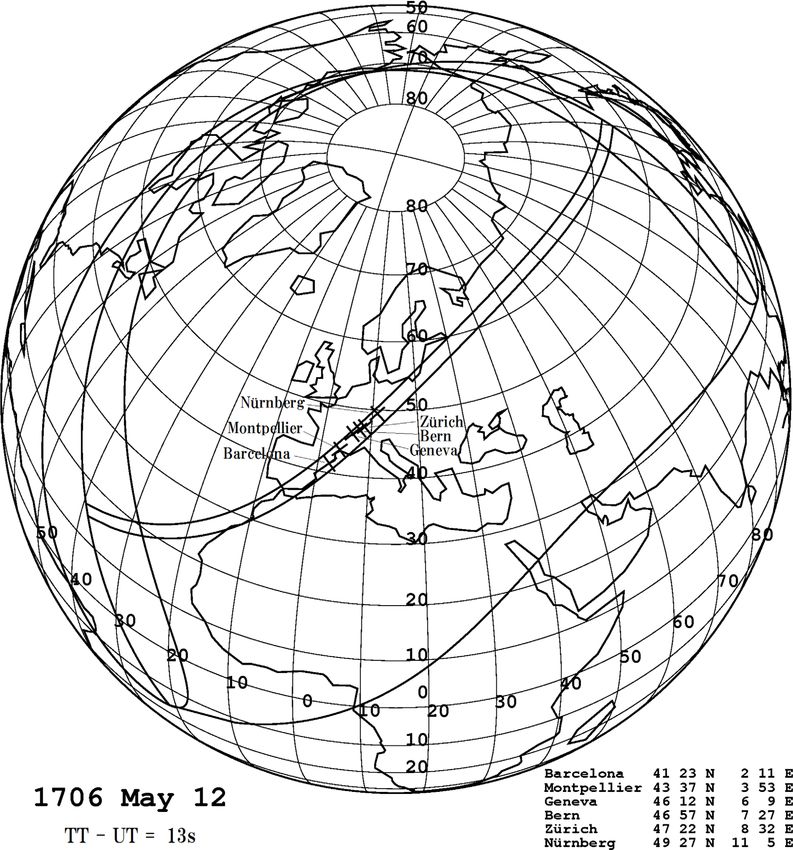
H. Hayakawa et al.: J. Space Weather Space Clim. 2021, 11, 1

Fig. 5. Close-up eclipse drawing in the Dutch satirical print in Arolsen Klebebände (Fürstlich Waldecksche Hofbibliothek, Arolsen, II 230 7,
1/2, v. 18, f. 107), provided with courtesy of Fürstlich Waldecksche Hofbibliothek (Arolsen) and Universitätsbibliothek Heidelberg in the
upper left; Pieter van Call’s illustrated map of siege of Barcelona in the upper right, where the Franco-Spanish fleet is placed in the eastern
sea against the old city of Barcelona and the Fort of “Mont Iuy” (modern Montjuïc) in the west, provided with courtesy of Rijksmuseum
(RP-P-OB-83.229); and the computed time series of the eclipsed Sun at Barcelona with its magnitude variation in the lower part. The timing is
shown in the LAT and the direction of Z and N show directions of the apparent zenith and the celestial north pole.

believes an eclipse should look like. Further than that, it is quite     The astronomical observer will have devoted all this time
likely that even artists who did observe the eclipse will have           making an assessment of the Sun, Moon and the immediately
recorded what their patrons and customers would expect to                surrounding sky. The landscape artist needs to also assess
see rather than made a realistic record.                                 how the light changed and affected features and figures that
     The important lesson that we take from these satirical draw-        he/she is depicting – this makes the latter much less likely to
ings and commemorative coins made by artists and craftsper-              make an accurate assessment of the event itself. This discussion
sons, who in most cases never actually saw the eclipse (such             shows why knowing the provenance of the image essential – so
as the Dutch and English satirists), is that their aim was to show       that we know who made it, what the artist’s motivation was and
something that people would recognize was the Sun, not make              how skilled an observer he or she was.
an accurate depiction of the event itself. Depictions of the Sun,            To date, however, the published observations for the 1652
with or without an eclipsing moon, traditionally show radially           and 1706 eclipses in the scientific literature were all descriptive
streaming beams of light as a way of telling the viewer that             in nature. The earliest known coronal drawings according to
the object drawn is the Sun (rather than the moon), not because          Eddy are those communicated by Cotes to Newton for the
it is a realistic depiction. Hence someone striking a commemo-           1715 eclipse (Eddy, 1976; Riley et al., 2015; Owens et al.,
rative coin, or mass-producing a print for sale (Lüsebrink &             2017). Hence research into the MM corona has been limited
Reichart, 1996) depicting the eclipse over their city, or a making       by ambiguities in interpretation and potential omissions of
landscape painting for sale – all such individuals will need to          coronal structure (see Eddy, 1976; Stephenson, 1998). For this
signal to the viewer/customer that he/she is depicting the Sun           reason, graphical records of solar corona at that time with
and radial structure all around the disk is the standard way this        known provenance and from reliable observers would be of
is done. The only people free from this stylized representation          significant importance to constrain and reconstruct the coronal
would be scientifically motivated astronomers making objective            structure during the MM and compare with the written descrip-
assessments of what they saw. There is a further point here,             tions. In this study, we show three eclipse drawings on 1706
totality in the 1706 eclipse, for example, lasted 4 min 10 s.            May 12 in the late MM, compare them with two eclipse

                                                                Page 7 of 28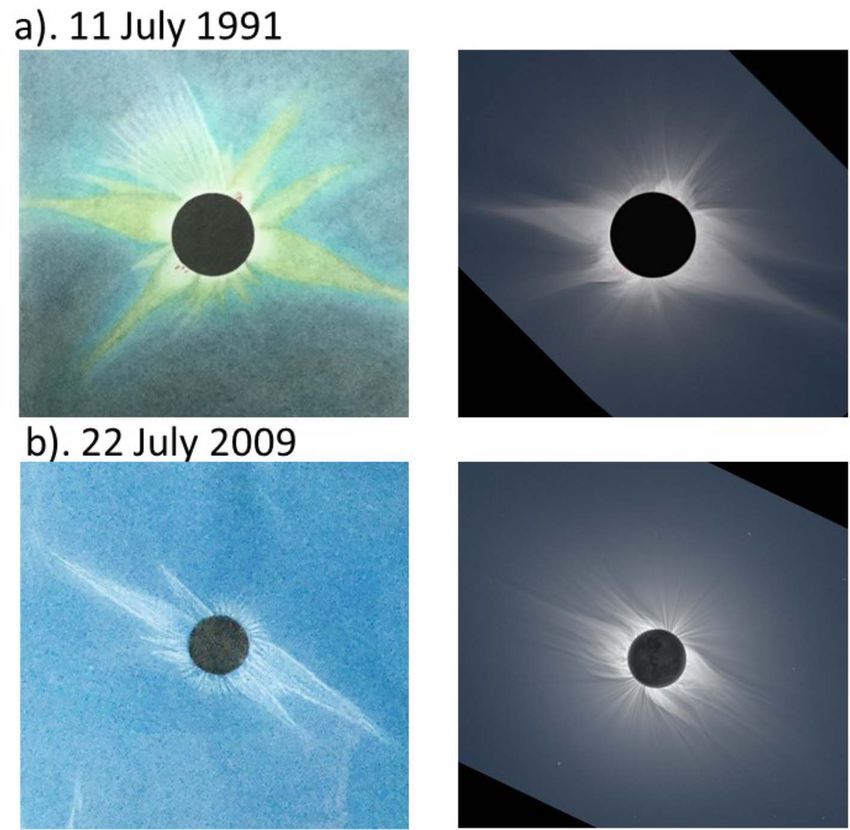
H. Hayakawa et al.: J. Space Weather Space Clim. 2021, 11, 1

Fig. 6. The eclipse totality path on 1706 May 12, as well as the main observational sites. We set the DT, difference of terrestrial time and
universal time, as 13 s according to Stephenson et al. (2016).

drawings on 1715 May 3 re-examined from the original                    Venus, and Mercury (CUL.MS.RGO 1/69 f.256; Scheuchzer,
manuscript, and carry out case studies for the coronal structure        1707). This drawing was Johann Meyer’s “copper etching
on their basis.                                                         where the great solar eclipse is presented how it was seen in
                                                                        place in Zürich at the cost of 2 schilling” (Scheuchzer, 1707,
                                                                        p. 96). At least, Scheuchzer and Stannyan bought or obtained
                                                                        copies. Scheuchzer incorporated this drawing as an illustration
3 Observations                                                          for his journal. Here in Figure 7, the solar corona is depicted
3.1 Eclipse observations on 1706 May 12                                 without significant streamers. The apparent irregular extensions
                                                                        around the corona in Figure 7 are most probably a byproduct of
    The total eclipse on 1706 May 12 started its path of totality       bleed after copper printing, as they extend into different direc-
in Iberia, passed through Central Europe, and ended in Siberia          tions in the two different prints despite their shared origin from
(Fig. 6). This eclipse was therefore witnessed widely in Iberia,        the same copper-etching.
France, Central Europe, and Russia. Among the observations in                Captain Stannyan, a British naval captain on holiday in
the path of totality, we have located three kinds of contemporary       Switzerland, also sent this drawing to Mrs. Flamsteed, as an
drawings for this solar eclipse.                                        attachment of his correspondence (CUL.MS.RGO 1/37,
    Figure 7 shows Johann Meyer’s drawings for this solar               ff. 114–115; Forbes et al., 2001). Captain Stannyan himself also
eclipse observed in Zürich (N47°220 , E8°320 ) with Saturn,             witnessed this total eclipse at Bern (N46°570 , E7°270 ) and

                                                               Page 8 of 28
H. Hayakawa et al.: J. Space Weather Space Clim. 2021, 11, 1
Fig. 7. Johann Meyer’s drawings for the total eclipse on 1706 May 12 in Zürich, Switzerland, adopted from CUL.MS.RGO 1/69 (f. 256;
Photograph by Hisashi Hayakawa, reproduced by permission of Syndics of ÓCambridge University Library) and Beschreibung der
Natur-Geschichten des Schweizerlands (Scheuchzer, 1707).
reported “a Blood red streak of Light, from its Left Limb; which two images of the eclipse were thought lost until Markus Heinz
continued not longer than 6 or 7 Seconds of Time” at the end of of the Staatsbibliothek zu Berlin rediscovered them in 2012 (e.
eclipse to Flamsteed (1706, p. 2240). This description is consis- g., Gaab, 2016). Another copy of the drawings was donated to
tent with solar spicules or a prominence and strongly suggests the Nürnberg City Library, but was subsequently lost. Hence,
surviving solar magnetic field in the chromosphere and hence they were not known to previous authors discussing the MM
also in the photosphere (see Foukal & Eddy, 2007). eclipses, in particular Jack Eddy.
Figure 8 shows Johann Melchior Füssly’s eclipse drawing at Here, Eimmart depicted a yellow circle and pale blue halo
Herliberg near Zürich with a cottage called “the Schipf”, while around the eclipsed solar disk in both panels and provided the
its date “1706 May 11” should be corrected “1706 May 12”, as relative positions of Saturn and Venus. The pale halo is consid-
calculated in Figure 6. This cottage has been located and is ered as a dim solar corona without discernible structure. Extents
situated at Herliberg (N47°180 , E8°360 ), on the eastern coast of the yellow inner ring and pale blue outer halo are measured
of the Zürich Lake, roughly 10 km southward from Zürich. 0.08 and 0.36 times of radius of the black sphere (= the Moon).
Given the relative location with the Herliberg Church, this At the time of the 1706 eclipse, orbital dynamics as computed
drawing seems a side-inverted etching, the reason for the inver- using JPL DE430 predict the Sun and the Moon to be at
sion being unknown. Caveats must be noted in its stylized star 1.0113796 au and 0.0023830 au away from Nürnberg. Accord-
shapes in this drawing and locations that do not agree with the ingly, the apparent angular solar radius R and the apparent
locations of any stars or planets at the time. Here as well, the angular lunar radius are computed 150 4900 and 160 4600 , respec-
eclipse is shown without significant streamers but possibly with tively. As such, the lunar radius was 1.06 times as large as
an asymmetric faint outskirt (see text and Fig. 11). the solar radius. Therefore, the extents of yellowish inner ring
Figure 9 shows Maria Clara Eimmart’s two drawings for and the pale blue halo from the solar limb are computed
this solar eclipse observed at Nürnberg (Nuremberg in English, 0.14R and 0.38R.
Norimberga in Latin) at 10 h 14 m (MS SBB Kart A2398). The We know that viewing conditions for this eclipse were good
observational site was the Eimmart Observatory at Vestnertor in Nürnberg because it was also observed and recorded by the
Bastion of Nürnberg Castle (N49°270 , E11°050 ), where Georg famous astronomer Johann Philipp Wurzelbau from the same
Christoph Eimmart, his daughter and her husband, Johann city (Wurzelbau, 1706; see Fig. 10). Wurzelbau (also known
Heinrich Müller, conducted regular observations from 1678 to as Wurzelbauer) describes the excellent conditions allowing
1710 (Gaab, 2005, 2010; Hockey et al., 2014, p. 647). These “unprecedented observations”. He also describes a thin ring of
Page 9 of 28H. Hayakawa et al.: J. Space Weather Space Clim. 2021, 11, 1
Fig. 8. Johann Melchior Füssly’s drawing for the total eclipse on 1706 May 12 at Herliberg near Zürich (Füssly, 1724).
light around the moon seen by casting a shadow onto white the event at the Nürnberg observatory, including Johann Gabriel
paper (Fig. 10). Here, he states “the same appearance was then Doppelmayr, a resident of the city who generated a map of the
observed by holding an opaque globe to the Sun, so as to cover path of totality on which is logged observations of the event that
its whole body from the eye for, looking at is through smoked he collated (van Gent, 2005). Recorded correspondences
glass in order to prevent the eye from being hurt by the glare of between these astronomers specifically praise Eimmart’s paint-
light it would otherwise be exposed to, the globe appeared with ing as capturing what they too had observed (Gaab, 2003).
a light resembling that around the moon in the total eclipse of Hence there are many eye-witness accounts that are consistent
the Sun” (see Dobson, 1798, p. 460; see also Happel, 1707, with the Eimmart depiction for the reported absence of signifi-
pp. 388–389). Wurzelbau’s comparison is driven by the idea cant streamers. Wurzelbau also draws a sequence of images
of the solar corona being due to a hypothesized lunar atmo- from first to last contact that show a very thin band of light
sphere, a common misconception at that time (see Flamsteed, around the moon at totality. Unlike Eimmart’s unstructured ring,
1706, p. 2241). The Wurzelbau description and the Eimmart Wurzelbau draws this ring in a series of fine radial lines – our
paintings consistently show absence of significant streamers, modern interpretation of this could be magnetic field threading
as do the qualitative descriptions by Scheuchzer in Zurich, the chromosphere and lowest corona but it could equally be
Stannyan in Berne, Clapiès and de Plantade in Montpellier, streaks caused by lunar surface structure. However, unlike
and Fatio de Duillier in Geneva, Cassini (Marly, France), Father Eimmart, Wurzelbau records no coronal glow beyond this ring
Laval (Marseille), François Xavier Bon (St. Hilaire), Count at all and his radial lines extend to a twelfth of a lunar diameter,
Luigi Marsigli (Tarascon), Jean Mathieu de Chazelles as his main purpose was to describe eclipse magnitude in each
(Montpellier) and Johann Heinrich Müller (then in Nürnberg). phase.
Cassini (1706) also reported similar observations from With these illustrations (see their summary in Fig. 11), the
Languedoc, Provence, Narbonne, Montpellier, Arles, Tarascon, available text descriptions of the same eclipse become easier
Marseille, Avignon, Geneva and Zurich (without naming the to interpret with confidence. The French mathematician and
observers). We note that other astronomers gathered to watch cartographer Jean de Clapiès (1670–1740) and the astronomer
Page 10 of 28H. Hayakawa et al.: J. Space Weather Space Clim. 2021, 11, 1
Fig. 9. Maria Clara Eimmart’s two drawings for the total eclipse on 1706 May 12 made in Nürnberg (Nuremberg), adopted from MS SBB Kart
A2398; Courtesy of ÓStaatsbibliothek zu Berlin, Kartenabteilung.
François de Plantade made observations of the 1706 total solar the moon and encompass all sides equally” (Duillier, 1706,
eclipse from Montpellier’s Babote Tower and wrote. “As soon p. 2142). This whiteness he estimated to be a twelfth of a lunar
as the Sun was wholly eclipsed, the moon appeared to be diameter in width is 2.8 min from the lunar limb and so very
surrounded by a very white light forming round the disk of that close to the estimate by Clapiès and de Plantade. Beyond that
planet a halo 3 min in width, within this limit the light was the he defined a white halo of even colour of diameter of 4° or
same throughout gradually failing and at length dissipating 5° (radius of 7.6 R to 9.5 R), which is, similar to but smaller
itself in darkness, forming an annulus around the moon of about than the estimate by Clapiès and de Plantade. The reports are
8° diameter” (de Plantade, 1706, p. 8; see Arago, 1843, p. 210). communicated by Jean Christophe Fatio, who correctly
The bright halo 3 min wide appears to match the bright yellow concluded for the extent of the brightness meant that it must
circle in Eimmart’s drawing and the gradually fading outer come from the Sun and not a hypothesized lunar atmosphere.
region to match with the structurless and gradually fading blue Note that beyond about 2.5 R, depending on conditions
band in Eimmart’s drawing. At the time of the 1706 eclipse, orbi- (see discussion below), the intensity of the F-corona (due to
tal dynamics as computed using JPL DE430, predict the Sun and dust) exceeds that of the K-corona (due to electrons) (e.g.,
the Moon to be at 1.0113778 au and 0.0023842 au away from Fig. 1 of Reginald et al., 2017). As the lights seen at larger
Montpellier. Accordingly, the apparent angular solar radius R extents reported do not show streamers, they are almost
and the apparent angular lunar radius are computed 150 4900 and certainly due to the F-corona and not the K-corona. Without
160 4500 , respectively. Therefore, taking the difference of the polarization separation, that lets coronagraphs see K-corona to
apparent angular radii of the Sun and Moon, the ring visibility greater distances, the human eyes see whichever is brighter.
of 30 from the eclipsed Sun corresponds to 0.25R whereas This makes the specific statement from Clapiès and de Plantade
the 8° diameter of the halo corresponds to a radius of 15.2 R. that the only structure was a gradual decrease in intensity with
Jean-Christophe Fatio de Duillier observed the eclipse in radial distance away from the moon interesting as it implies the
Geneva and in a letter to his brother talked of at totality there K-corona was less bright than the F-corona at all radial
being “a whiteness which did seem to break out, from behind distances. We cannot exclude the possibility that they saw
Page 11 of 28H. Hayakawa et al.: J. Space Weather Space Clim. 2021, 11, 1
Fig. 10. Wurzelbau’s drawings to show time series of the eclipse magnitude (Wurzelbau, 1706, p. 14), shown above. Unlike other images,
these images are specialised to the magnitude of eclipse and only brightest part of its corona is described, obscuring and reflecting the solar
disk; the calculated corresponding eclipse phases with LAT are shown below.
K-corona close to the Sun and F-corona further out but we note be 0.53R. Hence Eimmart did not detect the faint main corona
that they did not record any discontinuity in intensity or colour to as far out as did Clapiès, de Plantade or Duillier. But she also
that would mark a boundary between the two. A pure F-corona did not detect any structure at all in that halo, which is consistent
would be consistent with the lack of structure in the corona that with the specific written statements of all three of those obser-
they reported. However, the light closer to the lunar limb could vers that the halo was uniform and all around the Sun. Hence
also be a K corona provided that little open flux were present the best astronomical reports of the 1706 eclipse all specifically
(given that open flux in coronal holes generates a streamer belt refer to a uniform corona all around the Sun (as had Wybard in
at sunspot minimum and allows us to see structure in the corona his description of the 1652 event seen from Carrigfergus in
at all latitudes at sunspot maximum). Ireland). Eimmart’s is the only one of these astronomers to
Eimmart does not quantify any extents but we can estimate record it graphically.
them from her painting given that the orbital dynamics predict Giovanni Domenico Cassini observed the eclipse from
that the moon was at a distance of 0.0023830 au at her obser- Marly (France) where the eclipse was only partial but collected
vation place at that time, giving a mean angular lunar diameter and summarized reports, saying that “in the cities of Languedoc,
of 160 4600 . Incidentally these predictions are how we know that Provence & Switzerland, and particularly, in Narbonne,
this was a total eclipse and those suggestions at the time that the Montpellier, Arles, Tarascon, Marseille, Avignon, Geneva and
ring of light in the lowest corona was due to an annular eclipse Zurich ... In all these cities, at the time of the total eclipse, we
was incorrect. From comparison with the radius of the Moon in saw around the Moon, which eclipsed the Sun, a round neck
Eimmart’s painting we have derived the width of the bright ring of pale light” (Cassini, 1706, pp. 250–251), on the basis of
to be 0.14R and the radius of the outer edge of the faint halo to his correspondences with other astronomers such as Jesuit priest
Page 12 of 28H. Hayakawa et al.: J. Space Weather Space Clim. 2021, 11, 1
Fig. 11. [Left] Comparison of the coronal extent in each eclipse drawings: Johann Meyer (Fig. 7; CUL.MS.RGO 1/69, f. 256; Photograph by
Hisashi Hayakawa, reproduced by permission of Syndics of ÓCambridge University Library), Johann Melchior Füssly (Fig. 8), and Maria Clara
Eimmart (Fig. 9; MS SBB Kart A2398; with courtesy of ÓStaatsbibliothek zu Berlin, Kartenabteilung). They show significantly good
agreements in their extent; [right] Simulated corona during the MM adopted from Figure 6 of Riley et al. (2015). Note that this comparison
takes the lunar disk in Mayer’s depiction to be the cross-hatched area and not the irregular inner region that has the same cross hatching with
additional dark marks. Being depictions of the eclipse over landscapes, only Meyer’s and Füssly extend beyond the frame shown. The shading
of the outer region using horizontal lines in Meyer’s print extends throughout the sky over Zürich (except where he marks planets and one star)
so there is no doubt that he is not depicting any brightness outside the uniform halo. Füssly’s landscape does, on the other hand, contain a very
faint enhancement on one side of the Sun that is shown in Figure 12.
Father Laval (Marseille), François Xavier Bon (St. Hilaire), described with horizontal lines. As shown in Figure 11, their
Count Luigi Marsigli (Tarascon), and Jean Mathieu de morphology seems highly consistent with the F-corona simula-
Chazelles (Montpellier). tions in Figures 5e and 6 of Riley et al. (2015), who concluded
The correspondence between Josef Nicolas Delisle at the that by the early 1700s the Sun had nearly lacked a large-scale
l’Observatoire de Paris and Johann Heinrich Müller (who had bipolar field but had only a small-scale (~10 G) mixed-polarity
been married to Eimmart before her death) in Nürnberg contains magnetic fields (ephemeral regions). The consistency between
an interesting insight on the featureless coronal shape. In his letter the eclipse drawings and F-corona simulation in Riley et al.
dated 1724 June 7, Delisle states “M. le Chevalier de Louville, to (2015, Figs. 5e and 6) seems to confirm that what Eimmart
whom I have shown this artificial ring spoken of in our and others saw was plausibly F-corona and to robustly support
Memoires, has found it all similar to the one he had seen in the hypothesised lack or significant reduction of large-scale
England” (Bibliothèque de l’Observatoire de Paris, MSS B1/2- solar magnetic field (Riley et al., 2015).
112, f. 1v). (See also Delisle, 1715; La Hire, 1715). He seems Another scenario for this inner ring is (2) reduced open
to be saying that, knowing the geometry of total eclipses of the flux, incapable of inducing structure in a K-corona. In this case,
Sun, they had decided that the ring of light surrounding the moon its appearance without significant streamers is especially
must be an optical illusion. This may explain why so many notable, indicating its open solar flux extremely weakened. This
reports concentrated on the things that were understood (timings is highly contrasted with both of solar-maximum coronal
of first and last contact, and of totality, etc.) and neglected to structure, with numerous streamers at all latitudes, and solar-
indicate the coronal light which not only did they not understand minimum coronal structure with streamers concentrated to the
but they feared it was just a trick of the eye. While Cassini (1706, solar equator (see Sect. 4.1). Overall, these images consistently
p. 251) reported “a round neck of pale light” around the eclipsed show circular corona without significant streamers. Therefore,
Sun commonly seen in the totality path, Maria Clara Eimmart what we can conservatively conclude here is that the K-corona
consistently chose of the pale blue colour for the outer halo was extremely weak and any structure in it was not detected.
and the yellow for the inner ring to reflect its much greater bright- Close inspection of Füssly’s diagram (Figs. 8 and 12) shows
ness. Hence the illustrations reported here show a solar corona a very pale outer region beyond the ring shown in Figure 12,
without notable streamers and such a corona was bright at its which extends somewhat further below the moon than above
inner edge but dull yet extensive beyond that. it. This may be a depiction of the outer corona but equally it
The yellow inner ring in Eimmart’s drawing (Fig. 9) could could point to a limitation in the artist’s technique or the printing
be interpreted as (1) all K-corona, the lowest solar atmosphere process or it could be a realistic depiction but the result of a halo
having the greater brightness, or (2) brighter K-corona within phenomenon of scattered light from very thin cloud. Were this
F-corona, or (3) all F corona. In these cases, the contemporary genuine coronal light it would imply a K-corona and not an
descriptions and the illustrations are arguably interpreted as the F-corona as it is not seen uniformly all around the Sun. It could
F-corona being brighter than the K-corona at all distances. The be seen that Füssly uses the same sky shading technique, a com-
coronal extensions of these three kinds of eclipse drawings bination of vertical and diagonal grids, both on the usual
appear highly consistent with each other. While Meyer’s etching eclipsed sky and this apparent outer glow.
drawing apparently shows an inner dark circle, this seems a The inner, bright, ring in Füssly image does show structure
byproduct of etching process, as the grids in the lunar body but it is very far from being a realistic depiction of streamers –
continues without break until the border with the eclipse sky there being 25 of them, equally spaced around the entire rim of
Page 13 of 28H. Hayakawa et al.: J. Space Weather Space Clim. 2021, 11, 1
Fig. 12. Comparison of [left] the external glow of Füssly’s drawing (Fig. 7) after correcting its side-inversion and [right] estimated angle P of
the solar rotational axis at Zürich (22°) with the solar rotational elements of Archinal et al. (2011a, 2011b) on the basis of those in Carrington
(1863).
the lunar disk. There is no hint at all of a sunspot-minimum style weak magnetic field in the southern solar hemisphere. However,
streamer belt. Hence this cannot be a low-sunspot depiction of the lack of structure in the corona of any kind (at all latitudes)
streamers and the regular spacing would make it a highly suggests that if K-corona was observed the open flux at the time
improbable depiction of even a sunspot-maximum Sun. Given of the 1706 eclipse was extremely low, as we would expect
that this is a landscape painting (with human figures expressing from both the model of open flux variation and the simple
their reaction to the event), Füssly would have wanted to empirical relationship (see Sect. 4.4 below) given the extreme
communicate to the viewer (and possibly potential purchaser) weakness of the (disordered) solar cycle that peaked a year
that this was the Sun in eclipse, we therefore believe the earlier. On this point, note that to see structure in the corona
25 equi-spaced spurs on the bright halo are the same stylized, (at either sunspot minimum or maximum) we must have a mix-
stereotypical radial structure used to characterize the Sun that ture of (dark) coronal hole flux and (bright) streamer belt flux in
we discussed in relation to the commemorative coins and the corona. The evidence of Eimmart’s painting and Clapiès and
satirical cartoons. We also note that Wurzelbau only depicted de Plantade’s detailed description, which we regard as the best
a uniform ring with no hint of the 25 uniformly spaced enhance- graphical and descriptive evidence that is available, is that
ments). Given the similarities between the Eimmart and Füssly structure was not observed.
drawings in Figure 11, we believe this to be Füssly’s stylized
way of showing Eimmart’s symmetrical blue halo. 3.2 Eclipse observations on 1715 May 3
There are two possible interpretations of Füssly’s depiction
of the solar corona beyond the inner stylized ring. One is to con- In this section, the 1706 eclipse is contrasted with the 1715
sider this as the extension of F-corona contrasted with the eclipse. Totality of this eclipse was widely observed in England
eclipse sky. Figure 1 of Reginald et al. (2017) adopted from and captured by multiple English astronomers. Halley (1715)
Phillips (1992) shows that the F corona starts to be brighter than saw this eclipse at London and described its corona as follows:
the modern K corona at about ~2.5 R and is brighter than the “there discovered itself round the Moon a luminous ring, about
“eclipse sky” up to a distance of ~4 R from solar centre. This a Digit or perhaps a tenth part of the Moons Diameter in
interpretation has some difficulty on its asymmetric extension Breadth. It was of a pale whiteness or rather Pearl colour, seem-
but shows more consistency with other textual reports and ing to me a little tinged with a colour of Iris, and to be concen-
Eimmart’s eclipse drawing. trick with the Moon” (Halley, 1715, p. 249). On this basis, it is
The other scenario is to note the asymmetry of this exten- assumed that the corona spread more than 1/6 and possibly 1/5
sion and interpret the faint region to be possible extension of of the lunar radius. The apparent radii of the Sun and the Moon
weak K-corona. Figure 12 compares the external glow of at the time of this eclipse at London (N51°300 , W0°080 ) is
Füssly’s drawing (Fig. 8) after correcting its side-inversion calculated to be 150 5100 and 160 5100 , based on their distance of
and estimated angle P of the solar rotational axis at Zürich 1.0092211 au and 0.0023702 au, respectively. Therefore, his
(22°). This shows southward extension of the external glow description shows that the corona was visible at least more than
and its direction is consistent with that of the southern extension 0.24 to 0.28 R.
of the angle P. The reported sunspot activity was mostly in the Halley (1715) details this corona further more: “this Ring
southern solar hemisphere during the MM in general and in appeared much brighter and whiter near the Body of the Moon
1706 in particular (see Fig. 6 of Ribes and Nesme-Ribes, than at a Distance from it; and its outward Circumference,
1993). One could tentatively interpret this as manifestation which was ill defined, seemed terminated only by the extream
southward K-corona and hence possible manifestation of the Rarity of the Matter it was composed of”, and “there were
Page 14 of 28H. Hayakawa et al.: J. Space Weather Space Clim. 2021, 11, 1
Fig. 13. Drawings of the total eclipse on 1715 May 3 in the correspondence Roger Cotes at Cambridge to Isaac Newton (Trinity College
Cambridge, MS R.16.38b, ff. 293–294; courtesy of the Master and Fellows of Trinity College, Cambridge). The left panel shows another eclipse
drawing “by a very ingenious Gentleman representing the appearance as seen by himself” and the right panel shows Cotes’ own eclipse drawing
(Edleston, 1850, pp. 183–184). Both of these drawings show cross-like coronal structure, although it was depicted very faintly in the left figure.
perpetual flashes or Coruscations of Light, which seemed for a colour of the Light of both was the same: I thought it was not so
Moment to dart out from behind the Moon, now here, now white as that of the Ring even in its fainter parts, but verg’d a
there, on all Sides; but more especially on the Western Side a little towards the colour of very pale copper” (Edleston, 1850,
little before the Emersion: And about two or three Seconds pp. 181–183).
before it, on the same Western Side where the Sun was just The sketch in Figure 13b is indeed very like Eimmart’s
coming out: a long and very narrow Streak of a dusky but other than a cross structure around the featureless dull corona
strong Red Light seemed to colour the dark Edge of the Moon; which Eddy (1976) interpreted the longer, brighter branch to
tho’ nothing like it had been seen immediately after the Immer- be a description of a solar minimum streamer belt configuration
sion” (Halley, 1715, pp. 249–250). However, Halley admitted and the shorter branch to be polar plumes. This interpretation is
that his colleagues with him at the Royal Society that day rather based on our knowledge of the modern Sun, which need
saw east-west asymmetry of the coronal structure a feature to not necessarily apply at the end of the Maunder Minimum. We
which he had not given “the requisite attention”. He described suggest that the cross-like corona reported could be a feature of
as follows: “the Observations of some, who found the Breadth the evolving corona as the Sun emerges from the MM and so
of the Ring to encrease on the West Side of the Moon, as the might have had no exact analogue in the more modern eclipse
Emersion approached; together with the contrary Sentiments observations illustrated here in Figure 1.
of those whose Judgment I shall always revere, makes me less However, we also note that a similar cross-like corona was
confident, especially in a Matter where to, I must confess, I gave reported and sketched during the solar-minimum eclipse of
not all the Attention requisite” (Halley, 1715, p. 249). 1766 February 9 by the offices on board the vessel Comte
Indeed, the corona extended further away from the ring d’Artois ( S34°, E39°070 ) with the French astronomer
described in Halley (1715). Figure 13 shows the original manu- Guillaume le Gentil de la Galaisière (Le Gentil, 1781) and the
scripts of the famous images of the 1715 eclipse included in a solar-maximum eclipse on 18 July 1860 seen from Lambessa
letter from Roger Cotes at Cambridge with another graphical in Algeria, by another French astronomer, Charles Bulard
report from nearby (see also Edleston, 1850, pp. 181–184). In (Ranyard, 1879), as shown in Figure 14. The similarity of the
contrast to the eclipse drawings in 1706 (Figs. 7–12), these 1715 eclipse drawing (Fig. 13) with the 1860 eclipse drawing
eclipse drawings do not show a featureless corona, as Cotes (Fig. 14b) is especially notable, as the latter eclipse took place
himself stated in his letter to Isaac Newton, “I took the greatest in the maximum of Solar Cycle 10 (R 182; see Clette &
part of this remaining light to proceed from the Ring which Lefèvre, 2016). This similarity shows the coronal structure in
incompass’d the Moon at that time. ... Besides this Ring there 1715 is rather consistent with reports during events at higher
appear’d also Rays of a much fainter Light in the form of a rect- solar activity in normal solar cycles after the MM.
angular Cross: I have drawn You a Figure which represents it It seems that by 1715 the corona, although in many ways
pretty exactly, as it appeard to Me. The longer & brighter still like that in the 1706 event, was changing and gaining some
branch of this Cross lay very nearly along the Ecliptick, the light structure, in particular developing a streamer belt. Given cross-
of the shorter was so weak that I did not constantly see it. The like forms have also been reported in events that others report as
Page 15 of 28You can also read


