GMR Infrastructure Limited - Business Update June 2022 - GMR World class infrastructure Assets
←
→
Page content transcription
If your browser does not render page correctly, please read the page content below
GMR Infrastructure Limited
             Business Update
                    June 2022

                                0
DISCLAIMER
All statements, graphics, data, tables, charts, logos, names, figures and all other      statements relating to future results of operation, financial condition, business
information (“Contents”) contained in this document (“Material”) is prepared by GMR      prospects, plans and objectives, are based on the current beliefs, assumptions,
Infrastructure Limited (“Company”) soley for the purpose of this Material and not        expectations, estimates, and projections of the directors and management of the
otherwise. This Material is prepared as on the date mentioned herein which is solely     Company about the business, industry and markets in which the Company and the
intended for reporting the developments of the Company to the investors of equity        GMR Group operates and such statements are not guarantees of future
shares in the Company as on such date, the Contents of which are subject to              performance, and are subject to known and unknown risks, uncertainties, and other
change without any prior notice. The Material is based upon information that we          factors, some of which are beyond the Company’s or the GMR Group’s control and
consider reliable, but we do not represent that it is accurate or complete.              difficult to predict, that could cause actual results, performance or achievements to
                                                                                         differ materially from those in the forward looking statements. Such statements are
Neither the Company, its subsidiaries and associate companies (“GMR Group”), nor         not, and should not be construed, as a representation as to future performance or
any director, member, manager, officer, advisor, auditor and other persons               achievements of the Company or the GMR Group. In particular, such statements
(“Representatives”) of the Company or the GMR Group provide any representation           should not be regarded as a projection of future performance of the Company or the
or warranties as to the correctness, accuracy or completeness of the Contents and        GMR Group. It should be noted that the actual performance or achievements of the
this Material. It is not the intention of the Company to provide a complete or           Company and the GMR Group may vary significantly from such statements. All
comprehensive analysis or prospects of the financial or other information within the     forward-looking statements are not predictions and may be subject to change
Contents and no reliance should be placed on the fairness on the same as this            without notice.
Material has not been independently verified by any person.
                                                                                         This Material is not and does not constitute any offer or invitation or
NONE OF THE COMPANY, THE GMR GROUP AND THE REPRESENTATIVES                               recommendation or advise to purchase, acquire or subscribe to shares and other
OF THE COMPANY AND THE GMR GROUP ACCEPT ANY LIABILITY                                    securities of the Company or the GMR Group and not part of this Material shall
WHATSOEVER FROM ANY LOSS OR DAMAGE HOWSOEVER ARISING FROM                                neither form the basis of or part of any contract, commitment or investment decision
ANY CONTENTS OR OTHERWISE ARISING OUT OF OR IN CONNECTION                                nor shall be relied upon as a basis for entering into any contract, commitment or
WITH THIS MATERIAL.                                                                      investment decision in relation thereto. Prospective investors in the Company or the
                                                                                         GMR Group should make its own investment decisions and seek professional
This Material is published and available on the Company’s website                        advice including from legal, tax or investment advisors before making an investment
https://www.gmrinfra.com/ which is subject to the laws of India, and is soley for        decision in shares or other securities of the Company or the GMR Group.
information purposes only and should not be reproduced, retransmitted,                   Remember, investments are subject to risks including the risk of loss of the initial
republished, quoted or distributed to any other person whether in whole or in part or    principal amount invested; past performance is not indicative of future results.
for any other purpose or otherwise.
                                                                                         REGULATORY AUTHORITIES IN THE UNITES STATES OF AMERICA, INDIA,
Any reproduction, retransmission, republishing or distribution of this Material or the   OR OTHER JURISDICTIONS, INCLUDING THE SECURITIES AND EXCHANGE
Contents thereof in certain jurisdictions may be restricted by law and persons who       COMMISSION AND THE SECURITIES AND EXCHANGE BOARD OF INDIA
come into possession of this Material should observe such laws and restrictions if       (“SEBI”), HAVE NEITHER APPROVED OR DISAPPROVED THIS MATERIAL OR
any.                                                                                     DETERMINED IF THIS MATERIAL IS TRUTHFUL OR COMPLETE. ANY
                                                                                         REPRESENTATION TO THE CONTRARY MAY CONSTITUTE A CRIMINAL
This Material and any discussions which follows may contain ‘forward looking             OFFENSE.
statements’ relating to the Company and the GMR Group and may include

                                                                                                                                                                                 1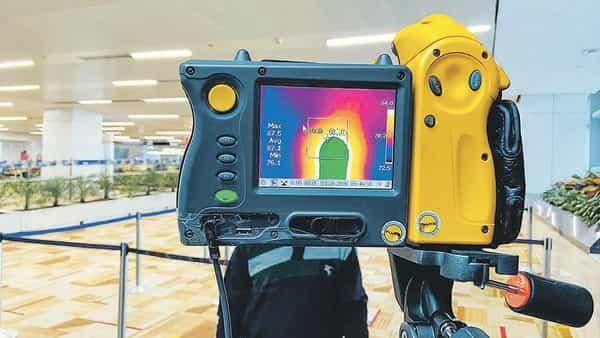
Table of contents

                         Particulars           Page No

Company overview & relative positioning         3-6

Industry & portfolio overview                   7 - 10

Regulatory overview                            11 – 12

Growth strategy                                13 – 23

Key financials                                 24 - 27

Partnership, leadership and ESG                28 - 32

Annexures                                      34 - 40

                                                         2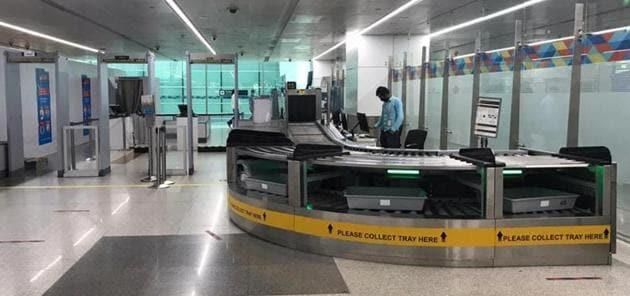
Company overview & relative positioning

Leading global airports platform with end to end capabilities
across the airport value chain
One of the largest airports platform… …with significant international experience
Global partnerships have helped develop capabilities across the value chain
2nd Largest1 globally 179 mn3
Largest in India Operational capacity: Overview Key partner
Private airport operator 94 mn
Indonesia Early mover in Indonesia (Medan) when
Under development:
government started privatising local airports
85 mn
Recently won duty free contract for Bali but
decided against taking up the concession
Greece 1st Indian operator in Europe
#9 102.6 mn2
No. of airport assets Passengers Develop, operate and manage the upcoming
under operations or handled in FY20 airport in Crete
various stages of across all gateway
development airports Philippines 1st project under hybrid PPP model (Cebu)
Successfully completed the construction and
handover of the terminal at the Clark airport
#1 ASQ rating by ACl4 ~2,520 acres5
2019 - DIAL in 40 mn+ Of land with strong Maldives Involved in the modernisation of the Ibrahim Government
category real estate ("RE") of Maldives
Nasir International Airport, Male
2020 - GHIAL in 15 - development potential
25mn pax category One of the largest investments in Maldives
Turkey GALs 1st international airport project
Lucrative 2.3x MoM exit in Dec’13
26%6 Integrated + End-to- In collaboration with Limak focused on
share of passenger end capabilities development, financing, commercial strategy
traffic in India across the entire value
chain (aero, non-aero, Middle East Recently won IT infra bid for Kuwait airport (operational
readiness & transfer services)
value added, O&M,
Engg. etc.) Provided testing support of specialised airport system
equipment's in Muscat / Oman
1) Prior to COVID, GMR Airports Ltd. (GAL) was the second largest majority private airport operator in the world based on annual passengers; 2) Nagpur Airport traffic and capacity is not considered since it is currently handled by AAI
3) Includes Delhi, Hyderabad and Cebu LTM (Apr 2019-Mar 2020) passenger data; 4) ACI: Airport Council International; 5) Includes DIAL (230 acres), GHIAL (1,500 acres), Goa (232 acres), Bhogapuram (294 acres), Nagpur (247 acres),
Cebu (11 acres),Greece (~ 10 acres); 6) Only includes operational Indian airports in GAL portfolio – DIAL and GHIAL
4World’s 2nd largest private airport operator,…
No. of Assets 49 91 4 5 5 14
2019 Passengers
255.0 102.6 94.5 94.0 63.9 48.7
(mn pax)
10%
20%
Traffic Split by
Geography2
80% 100% 100% 100% 100%
90%
Developed economies
Emerging economies
Geographic Europe, Asia and Europe and Latin
Asia and Europe Europe Europe Latin America
presence Americas America
Asset portfolio
49 airports in 9 airports in 4 airports in United 5 airports in 5 airports in 14 airports in Latin
12 countries 4 countries Kingdom 4 countries 2 countries America
Presence across the most lucrative and fast growing markets
Long remaining concession period across the portfolio with ultimate capacity of 330mn passengers, positions the business to capitalize on
robust traffic growth outlook
Amongst few airport operators that have successfully penetrated emerging economies across Asia and EMEA
Source: Company information
Notes:
1. Includes Kualanamu airport, Indonesia and Bidar Airport, India 5
2. Economy classification as per UN classification; Economy in transition considered as developed…India’s largest and most experienced pure-play airports platform
GAL is India’s only listed airport operator with an uniquely crafted credible story
Anchorage Strategic partnership
Marquee gateway assets
with a renowned global
Airport operating with significant growth
~15 years ~2 years ~5 years2 operator driving value
experience and hub potential
creation
Number of Indian
63 7 1
Assets
FY20 Passengers
89.04 79.0 32.4
(mpax)
Operating synergies Long operating history
Private Operator
44.4% 39.4% 16.2% arising from network of allows capitalizing on
Market Share (%)5
asset in India and opportunities across the
Proportion of
24.4% 23.7% 14.1%
internationally aviation value-chain
International pax (%)
International presence X X
International
development X X Platform with unique Best positioned to
experience
international experience benefit from pipeline of
of operations and privatization in the
Greenfield experience development region
With a market share of over 44%5 in India, GAL has demonstrated the scalability of the platform which has wide ranging capabilities across
the airport value chain, developed over years of experience
Source: Factest, company information 3. Including Nagpur
Note: 4. Nagpur passenger numbers not consolidated as it is still operated by AAI
1. All numbers for FY20; FYE 31st March 5. Airport operated by private players only; Excludes Cochin and Kannur
2. Corresponds to Fairfax
6Industry & portfolio overview
GAL has exposure to some of the fastest growing
and attractive emerging markets (India and South East Asia)
GAL’s core markets expected to have the highest growth rate among all regions globally Centre of gravity continues to shift towards east
Ranking of aviation markets
10
US China
8.9% 9
China US
8
UK India
2.9% 7
Spain Indonesia
6.2% 6
Japan UK
10.5%
Russia & Germany5 Spain
4.0% 3.1% 4 Japan
Central Asia 5.4% India
2.7% 6.5% 13.7% 3
Italy Germany
Europe 4.1% 5.7% 2
France Thailand
China 1.7% 1
Indonesia France
North America 6.9%
0
Middle East North East Asia
2017
2019
2021
2023
2025
2027
2029
2031
6.6% South Asia 6.5%5.5%
5.4% India and Indonesia will be the 3rd and 4th largest
aviation markets by 2030
South East Asia
4.2% 4.8% Africa Emerging market passenger traffic
2.9% 3.0% has grown significantly faster than GDP
Passenger traffic GDP multiplier (2009-19)
Latin America Oceania
1.7x 2.0x 1.3x
GDP multiplier GDP multiplier GDP multiplier
Historical Growth1 CAGR (2014-2019) 2019-40 pax traffic growth Avg. GDP Avg. GDP Avg. GDP
growth2 growth2 growth2
Projected Growth CAGR (2019-2040)
GAL airports
4x 3x 10.8%
18.6%
9.6%
19.4%
7.0%
9.3%
GAL’s current core markets
(South Asia) (South East Asia) Avg. pax Avg. pax Avg. pax
growth2 growth2 growth2
Sources: ACI, Boeing, IHS, IATA, ICAO, The World Bank, Sabre GDD, Airbus, EIU, World Bank, CAPA
Notes:
1. World bank data by country; Excludes smaller countries with limited data coverage
2. Average y-o-y GDP and passenger traffic growth from 2009-2019
8Asian aviation market is poised to grow substantially
on the back of attractive sector dynamics
Rising middle class population in India and SEA, supported by Aggressive fleet expansion by low cost carriers (LCC) in South
strong GDP growth Asia and South East Asia to support rising demand
Middle class1 (mn households)
16% 3% 19%
26% 26% South Asia South East Asia
6.9% 7.6% 4.3% 2.1% 1.6%
7% 6% Europe North America
2019 2040
India’s middle class population expected to fleet share fleet share
9% Others China
grow 3.6x in the next 10 years, will still remain 21% 21%
28%
321 far behind China and would have the potential 19%
for similar growth in subsequent years
Regional fleet size (#)
8,820 9,640
147 8,640
6,670
4,340 4,910
61 3,730
28 49 46 45 2,600
1,575
17 19 19 690
China India South East Asia US UK South Asia South East Asia China Europe North America
2019 2030 Growth multiplier GDP growth (2019-2030) 2019 2030 Growth multiplier
Asian aviation markets are highly under penetrated, with India expected to double by 2030
Domestic seats per capita International seats per capita
USA (2019) 3.03 UAE (2019) 16.22
Japan (2019) 1.13 UK (2019) 4.43
Saudi Arabia (2019) 1.01 France (2019) 2.43
China (2019) 0.52
Japan (2019) 0.97
Vietnam (2019) 0.48
USA (2019) 0.93
Indonesia (2019) 0.48
Philippines (2019) 0.34 Indonesia (2019) 0.18
India (2030) 0.26 China (2019) 0.14
2.0x Asian Others
India (2019) 0.13 India (2019) 0.06
By 2030, India domestic seats per capita will double, however it will India’s international seat per capita capacity was less than 50% of
still remain below the others large markets China’s capacity in 2019 with significant headroom to grow
Source: Oxford Economics, IHS Economics, Airbus GMF, EIU, Fitch, IATA
Notes:
1. Households with yearly income between $15,000 and $75,000 at PPP in constant 2015 prices 9India, GAL’s core market, is at an inflection point,
offering massive potential for future growth
China case Benchmarking with China suggests that India can expect a boost in International Outbound Traffic in the
study next decade supported by tourism, migration & trade
India expected to reach
China domestic outbound traffic growth
China’s 2010 GDP per India’s current economic growth phase is similar to China’s
capita PPP value in 2024 growth post 2010 driven by wave of privatization, FDI & JV based
600 China’s domestic traffic grew rapidly knowledge transfer and labour force growth
between 2001-10, which settled after
500 2010. India is currently in this high-
Traffic (mn)
400 growth phase
300 Rapid growth in domestic outbound traffic was followed by spurt
200
in international traffic for China due to tourism, migration, trade
100 Economic growth of country propelled through tourism
0 & other means
1 2 ‘02
’01 3 ’03
4 ’045 ’056’06 7‘07 ‘08
8 ’09
9 ‘10
10 ’11
11‘12
12‘1313‘1414
‘15 15 16 ‘18
‘16 ’17 17 18
Employment opportunities increase and quality of
employment improves
China international outbound traffic growth
After the domestic growth, the international Citizens have more disposable cash with them. After
traffic in China boomed in 2010 – 20, routine spends, they are left with more cash for
140 because of tourism, migration & trade discretionary spend
120
100 Increase in tourism share of wallet leading to flourishing
Traffic (mn)
80 of both domestic & international tourism
60
40
20
Having recorded impressive growth in domestic traffic
during 2014-19 similar to growth China recorded in 2001-10,
0
1 2 ‘02
3 ’03
4 ’045 ’056’06 7‘07 ‘08
8 ’09
9 ‘10
10 ’11
11‘12
12‘1313‘1414 India is likely to witness sharp growth in international
’01 ‘15 15 16 ‘18
‘16 ’17 17 18
outbound traffic as well in medium term
Source: Sabre, IHS Economics, Airbus GMF 2021
10Regulatory overview
Mature and transparent regulatory environment, attracts global players
Normalization of airport economic regulation Clarity on nodal agencies - no regulatory vacuum
Assured return on regulatory assets through cost plus model
Uniform Regulates tariffs, fees and other expenses for airports
Clarity on application of hybrid till at airports with pax >3.5mn based on multi year proposals
tariff AERA1
guidelines Current tariff framework allows meaningful protection for Applicable for airports with pax throughput >3.5mn
aero revenue against disruption in traffic
Dedicated appellate tribunal responsible for
Clarity on National Civil Aviation Policy's (2016) liberalised
Clarity on addressing any disputes with AERA1 + related issues:
end-use of Airport RE land endorsed by Supreme Court
end use of TDSAT2 - Fixation of tariff rates
real estate Real Estate Deposits (RSD) of commercial property - Allotment of slots
development can be used to finance project capex
- Allocation of space in the airports
Well-defined regulatory model has encouraged investors to confidently acquire controlling stakes across airports in India
Jewar GMR Airports Ltd. (GAL) Bangalore (BIAL)
Greenfield investment in Acquired 49% stake in GAL Acquired 33% stake (2016) and
Jewar (2019 ) - 100% stake airport holding company (2020) Anchorage now has majority control
Benefits to Established tariff setting mechanism since over a decade (both DIAL and GHIAL successfully crossed 2 cycles and in third control period)
GAL assets BAC3 + 10% tariffs serves as the floor to aero charges at DIAL (State Support Agreements help alleviate any potential aero concerns)
Note: 1) AERA - Airports Economic Regulatory Authority of India; 2) Telecom 12
Disputes Settlement and Appellate Tribunal 3) BAC - Base Airport ChargesGrowth strategy
Clearly identified growth and profitable levers at play
GAL has mastered both Focused on building its platform play model and
organic + inorganic growth strategy monetising its real estate assets
Real
Organic Estate
Well
positioned to
Inorganic transition into
Platform
a full-service play
operator
1 2 3 4
Significant headroom Strong track record Full-service operator Proven track record
to meet pax demand of winning airport with renewed focus of monetising high
in medium term concessions globally on winning ancillary quality assets with
businesses marquee client base
Substantial upside Focused strategy in
for non-aero bidding for new Multiple new Mixed use model
revenues Indian airports as opportunities already with city specific
part of NMP1 operationalized themes
Smart cities / IT infra
investments help Increasing trend of Phased strategy: Healthy mix of
meet incremental privatisations in build capabilities -> development vs
30-40% augmented identified key operate in own / rental portfolio
capacity without emerging markets platform airports ->
additional capex expand to non- Own vs 3rd party JV
investments network airports land development
Note:
1) National monetisation pipeline
141 Global portfolio of marquee assets...
Faster ramp-up given old airports
with existing traffic to be closed
post COD of new airports being
constructed by GAL
DIAL GHIAL Mactan Cebu Bidar Bhogapuram MOPA Nagpur Crete Medan
Airport / % GAL stake
(64%) (63%) (40%) (63%)(1) (100%) (100%) (100%)(2) (21.6%) (49%)
Base city Delhi Hyderabad Cebu Bidar Bhogapuram Goa Nagpur Kastelli Medan
FY20 Pax 67.3 21.7 11.4 n/a n/a n/a 3.1 n/a 10.5(3)
FY15 – FY20 Pax
10.4% 15.9% 10.2% n/a n/a n/a 16.9% n/a n/a
CAGR
FY15 – FY20 Cargo
6.5% 7.3% n/a n/a n/a n/a 9.7% n/a n/a
CAGR
Concession awarded
year 2006 2008 2014 2020 2020 2016 2018 2017 2021
Remaining life
(assuming renewal of 30y
44y 46y 19y 11y 40y 56y n/a 25y
concession) from COD
Max capacity (mn pax) 119 80 28 n/a 24 33 n/a 15 n/a
Land available 230 acres 1,500 acres 11 acres n/a 294 acres 232 acres n/a 10 acres n/a
FY35 domestic4 - 19% gross revenue
Upfront fees of INR303 / pax; 36.99%; share + 2.5% of
% revenue sharing / 45.99% 4.0% US$320m + Cost plus FY35 international4 - 2 year 14.49% n/a aero revenue +
concession fee VAT INR606 / pax; moratorium US$207m over
10 year moratorium 8 years
Note
1. Contracted by GHIAL Operational Under development Brownfield projects
2. Supreme Court upholds Bombay High Court’s judgement granting of concession rights of Nagpur Airport to GMR
3. Traffic for CY2018
4. Moratorium till FY35, FY35 base figures provided and inflation adjusted fee from FY36
15...with substantial headroom for growth in a highly
1
under-penetrated market like India
Pax (mn) – Delhi airport Pax (mn) – Hyderabad airport Pax (mn) – consol GAL airport capacity
132.3 215.3
Will be operational
49.8 in the next 2-3
34.6 8.4 years
67.3 84.7 394
17.8 21.7
97.7 3.9 41.4
49.5 17.7 94
Existing Under Inc till Ultimate
FY20 FY30 FY20 FY30 capacity development ultimate capacity
capacity
International Domestic
Capacity doubling from 94mn to 179mn in the next 2-3 years with significant lease life remaining after the expansion
Opening Airside expansion done till end of concession Concession Ultimate
capacity ending in capacity1
Delhi 66 mn 100 mn
Expansion to 100 mn 2066 119 mn
Hyderabad 12 mn 34 mn 40 mn 5252
mnmn 2068 80 mn
Goa COD 7.7 mn 11.1 mn 16 mn 21.6 mn 2060 33 mn
Crete COD COD 15 mn Next phase 2056 15 mn
Bhogapuram COD
COD6 6mn
mn 12 mn 2062 24 mn
Cebu 16 mn 16
16mn
Mn Next phase 2040 28 mn
Capacity expansion
2022 2023 2024 2025 2026 2027 2028 2029 2030 2031 2032 2033 2034 2035
Greenfield projects
Sources: AAI, CAPA
Note: 16
1) GAL has two more brownfield airports in its portfolio; Medan Airport in Indonesia – Recently won, CA signed; Nagpur Airport – Supreme Court upholds Bombay High Court’s judgement granting of concession rights to GMR1 World class airport assets with potential to serve as regional hubs
GAL value proposition /
Market opportunity Evolution in narrow body aircraft technology
competitive advantage
Large number of Narrow body LCCs well Medan / Delhi can
Re-engineered narrow
Evolving consumer unserved and positioned to win attract LCCs to
body aircrafts enable
preference for direct underserved market share from wide relocate hubs given
LCCs to serve mid-to-
flights routes in short and body aircrafts in mid- relatively low cost base
long haul routes
medium haul markets long haul routes vs other regional hubs
Delhi, India
Medan, Indonesia
Capitalising on the trend of narrow body aircrafts, Indigo has placed the largest
Proximity to 3 regional hubs - Bangkok / Singapore / Kuala Lumpur
order book for A321 XRL targeting medium-haul routes
Open Sky policy in ASEAN region
Indian aviation sector set to also benefit from capturing 6th freedom traffic
Garuda (home carrier) has already added Medan as a layover hub for its
Originating flight volume will create hubs in India for aggregating domestic and
flights from Indonesia to places such as London and Amsterdam
international passengers
Afghanistan China
~5-6 hours of air
Pakistan
travel from Medan
Nepal
Bhutan
OSL
Russia Bangladesh
BHXAMS HAM LED Myanmar Taiwan
MAN
DUB STN DUS PRG DME India (Burma) Hong Kong
LGW
OPY BUD Kazakhstan Mongolia Laos
GVA VCE
BCN ROM Turkey Thailand
LIS China
ATH AMM Iran
ELQ Pakistan KIX CambodiaVietnam
Algeria Libya CAI DMM Philippines
India
ARB REP MNL
5 hours Sri Lanka Malaysia Brunei
[LOS] Democratic 6 Indonesia Maldives Singapore
Republic of
Congo
NBO 7
hours CGK
8
hours DPS Indonesia
JNB
hours Australia
South Africa PER BNE
ADL Timor-Leste
MEL AKL
Underserved Unserved
Current markets served
17Non-aero future upside driven by strong consumption story
1
and customized theme based initiatives
Promising growth fueled by favourable demographic and consumer factors 1 Significant headroom vs international markets
Retail Cargo QSR Advertisement Duty Free Non Aero Revenue
Total retail market size Total cargo transported Total QSR Sales Advertising market size SPP / pax Non aero revenue / pax
(US$ bn)2 (mn tonnes) (in US$ bn)2 (US$ bn)2
11.0 14.5
1,500
$19-20
$18
5.5
793 7.5 $10-11
4.6
3.3
$5
2020 2024E 2020 2030E 2020 2025E Delhi Dubai/Changi Delhi Changi
2020 2024E
Source: Invest India Source: CAPA Source: Technopak: Netscribes Source: Dentsu Digital Report Source: company presentation Source: CAPA
Non-Aeronautical initiatives
Delhi airport duty free recently
Duty refurbished (2x SPP / pax growth Demand Crowd management initiatives for Loyalty Advanced customer data analytics
Free between 2006-08 on transfer of Manage- dealing with peak / off peak demand Program will help identify new opportunities
ment
business to a private operator)
E-boarding, smart trolley, biometric Customer loyalty programs designed
Key initiatives: WiFi enabled scanning, crowd behavior to entice customer and enhance
proximity marketing, 360 degree analytics, retail store heat maps their spending across the platform
virtual store and digital catalogues
18
Note: 1) All data points relate to India market; 2) Exchange rate: 1 USD = INR 75Proven track record and ADP partnership position GAL favourably to
2
win new airport bids across India and other emerging markets
FY20 Traffic FY17-20 CY19 Traffic
Immediately available growth (MPPA) Traffic growth International opportunities with focus on (MPPA)
opportunities in India fast growing emerging markets
Recent win: after
2.92 2.46 3.01 2.12 Cebu, Medan is
8.7 2.3 the second Airport
of SE Asia region
17.85% 16.24% 16.24% 14.94%
in GAL portfolio
Amritsar
Bratislava, Slovakia
Varanasi
Beirut
Indore Saudi Arabia
Raipur Bhubaneswar
Medan, Indonesia
3.67 Batam, Indonesia
Lombok, Indonesia
National monetization 16.31%
pipeline
25 AAI Airports will be Indonesian
Trichy
privatized in next 4-5 market has
years 1.61 98(1) 5.62 4.12 similar
13 airports have been
prospects as
lined up for privatization
by FY23. Six major 5.80% that of India
airports will be clubbed
Bid process has started and GAL meets the qualification criteria
with 7 smaller airports
Bids under consideration
Immediate growth pipeline of 15+ mn passenger capacity through Strong operating and development track record coupled with ADP’s
some of the fastest growing airports in India partnership expected to give significant boost to qualification scores
7 smaller airports are - Jharsuguda, Gaya, Kushinagar, Kangra, Tirupati, Jabalpur and Jalgaon Notes: 1. Total capacity across multiple airports in 2018; 2. CY18 Traffic (MPPA)
193
Building on its existing capabilities, GAL plans to
focus on creating an asset light ancillary platform…
Current strategy Future strategy
(expanding presence across
(typical airport developer)
value chain)
Airport development and Self operated
operations
Self operated Self operated
Concessioned out to Concessioned out to Self operated
Airport ancillary businesses
operators operators (minority operating partners)
GAL has identified potential opportunities in certain ancillary businesses and has gained operational expertise from JVs / partners
Airport development
Airport ancillary businesses – non-regulated, high growth potential, & asset light
and operations
Commercial Engineering &
Concession Build Operate businesses maintenance services
owner
Non-Aero Value add
businesses services Engineering O&M
Previous area of focus Loyalty programs,
Cargo Duty Car F&B Retail Advertising digital, analytics, EPC & Engineering Airport
Growing array of services
free park & promotions payment gateway etc. PMC maintenance O&M
Opportunity areas
already identified and ongoing
20…in a phased manner targeting opportunities across
3
both own network as well as external airports
GAL platform growth strategy – significant progress made across all 3 phases
Phase 1: Phase 2: Phase 3:
Platform building Own / network airports External opportunities
Build and scale ancillary
Scale platform presence Expand presence to
business platforms with
across own + network external and open market
presence across the airport
airports opportunities
value chain
Duty free platform Won the non-aero master Operating the duty free
concession bid for the business at Kannur airport
Car park platform upcoming Goa airport
GMR Engineering and
Cargo platform Won the bid for the cargo Management Services won
business at the upcoming an IT infrastructure bid for an
F&B business platform Goa airport airport in Kuwait
Retail business platform
213
GAL is favourably positioned to build a successful value additive
holistic ecosystem with diverse sources of income
Digital initiatives Creating a one stop experience centre for non-passenger traffic
Digital marketplace
Increase in sale by online booking hotels, cabs etc. Delhi
Lower customer acquisition cost
QSR & fine-dine options Premium retail outlets Business centre
Customer loyalty program Gaming Zone with AR / VR2
Launch a comprehensive loyalty program capabilities
Hyderabad
Heathrow went 5X in basket value, 8.6% up in retail Amphitheater with regular events
revenue through its loyalty program 10 QSR brands + 2 fine dining
Drive–in theatre
options + micro-brewery
Fintech platform Hospitality district (including casinos) with c.200+ hotels
Potential US$16 -25m1 savings in payment gateways Goa Full fledged multi-store retail outlets
fees by creating in-house payment gateway or Hi-tech car washing facility
partner with mobile wallet
Holistic ecosystem
Parking Off airport retail
Fasttrack VIP Services
Personalized Offers Lounge Access
E commerce Market place Loyalty Programme
Services on subscription Mobile Shopping
GAL platform has diverse sources of income including management income from airport subsidiaries
22
Note: 1) Fx rate: 1 US$ = INR 75; 2) Augmented reality and virtual realityHarness the potential of prime airport commercial land through
4
thematic monetisation (healthy mix of leasing and development)
Long Change in monetization strategy
Excellent
Prime real lease Superior
connectivity-
estate period rental
by highways
(upto 2060) yields Development
and metro Leasing
(Own or JV)
Delhi Hyderabad Goa
Land
230 acres 1,500 acres 232 acres
Parcel
Mixed use with industrial focus (retail,
Mixed use with commercial focus (office, Mixed use with tourism focus (hospitality
Theme office, social infra and industrial parks /
hospitality and retail) and retail)
warehouses)
Development of 1.7 msf logistics park (incl. Terminal Hotel - ~200 keys hotel to cater to
Marquee hospitality and commercial district
Current Amazon fulfilment centre) increasing tourist demands
projects Phase - 3 land development with Bharti
Other developments: K-12 schools, co- Airport Retail Village - Full fledged retail
Realty
living spaces and factories outlet over 10 acres of land
Demonstrated strong track record of RE land monetisation in recent times despite COVID impact on overall RE market
(Bharti Realty development (5 mn sqft) in DIAL and logistics park in GHIAL (1.7 mn sq ft))
Leverage prime location between central Aero Plaza – F&B, retail outlets, drive-in- Passenger services business
Growth Delhi and commercial district of Gurgaon theatre, spa services, business centre and Entertainment zone right outside the airport
Plans water sports / gaming / camping options
Scope for further developments at par with Casinos, F&B, microbreweries, gaming
central business districts (CBD) Possibility of SEZ1 development arcade, etc.
Key
–
partners
Note:
1) SEZ – special economic zone
23Key financials
Robust track record of financial performance with
                                            positive signs of recovery post Covid impact

    Consolidated Indian airports pax (mn)1                                                                          DIAL & GHIAL non aeronautical revenue (US$mn)2
                                                                            Impacted by closure of
                                                                                 Jet airways,                             464         507         587          483          496          570         427            584
                                                                             Pakistan air space and
                                                                                                                        []         Net Revenue (US$mn)
                                                                                     Covid
                                                          99           97
                                              91                                                                         Robust real growth of
                                                                                    Impacted by                             high single digit                                                                  227
                                 80
                                                                                      COVID                                (adj. for inflation)
                     66
         56                                                                                     57

                                                                                   34                                                                                        325          347
                                                                                                                                                                 280                                               257
                                                                                                                                        240         240
                                                                                                                             178                                                                      192

       FY15        FY16        FY17         FY18        FY19         FY20        FY21         FY22                        FY15         FY16        FY17         FY18        FY19         FY20        FY21         FY22

  EBITDA (US$mn)                                                                                                      Net debt (US$mn) and net leverage
         49%        65%         70%          56%         44%          53%         25%          48%                        5.1x         3.3x        1.5x        1.9x        4.6x         5.4x       20.3x        7.0x
    []     EBITDA / Net revenue margin%                                                                                 []      Net debt / EBITDA
                            413        Delhi Airport operating on
                                                BAC (floor tariff) From Q2’FY18                                                                                                                                  2,616
                    332                                                                                                                       Inc. on account of capex
                                                                       302                                                                investment for GAL pax capacity                           2,130
                                              271                                                280                                       expansion from 94mn to 179mn
         227                                              220                                                                                                                           1,639
                                                                                                                         1,169        1,104                                1,006
                                                                                    105                                                            613          519

       FY15        FY16         FY17         FY18        FY19         FY20         FY21         FY22                      FY15        FY16         FY17        FY18        FY19         FY20        FY21         FY22
Source: AAI, company info
Note: Fx rate 1US$ = INR75                                                                                                                                                                              []    FY15-20 CAGR
1.    Delhi, Hyderabad and Goa included; Nagpur Airport traffic is not considered since it is currently handled by AAI
2.    FY15 numbers were based on I-GAAP, FY16 adjusted for adoption of IndAS ; Non-Aero Revenue from standalone DIAL & GHIAL;financials; Net Revenues of the overall airport segment till FY20 and GIL from FY21 onwards
                                                                                                                                                                                                                             25
Strong cash generation profile from diverse sources
of income boosting return metrics
Capex (US$mn)1 Diverse sources of income and cash generation
595
Significant FCFE generation post 2024 given end of capex cycle
466
401 382 Reliable dividends from mature assets like DIAL and GHIAL
211 Stable management fee from all assets operated
175
41 Focus on increasing contribution of profitable cash flows from
22
non-aero and ancillary businesses at GAL platform
FY15 FY16 FY17 FY18 FY19 FY20 FY21 FY22
Taking advantage of declining cost of debt through refinancing Key reasons behind decline in cost of debt
Current
Amount Purpose
YTM (%)2
GAL Bond Capex &
Rs 3,000 mn 8.2% Post demerger of non-airport business risk profile has changed
(Aug’21) Debt refinancing
DIAL Bond Capex &
USD 450 mn 9.1% Cost of debt much lower for good quality assets
(Feb-Mar’21) Debt refinancing
GHIAL Bond
USD 300 mn Capex 6.3% Leverage ADP ownership to access capital at much lower costs
(Jan’21)
Note: Fx rate 1US$ = INR75
1. Capex figures from GMR Airport Consol Cash Flow Statement
2. Bloomberg yield to maturity (YTM) as on 5th May 22; YTM denotes returns to investor who holds the bond till maturity
26GAL potentially exploring options to set up an
Investment Platform to unlock value of its asset portfolio
GMR Group’s long term vision
Bid and acquire Develop and Operationalize with Churn assets/pair stake
airport assets Finance stable cash-flows to recycle capital
GMR Infrastructure Ltd (Airport)
51% (can go up to 59%)
49% Controlling stake
Group ADP GMR Airports Ltd (GAL) New Airports Attractive to
global long term
Controlling stake New airport assets investors
can be injected
Current Airport Portfolio post maturity /
stable cash flows
Goa Airport
Delhi Airport (DIAL)
Nagpur Airport Investment platform Financial investor
Hyderabad Airport (GHIAL)
Bhogapuram Airport
Bidar Airport Non-majority stake
Crete Airport (Int.)
Cebu Airport (Int.)
Medan Airport (Int.)
Investment platform will house operational airport assets located in high growth regions
Ability to generate free cash in medium term (3-5 years)
Part of the free cash will be used to reward the investors and rest as a growth capital
27Partnership, leadership and ESG
Proven track record of strategic partnerships with global majors to
create synergistic advantages
Strategic partnership with majority French government owned and Paris based Groupe ADP
About Group ADP Investment Merits Strategic Rationale
Leverage Expertise
One of the largest airport groups in
Europe based out of Paris (France) Building strong partnerships by leveraging
Creation of world-class Airport Development
expertise through systematic best practices
and Management platform in partnership with
implementation
strategic airport operator
Sharing knowledge and best practices
Operating 24 international airports across airports
across geographies
Strategic partnership
Strong partner to capitalize on future growth Market access for service companies
Handled1 234 Mn passengers opportunities Route development
(including Istanbul Atatürk) Retail and passenger experience,
IT/Innovation, engineering etc.
Other Marquee Partnerships
■ Europe’s 2nd largest passenger airport
■ Europe’s largest cargo hub
■ Sovereign wealth fund with AUM of USD600bn
■ Operator and manager of Malaysia’s
39 airports
■ Second largest EPC company in Philippines
■ Strong partner of the Philippine government
■ Real estate construction conglomerate in through the PPP program
Greece
Note: 1. For the year 2019 29Best-in-class management team with strong corporate governance
standards enhanced by ADP partnership
Group Directors on GMR Board Key management and Board of Directors
Srinivas Prabhakararao Antoine Crombez1
Bommidala Indana Executive Director
GM Rao
Chairman, Energy CEO – Airports and Deputy CEO,
Group Chairman
& International Construction, GAL GAL
Airports
P. Sripathy
GRK Babu
CEO – Airports
CFO – Airports
International
G Kiran Kumar Sector, GAL
(Philippines), GAL
GBS Raju Corporate
Chairman, Airports Chairman &
Managing Director Philippe Pascal1 Augustin De
Non – Executive Romanet De Beaune1
Director, GAL Non-Executive
Director, GAL
Madhva
BVN Rao
Bhimacharya
Chairman,
Terdal Saurabh Chawla
Transportation &
Urban Infra
Whole Time Director – Finance
Director and Strategy, GIL
Independent panel of eminent industry leaders Reaps benefits from ADP partnership
Consists of eminent people from diverse backgrounds ADP’s involvement at management level ensures highest standards of
corporate governance at a global level
Quarterly meetings with a view to advise on business strategy and future
positioning Exchange programs between senior management at GAL and ADP
Provides the benefit of an outside-in view of the business allows for sharing of knowledge and transfer of best practices
Ensures highest standards of governance and professionalism helps provide international exposure and propels strategic thinking
Note:
1) Nominated by Groupe ADP
30GMR Groups’ strong commitment to future sustainability
through ESG framework
Environment People
DIAL achieved “Level 4+, Transition” ACC (1) in Asia Pacific
region and GHIAL achieved “Level 3+, Neutrality” ACC
259 business organized training and 127
corporate trainings conducted in FY22
Both the airports have adopted green building standards in the Learning and
existing as well as upcoming infrastructures Development
40,374 work hours of training covering 2125
permanent employees in FY22 (83% coverage)
Both the airports have adopted low emission processes and have
installed solar plants (RE)
Profits Governance
CSR Thrust Areas
Strict governance principles through guided values of the
organization and all the secretarial compliances in place
Internal audits, MAG audits keep processes very transparent
Empowerment Regular Board meetings conducted to keep Board updated on all
Community aspects
Health Education and
Development
livelihoods
Periodic training of employees on the CoC guidelines
CSR Spend (FY20-21) - INR 222 mn Risk management framework and governance process,
including SOPs around risk assessment and mitigation
Total beneficiaries over 120,000
____________________
Source: Company data
(1) ACC – Airport Carbon Accreditation
31Why to invest?
World’s 2nd largest private airport operator and integrated airports platform with wide ranging
01 capabilities and Pan Asian footprint
02 Opportunity to participate in the one of the fastest growing aviation markets in the world
03 Portfolio of world class airport assets acting as regional hubs with significant potential to grow traffic
Multiple growth and profitable levers – organic growth, new airports acquisition, GAL platform play
04 and real estate monetisation opportunities
Robust operating performance coupled with strong cash flows in the next 3-5 years - All underlying assets
05 would be generating FCFE for rest of the concession (30-40 years) after the current capex cycle gets over
Led by experienced management team and proven track record of strategic partnerships with global
06 majors to create synergistic advantages and meet global corporate governance benchmarks
07 ESG focus remains at the core of the business framework - strong commitment to future sustainability
32Thank You
Covid timeline in Indian aviation
Apr- Jun 2020 Jul-Sep 2020 Oct-Mar 2021 Apr- May 2021 Jun-Dec 2021 Jan-Apr 2022
Complete Restricted Good Covid 2nd Road to strong Covid 3rd Wave
Lockdown Operations Recovery Wave Impact Recovery
Domestic flight Ban extended on Int’l Bubble Air bubble Air bubble New daily COVID
resumption starting flights agreements arrangement with arrangement with cases @ ~300K in
May 25th Graded resumption of signed with 24 27 nations 28 countries Jan 2022; down to
Lack of visibility on int’l travel under air- nations to enhance New Covid cases ~1K in Mar. 22
New Covid cases
resumption of Int’l bubble arrangement int’l operations rise to ~0.4 mn/ drop toResilience in airports traffic clearly visible with minimalistic impact
from the latest 3rd wave on air travel in India…
Domestic Air Traffic Volume (Feb’20 – Jan’22)
1,200
Average Daily Passengers (‘000)
A B
National
1,000 Lockdown Daily traffic
861 peaked before
the second wave
800
691 714 681 694
600 551 562 546
495
483 466 491 458
417 418 412
400 370
333 314
260
180 200
200 129 130 128
19
-
A (recovery after national lockdown) In 2020 the average number of daily passengers in India rose from 128,667 in Jun’20
to 545,600 in 8 months
B (recovery after second wave) However, after the second wave, a similar recovery in traffic required only five months
indicating domestic travel recovery has become more resilient to the impact of the pandemic
Impact of 3rd wave in Jan’22 was far less pronounced – international traffic remained unaffected and domestic traffic
recovered fast
Source: AAI Traffic News
35…with clear signs of gaining momentum especially with domestic pax
recovery to pre-Covid levels and stable international pax as well
Delhi Airport Daily Pax Hyderabad Airport Daily Pax
Domestic ('000) Domestic ('000)
92% of pre-covid 96% of pre-covid
150
50
120 40
90 30
60 20
30 10
0 0
1 - 2 Jan
3 - 9 Jan
Feb
Apr
Aug
Sep
10 - 16 Jan
17 - 23 Jan
24 - 31 Jan
Oct
Nov
Dec
Mar
9- 31 May
Jun
Jul
1-8 May
10 - 16 Jan
17 - 23 Jan
24 - 31 Jan
9- 31 May
Feb
Aug
Sep
Oct
Apr
Nov
Dec
1 - 2 Jan
3 - 9 Jan
Mar
Jun
Jul
International ('000) 1-8 May
65% of pre-covid International ('000) 74% of pre-covid
60 12
50 10
40 8
30 6
20 4
10 2
0 0
Feb
Apr
Aug
Sep
10 - 16 Jan
17 - 23 Jan
24 - 31 Jan
Mar
Oct
9- 31 May
Nov
Dec
Jun
Jul
1 - 2 Jan
3 - 9 Jan
1-8 May
Feb
Sep
Apr
Aug
10 - 16 Jan
17 - 23 Jan
24 - 31 Jan
Mar
Oct
9- 31 May
Nov
Jun
Jul
1 - 2 Jan
3 - 9 Jan
1-8 May
Impact of 3rd wave was limited – international traffic was not affected and domestic traffic recovered strongly from January lows of 56-58% pre COVID lows
Passenger Profile: Increased passenger travel from Tier 2/ Tier 3 cities vs Metro; Friends & family/ Leisure travel vs Corporate travel
Possible 4th wave impact may be limited as economic and air traffic recovery post 2nd and 3rd waves were rapid
Traffic to gain momentum with lifting curbs in flight capacity, rise in vaccination
Scheduled international operations began on March 27, 2022 Countries have also started administering booster doses which will aid passenger
More international airlines resume pre-COVID flights with India confidence to travel
Fleet addition by major Indian airlines; takeover of Air India by Tata; entry of new
Significant part of population in various countries inoculated with at least one dose.
E.g. USA 74%, UK 78%, Canada 85%, Germany 74%, France 79% airlines including Jet Airways to boost passenger traffic
2020 2021 2022 Pre-Covid (Avg.)
____________________
Source: AAI, Company data 36Relaxation in Covid related travel restrictions across India given
100% vaccination of adults to be achieved by June 2022
2020 2021 2022
One 3rd of Two 3rd of
Lockdown & Suspension All major restrictions lifted Start of population population fully
of air traffic on 1st Sept 2020 vaccinations vaccinated vaccinated
Mar May Sep Sep Jan May Sep Jan Jun
Peak of 3rd
Resumption Peak of 1st wave Peak of
Wave
of domestic air travel in mid sept 2020 2nd Wave
Key highlights on vaccination status:
As of May 30, 2022, 74% of the eligible Indian population had received the first dose of the COVID-19 vaccine and 65% of
the eligible population had received both doses. Additionally, ~2.4% of the population have already received additional dose
37Smart city IT solutions augment operations and
boost underlying profitability
Drivers Smart digital enablers 1 Direct benefits
Passenger Experience
Centralized monitoring
Improve Passenger Experience and optimization
Efficiencies & Savings
Sensor Networks, Data
Integration, Revenue Opportunities
Extend Life-Cycle Value of
Airport Infrastructure Data Hub, Data Lake
Smart utility,
2 Indirect Benefits
infrastructure, energy,
waste
Increase Passenger Loyalty
Integrated and smart Increased Capacity
transportation
Improved Competition
Decrease Airport Operating Integrated ICCC
Costs Operations & Security
Increased Commercial Revenue
Airport smart IT infrastructure initiatives like Bots and IoT / AI provide value additive advantage in terms of efficiently managing traffic,
optimizing area allocation, maximizing ATM movements etc. in order to serve a much larger pax capacity without further capex
38GAL has been a pioneer in adopting cutting edge IT / digital solutions
and is in the league of renowned global airport operators
Initiatives at GAL
Measures
Covid -19
Touchless CUSS, Virtual Helpdesk, Social Distancing CCTV
Analytics, Thermal Imaging, UV Based Baggage Disinfectants, Thermal Imaging at
etc. Delhi Airport
Experience
Passenger
E-Boarding, Smarty Trolley, Smart Washroom, Self Bag Drop,
Baggage Tracking, Automated Tray Retrieval and Biometric
based PAX Screening
New Age
New E-POS & Concessionaire Management Platform,
Tech.
Automation settlement UDF & ASF, Smart Airside, Crowd
Automatic tray retrieval
Behavior Analytics, etc.
system at Delhi Airport
Duty Free
Vertical
360 Degree Virtual Store, Retail Store Heat Map, Wi-Fi Enabled
Proximity Marketing, Digital mirror to display product value
and range, etc.
Aircraft
MRO
AR/VR for remote guidance and certification, RFID based tool
Tracking System and Robotic Process Automation Remote Screening at
Delhi Airport
Next Generation blockchain based ERP & Vaccine Ledger for
Vertical
Cargo
tracking of vaccine shipments, Track & Trace of cargo
shipments using BLE technology, Safety Video Analytics
using CCTV feed, etc.
39Evolution of the highly successful airport PPP model in India
Discussions between Bangalore and Delhi and Mumbai AERA (Airports
stakeholders on Hyderabad airports’ airports’ Economic Regulatory
concessions concessions
various privatization Authority of India)
awarded on single awarded on hybrid
models at the metro created as a regulatory
till basis with a till basis with
airports revenue share model revenue share model body for major airports
1996 - 2003 2004 2006 2009
2021-22 2019 2017
Privatization of 6
AAI exploring airports
Plans to privatize 25
divestment of residual Winning bidder chosen AERA allows new
airports in Tier - 2 and
stake in Mumbai, Delhi, on per domestic airports to follow hybrid
Tier – 3 cities by 2025
Hyderabad and passenger fee, as till model
and
Bangalore airports against revenue share
model earlier
40You can also read