Global wind power: 2017 market and outlook to 2022 - PES
←
→
Page content transcription
If your browser does not render page correctly, please read the page content below

PES ESSENTIAL
Global wind power: 2017
market and outlook to 2022
PES asked Steve Sawyer, Secretary General at GWEC for his record investment of USD 348.5bn (EUR
324.6bn) in 2015. According to BNEF,
outlook on the future of the wind industry markets. Will prices China alone accounted for 40% of total
investment with US$ 133bn (EUR 118.7bn);
continue to fall or have they reached their lowest point? Where and the Asia Pacific region as a whole
is the market increasing? Where is it slowing down? Read on invested US$ 187 billion, over 57% of the
total. Total investment in wind amounted
and find out… to 107 billion US$. 2
Cratering prices for both onshore and
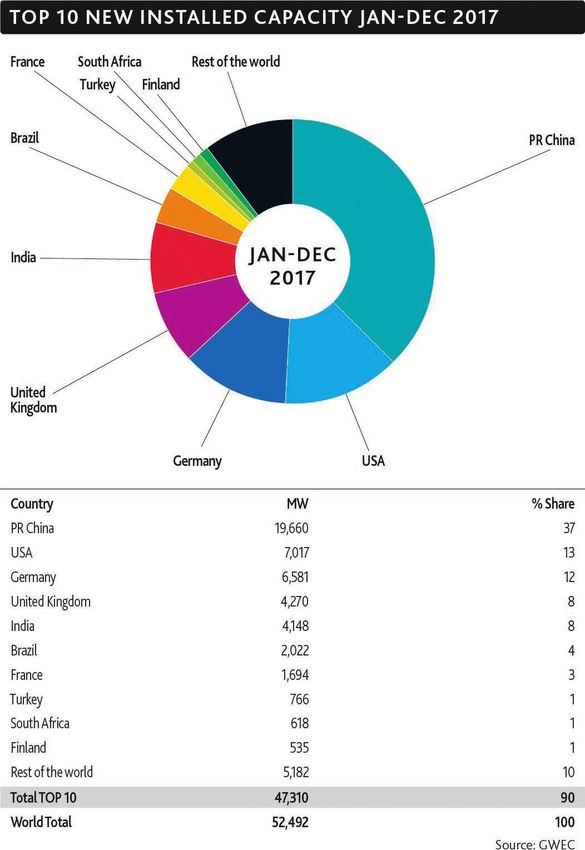
The global wind power market remained increase on the 2016 market, bringing total offshore wind continue to surprise. Markets
above 50 GW in 2017, with Europe, India global installations to 18,814 MW, and in such diverse locations as Morocco, India,
and the offshore sector all having record representing a 30% increase in cumulative Mexico, Brazil and Canada range in the
years. Chinese installations were down - capacity globally. Offshore was about 8.4% area of US$ 0.03/kWh, with a recent
19.66 GW - but the rest of the world made of the 2017 annual market, and represents Mexican tender coming in with prices below
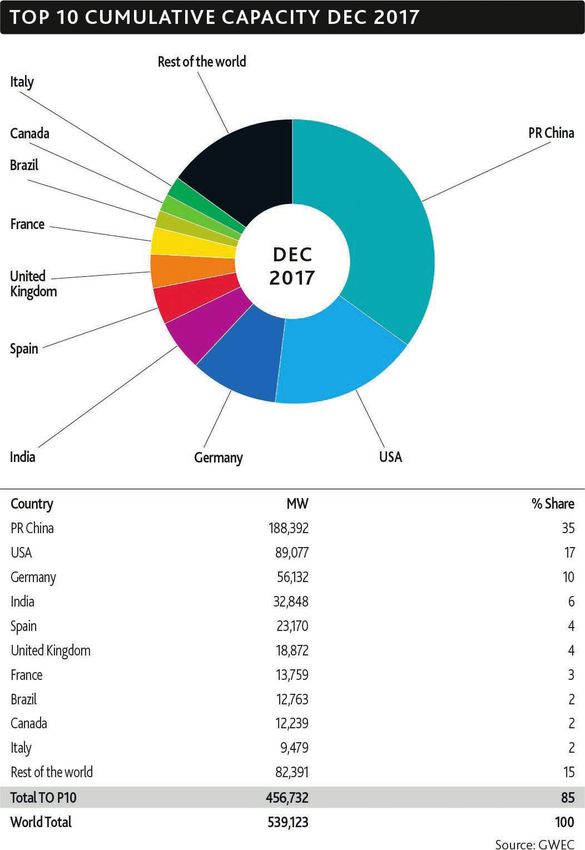
up for most of that. Total installations in about 3.5% of cumulative installed US$ 0.02. I think we can safely consign the
2017 were 52,492 MW, bringing the global capacity, but it’s growing quickly. phrase ‘renewables are too expensive’ to
total to 539,123 MW. The annual market the dustbin of history.
Total new investment in clean energy rose
was in fact down 3.8% on 2016’s 54,642
to US$ 333.5bn (€296.8bn1) in 2017, up Meanwhile, offshore wind had its first
MW; and the cumulative total is up 11%
3% over 2016, but still lower than the
over 2016’s year-end total of 487,219 MW.
2 https://data.bloomberglp.com/bnef/
The offshore segment had a record year 1 Exchange rate used for USD to EUR conversion sites/14/2018/01/BNEF-Clean-Energy-Investment-
with 4,331 MW of installations, an 87% (USD1 = EUR 0.89) Investment-Trends-2017.pdf
1 PES Wind
PES ESSENTIAL

‘subsidy-free’ tender in Germany last year,
with tenders for more than 1 GW of new
offshore capacity receiving no more than
the wholesale price of electricity. A Dutch
‘subsidy-free’ offshore tender in early 2018
followed suit. While it will be some years
before this is the new normal, offshore
going forward is economically competitive
with any and all new forms of generation, at
least in Europe; offshore prices for projects
to be completed in the next 5 years are half
of what they were for the last five years; and
this has sparked huge interest in the
technology around the globe: in the United
States, Japan, South Korea, Taiwan, India,       sophisticated market structures for                  By the end of 2017 there were 30 countries
Australia and even Brazil!                       matching up supply and demand at all                 with more than 1,000 MW installed: 18 in
2017 was not a spectacular year in terms of      scales are just some of the elements                 Europe; 5 in Asia-Pacific (China, India,
global installations, but key developments       beginning to emerge.                                 Japan, South Korea & Australia); 3 in North
marked the forward progress of the energy                                                             America (Canada, Mexico, US), 3 in Latin
                                                 China, the largest overall market for wind           America (Brazil, Chile, Uruguay) and 1 in
transformation. Driven by the improving
                                                 power since 2009, retained the top spot in           Africa (South Africa). Nine countries have
economics of wind power, as well as solar
                                                 2017. In 2017, wind power produced 305.7             more than 10,000 MW of installed capacity:
and storage, the outlines of a future
                                                 TWh, an increase of more than 26%                    China, the US, Germany, India, Spain, the
sustainable energy system are beginning to
                                                 compared with 2016, and accounts for about           UK, France, Brazil and Canada.
become clear.
                                                 4.75% of total Chinese power generation.3
‘Hybrid’ wind/solar/storage plants are now                                                            China will cross the 200,000 MW mark in
                                                 Installations in Asia once again led global          2018, adding another milestone to its
being built, able to supply clean reliable
power 24/7 for much of the year; utilities are   markets, with Europe in the second spot,             already exceptional history of renewable
seriously experimenting with battery             and North America in third. Once again in            energy development since 2005.
storage in place of peaker plants; and EV        2017, as has been the case since 2010
                                                 (except 2012), the majority of wind                  Looking ahead
sales are booming in key markets. The
development of local micro-grids, some           installations globally were outside the OECD.        The aftermath of the global financial crisis
using peer to peer power trading with            3 https://chinaenergyportal.org/en/2017-electrici-   in the previous decade resulted in average
blockchain technology, and more and more         ty-energy-statistics/                                global markets of about 40 GW/annum for

                                                                                                                           www.peswind.com           2
PES ESSENTIAL

    the period from 2009 to 2013. Breaking         grow, albeit at a slower pace, in the           and fewer markets. North America looks
    through the 50 GW barrier for the first        beginning of the new decade. We expect          pretty stable for the next few years, and
    time in 2014, the industry set a record of     to see total cumulative installations reach     we’re expecting Mexico to start to fulfil its
    more than 60 GW due to anomalously             840 GW by the end of 2022.                      promise in 2018.
    high installations in China in 2015. In 2016
                                                   The Asia market continues to dominate           Despite the fact that Brazil’s political and
    the market returned to the ‘new normal’ of
                                                   and will do so for the foreseeable future.      economic woes have abated somewhat, we
    just over 54 GW, and 2017 was in the
                                                   While China continues to be by far the          will feel the effect of the lack of auctions for
    same range.
                                                   largest market globally, the days of            most of the last two years over the next
    What does all this mean for wind markets       dramatic year-on-year annual market             three years. Argentina is one of the
    in 2018-2022? We expect the annual             increase are probably over, at least for the    brightest spots in the wind universe at the
    market to remain at roughly 2017’s level for   next few years. India will play a much          moment, and Chile will continue to grow, as
    2018 due to anticipated decreases in           stronger role, although the 2018 market         will some of the smaller Latin American
    Germany, the UK and India. This will be        will disappoint. Europe is unlikely to repeat   markets. The South African hiatus is over,
    balanced by increases in North America,        the record installation levels of 2017, but     and there should also be significant
    the Middle East and Africa and Latin           we’ve been looking for a downturn in            installations in North Africa in the coming
    America. The annual market will return to      Europe for the last five years at least, and    years. Australia will continue to be the only
    growth in 2019 and 2020, breaching the 60      it hasn’t come yet, although there has          significant market in the Pacific for the
    GW barrier once again and continue to          been a worrying concentration in fewer          coming years as the fulfilment of the
                                                                                                   Mandatory Renewable Energy Target
                                                                                                   proceeds apace.
                                                                                                   Will there be unforeseen surprises?
                                                                                                   Probably. Will Russia and Saudi Arabia
                                                                                                   finally begin to reach their potential and
                                                                                                   provide rapidly growing major new markets
                                                                                                   for the industry? Perhaps. What about the
                                                                                                   Vietnam, the Philippines and the rest of the
                                                                                                   Southeast Asia? The only thing that we can
                                                                                                   say for certain is that the increase in the
                                                                                                   rate of change in energy markets will
                                                                                                   continue to accelerate in the coming years.
                                                                                                   Wind power is increasingly the most
                                                                                                   competitive way of adding new power
                                                                                                   generation to the grid in an increasing
                                                                                                   number of markets, even competing
                                                                                                   against heavily subsidized incumbents;
                                                                                                   and for the first time we can say that this
                                                                                                   now includes offshore.
                                                                                                   Wind is a mature technology, with proven
                                                                                                   reliability and cost competitiveness. It is
                                                                                                   both more and more often the technology
                                                                                                   of choice for utilities, and has also
                                                                                                   dominated the surging corporate PPA
                                                                                                   market, where savvy companies look to

3   PES Wind
PES ESSENTIAL

both provide a hedge against potentially       are solid signs that it will in 2018, but we   charge in the transition away from fossil
wildly fluctuating fossil prices, and at the   shall see.                                     fuels; and continues to blow away the
same time reduce their carbon footprint –      There is a still an acute need around the      competition on price, performance
not to mention ‘greening’ their image with     world for new power generation, which is       and reliability.
increasingly vigilant consumers.               clean, affordable, indigenous, reliable and
                                               quick to install. Wind power is leading the      www.gwec.net
Wind is making a rapid transition from a
technology reliant on ‘support’ in most
markets, to one where it stands on its own
economically, even without any kind of
financial benefit for the major rewards
society reaps from its deployment in
terms of clean air and carbon-dioxide
emissions reductions. Hopefully we’ll get
there one day. But in the meantime, the
industry will have to struggle with shifting
policy regimes and the inevitable gaps
that accompany them and do our best to
take it to the next level – annual
installations of 60, 70, or even 100 GW/
year. This will be necessary to meet the
Paris targets and secure a sustainable
energy future on a planet left habitable for
succeeding generations.
2017 saw a concentration of installations in
a smaller number of markets in Europe,
Africa, and Latin America, reversing a trend
for a diversification of markets that has
marked the industry’s growth over the last
decade. That needs to change, and there

                                                                                                                    www.peswind.com       4

You can also read